
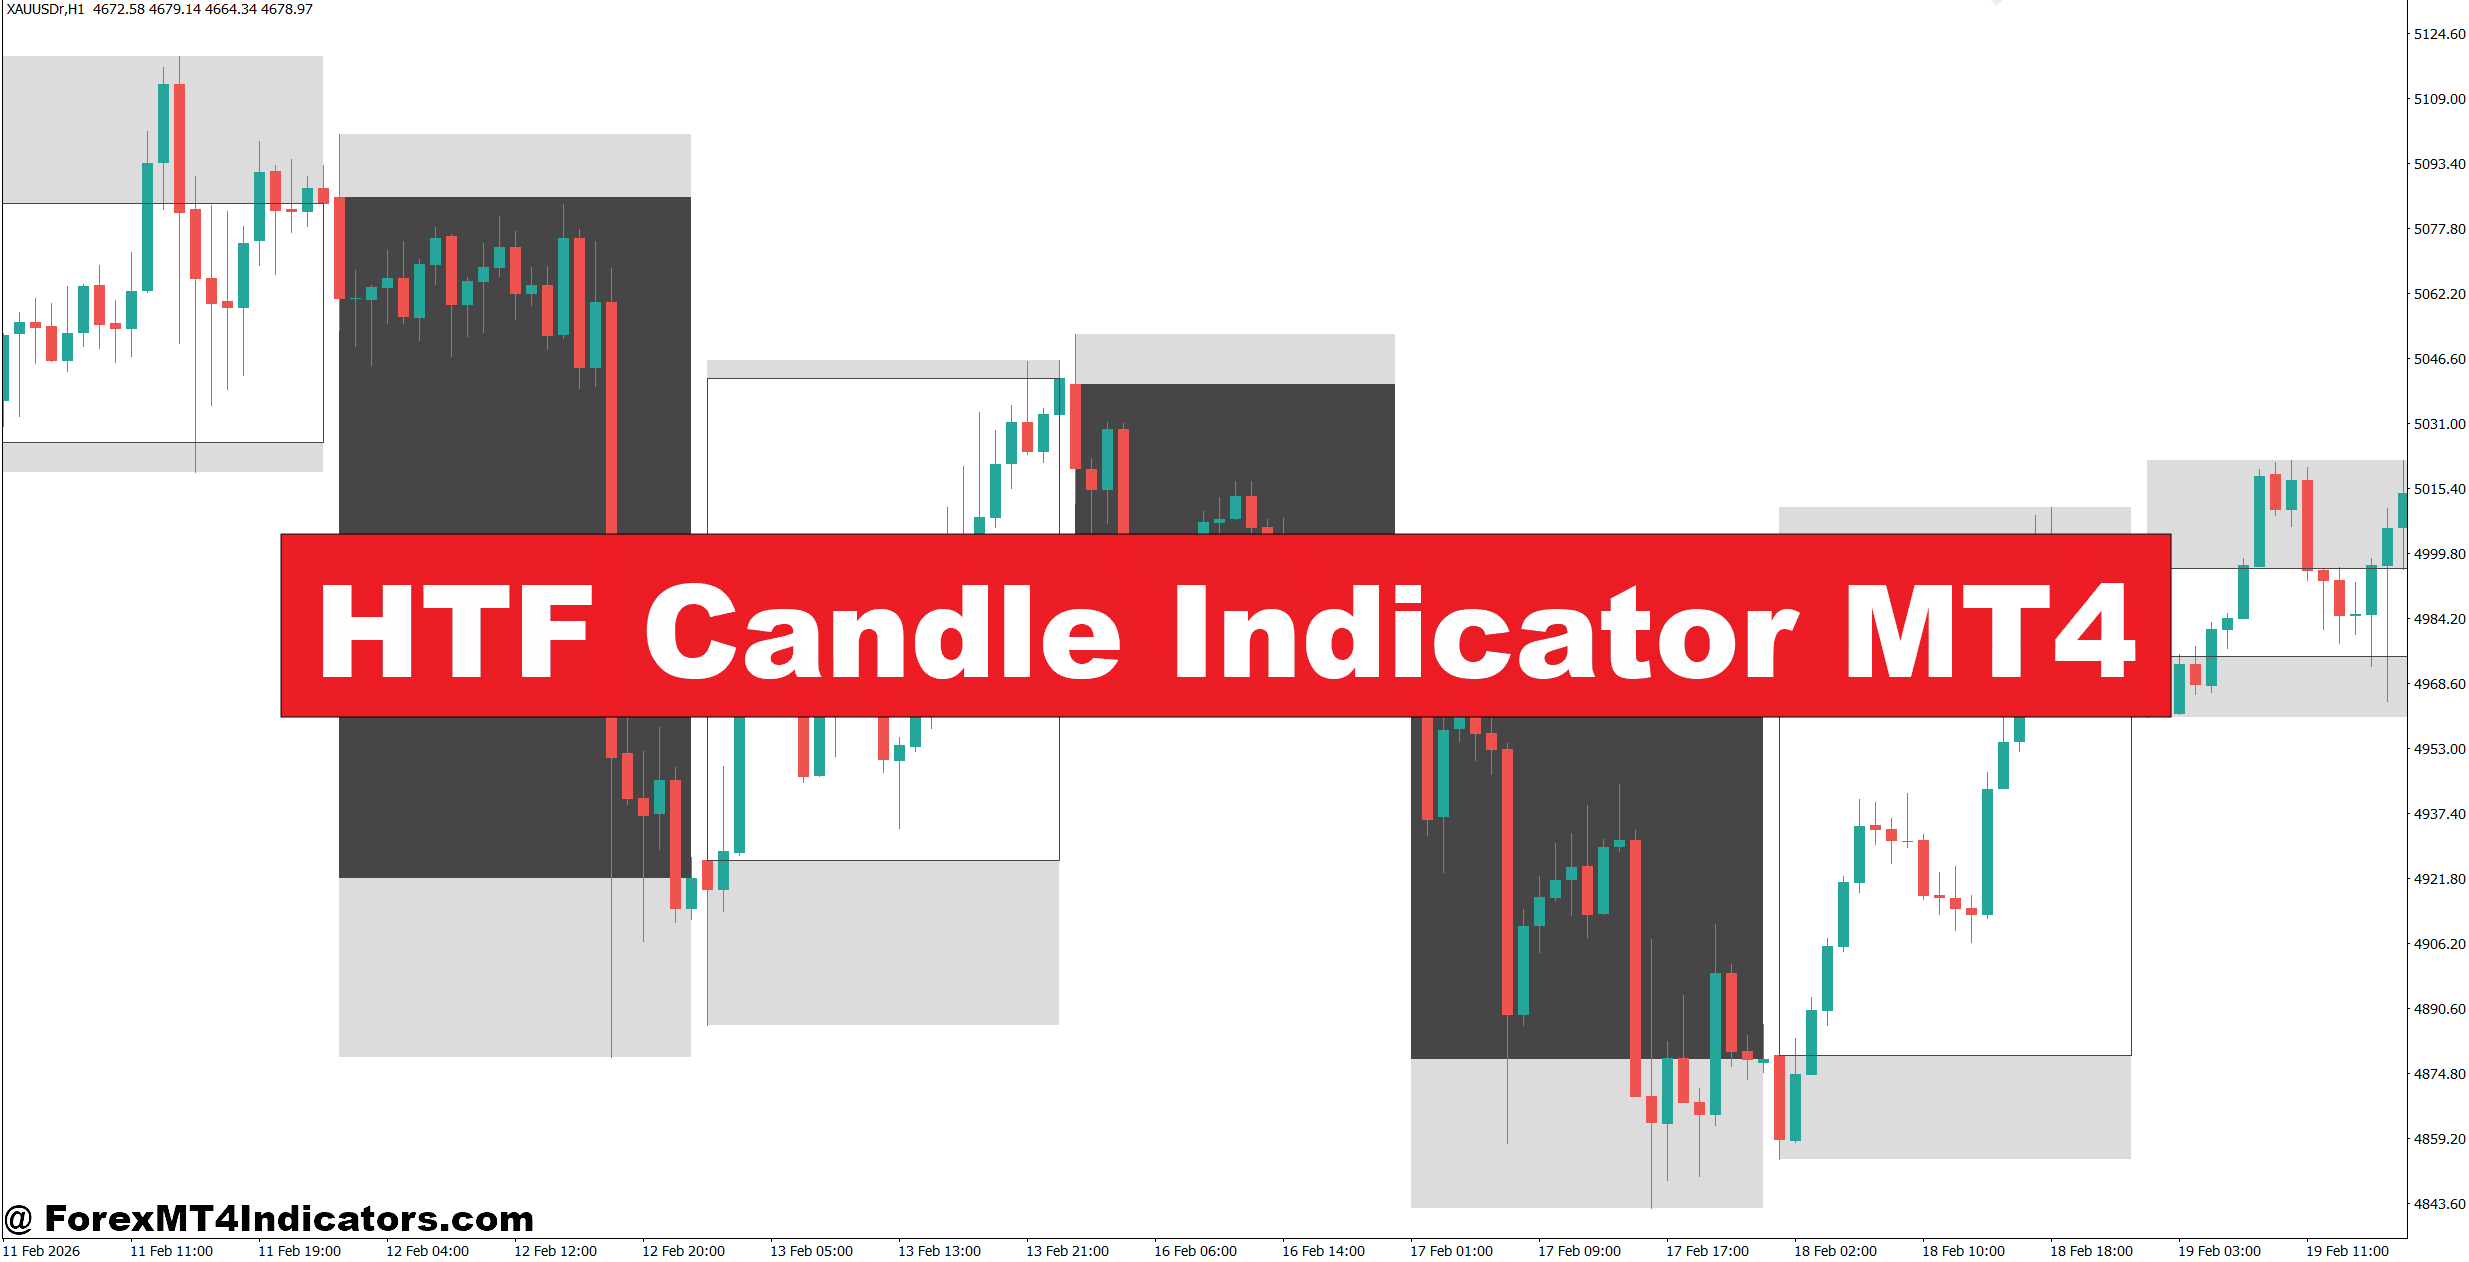
The HTF Candle Indicator MT4 helps solve this problem by displaying higher timeframe candles directly on a lower timeframe chart. Instead of switching between multiple charts, traders can quickly see the bigger market picture while managing entries on their preferred timeframe. This simple feature helps improve trend recognition and keeps traders from trading against the dominant market direction. When used with solid risk management and price action analysis, it becomes a useful tool for filtering trades. The following sections explain how the indicator works, how traders can apply it in real market conditions, and where it performs best.

Understanding the HTF Candle Indicator MT4
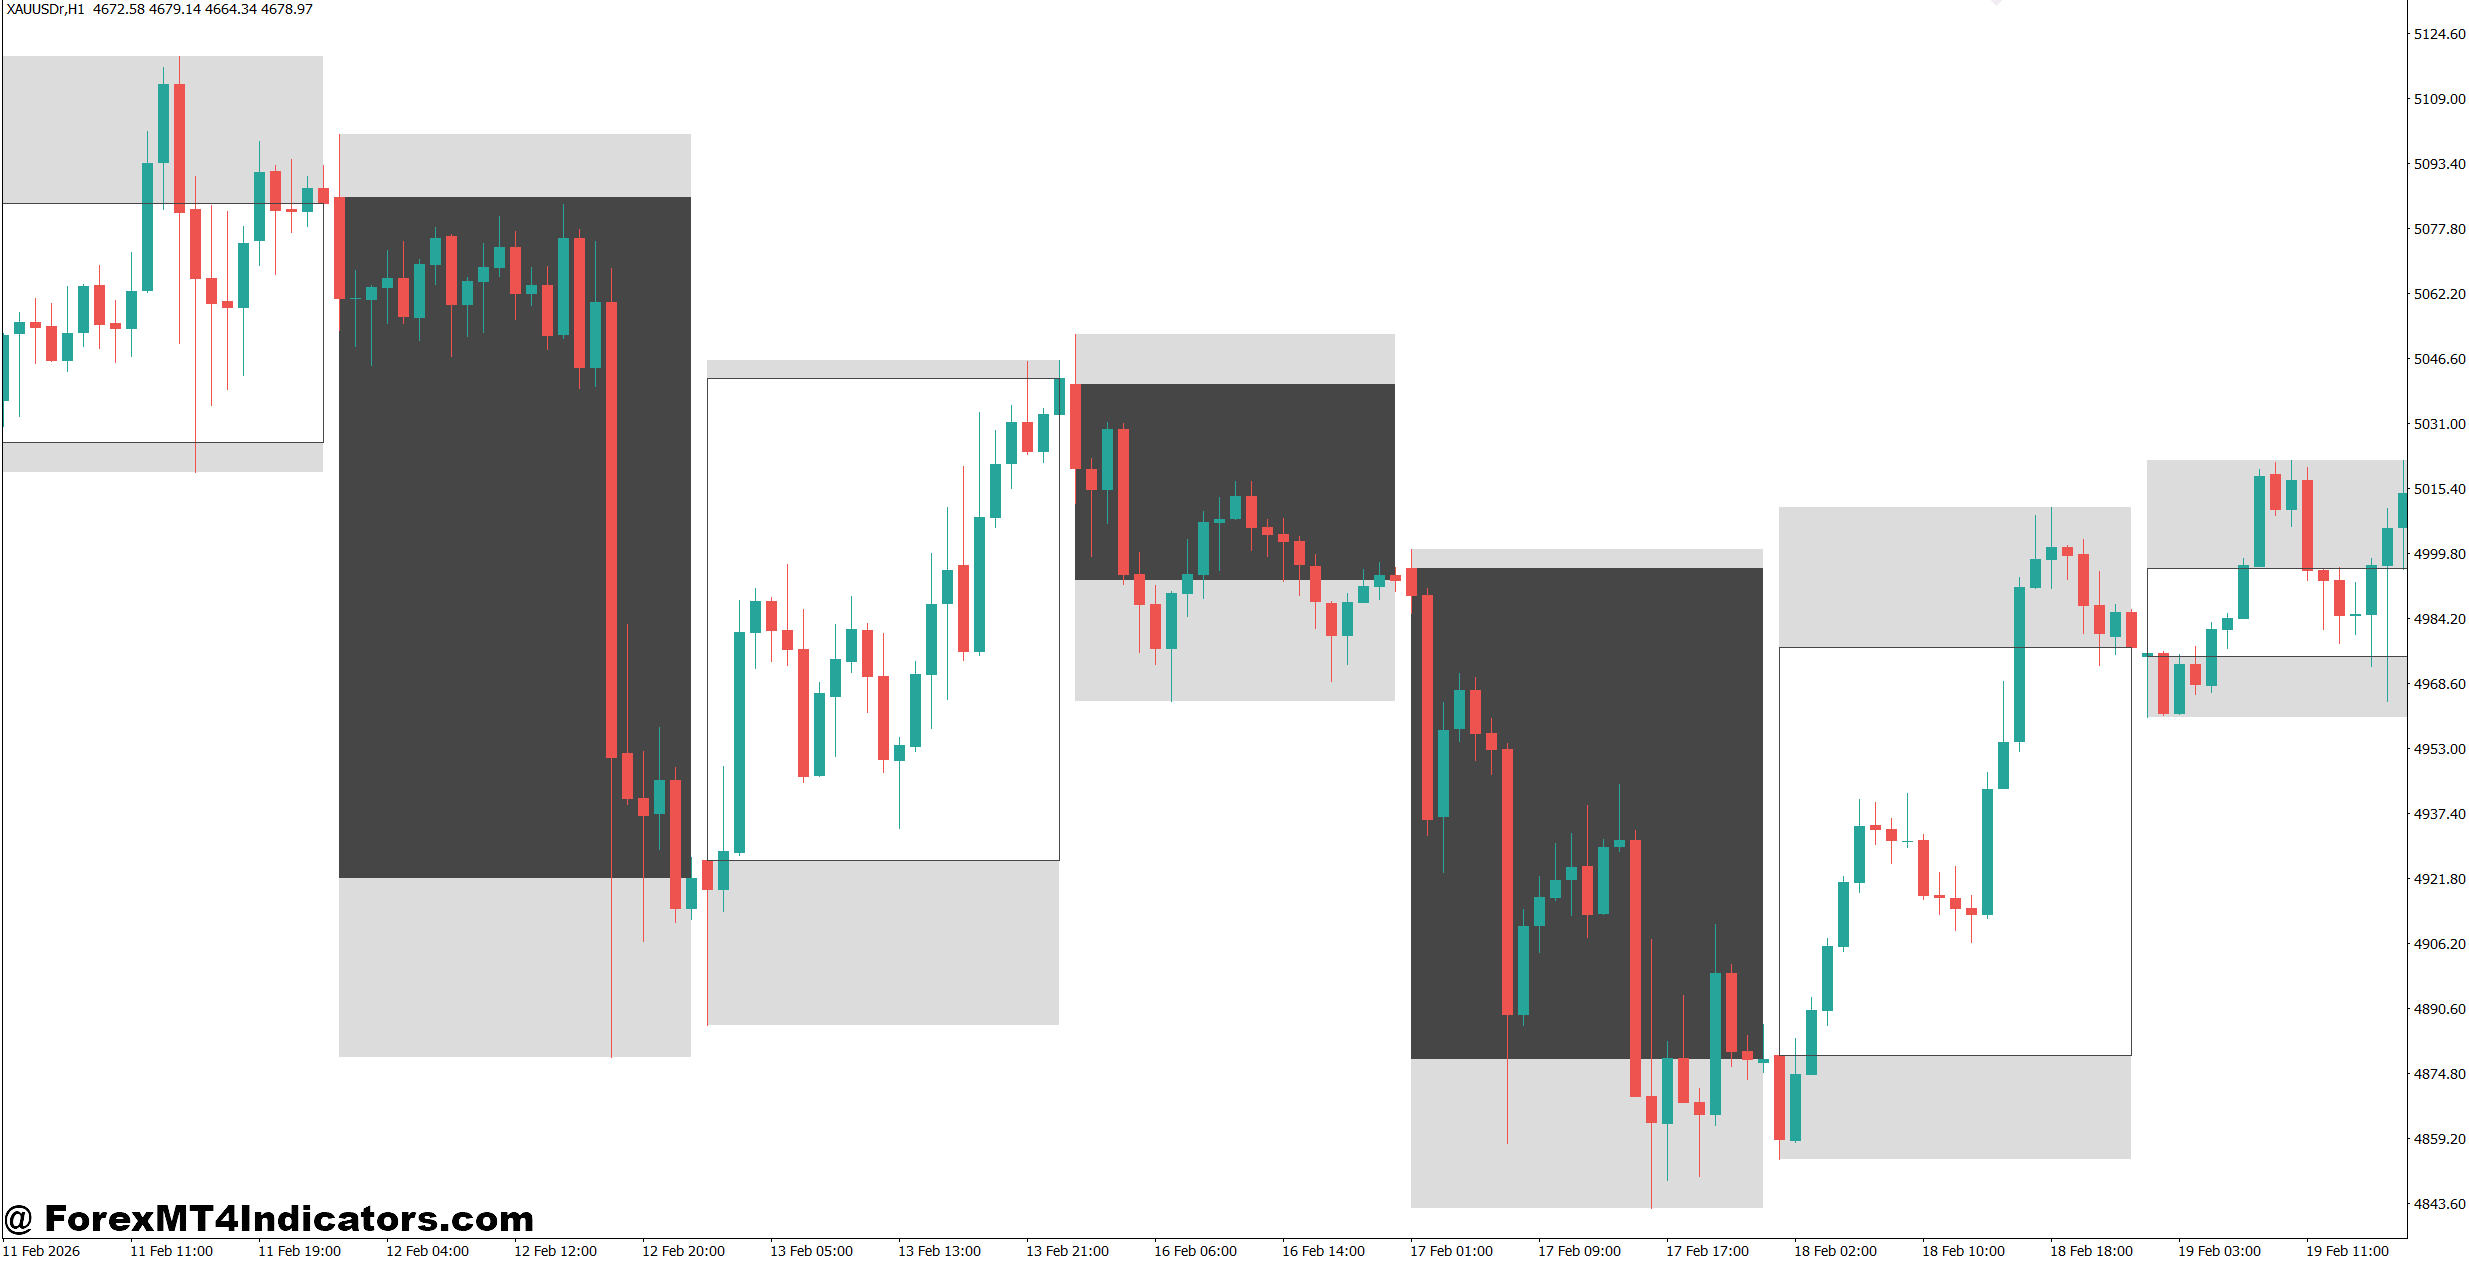
The HTF Candle Indicator MT4, short for Higher Timeframe Candle Indicator, overlays candles from a larger timeframe onto a smaller chart. For example, a trader viewing a 15-minute chart can display 1-hour or 4-hour candles without leaving the current workspace.
Each higher timeframe candle is built from several smaller candles. A single 1-hour candle contains four 15-minute candles, while one daily candle includes twenty-four hourly candles. The indicator combines this information and presents it visually, allowing traders to monitor both short-term price movement and the broader trend.
This approach saves time and reduces chart switching. More importantly, it keeps traders focused on the market structure that often drives significant price moves.
How the Indicator Builds Higher Timeframe Candles
The indicator collects the Open, High, Low, and Close values from the selected higher timeframe. It then draws those candles over the current chart while updating them as new price data arrives.
For instance, if a trader selects the H4 timeframe while trading on M15, each four-hour candle gradually forms over sixteen 15-minute candles. As the session progresses, traders can monitor whether buyers or sellers remain in control before committing to a position.
This calculation doesn’t predict future prices. It simply presents higher timeframe information in a way that is easier to analyze alongside lower timeframe entries.
Using the Indicator in Real Trading
Many traders combine higher timeframe analysis with lower timeframe execution. The HTF Candle Indicator MT4 makes this process much faster.
Imagine EUR/USD trading on the 15-minute chart. The displayed H4 candles continue printing higher highs and higher lows, confirming a strong bullish trend. Instead of selling every small pullback, the trader waits for price to retrace toward a previous support zone before entering a buy trade.
In one practical example, EUR/USD retraced around 25 pips into a support area while the H4 candle remained bullish. A bullish engulfing candle appeared on the M15 chart, creating an entry signal. The trader placed a stop-loss 18 pips below the recent swing low and targeted 45 pips near the previous resistance level. The trade offered a risk-to-reward ratio of roughly 1:2.5.
The same principle works during bearish trends. GBP/USD on the 1-hour chart may show consecutive bearish daily candles. Instead of buying temporary rallies, traders can wait for price to reject resistance before looking for sell opportunities.
When testing this approach during volatile Non-Farm Payroll (NFP) sessions, many traders noticed that waiting for the higher timeframe candle to confirm direction helped avoid several false breakouts. That doesn’t remove risk, but it can reduce unnecessary trades during highly unpredictable conditions.
Settings and Practical Customization
The indicator usually includes several adjustable settings that suit different trading styles.
One of the most useful options is the timeframe selection. Day traders often display H1 candles while trading M5 or M15 charts. Swing traders may prefer showing daily candles on the H4 chart to stay aligned with the broader trend.
Color customization is another practical feature. Many traders use green candles for bullish movement and red candles for bearish movement, making trend direction easier to identify during busy trading sessions.
Some versions also allow users to adjust candle width, transparency, and spacing. These settings help prevent the higher timeframe candles from covering important price action underneath.
Different currency pairs may require different approaches. For example:
- EUR/USD generally responds well to H1 and H4 candle confirmation during the London session.
- GBP/JPY often benefits from higher timeframe filtering because of its larger daily volatility.
- USD/CAD traders may combine the indicator with moving averages to avoid trading during sideways conditions.
No single setting fits every market. Traders usually spend time testing different combinations through historical charts before applying them in live trading.
Strengths, Weaknesses, and Comparison with Similar Tools
One reason many traders like the HTF Candle Indicator MT4 is its simplicity. It provides valuable context without adding complex calculations or overwhelming the chart.
The indicator offers several advantages:
- It helps identify the dominant trend quickly.
- It reduces frequent chart switching.
- It improves trade filtering when combined with support and resistance.
- It works well alongside moving averages, RSI, MACD, and price action strategies.
Still, it has clear limitations.
The indicator doesn’t generate entry signals by itself. Traders still need confirmation from candlestick patterns, momentum, or market structure. During ranging markets, higher timeframe candles may also provide mixed signals that offer little trading advantage.
Another limitation appears during major economic news releases. Even when the higher timeframe trend looks strong, sudden announcements can trigger sharp reversals that ignore technical analysis.
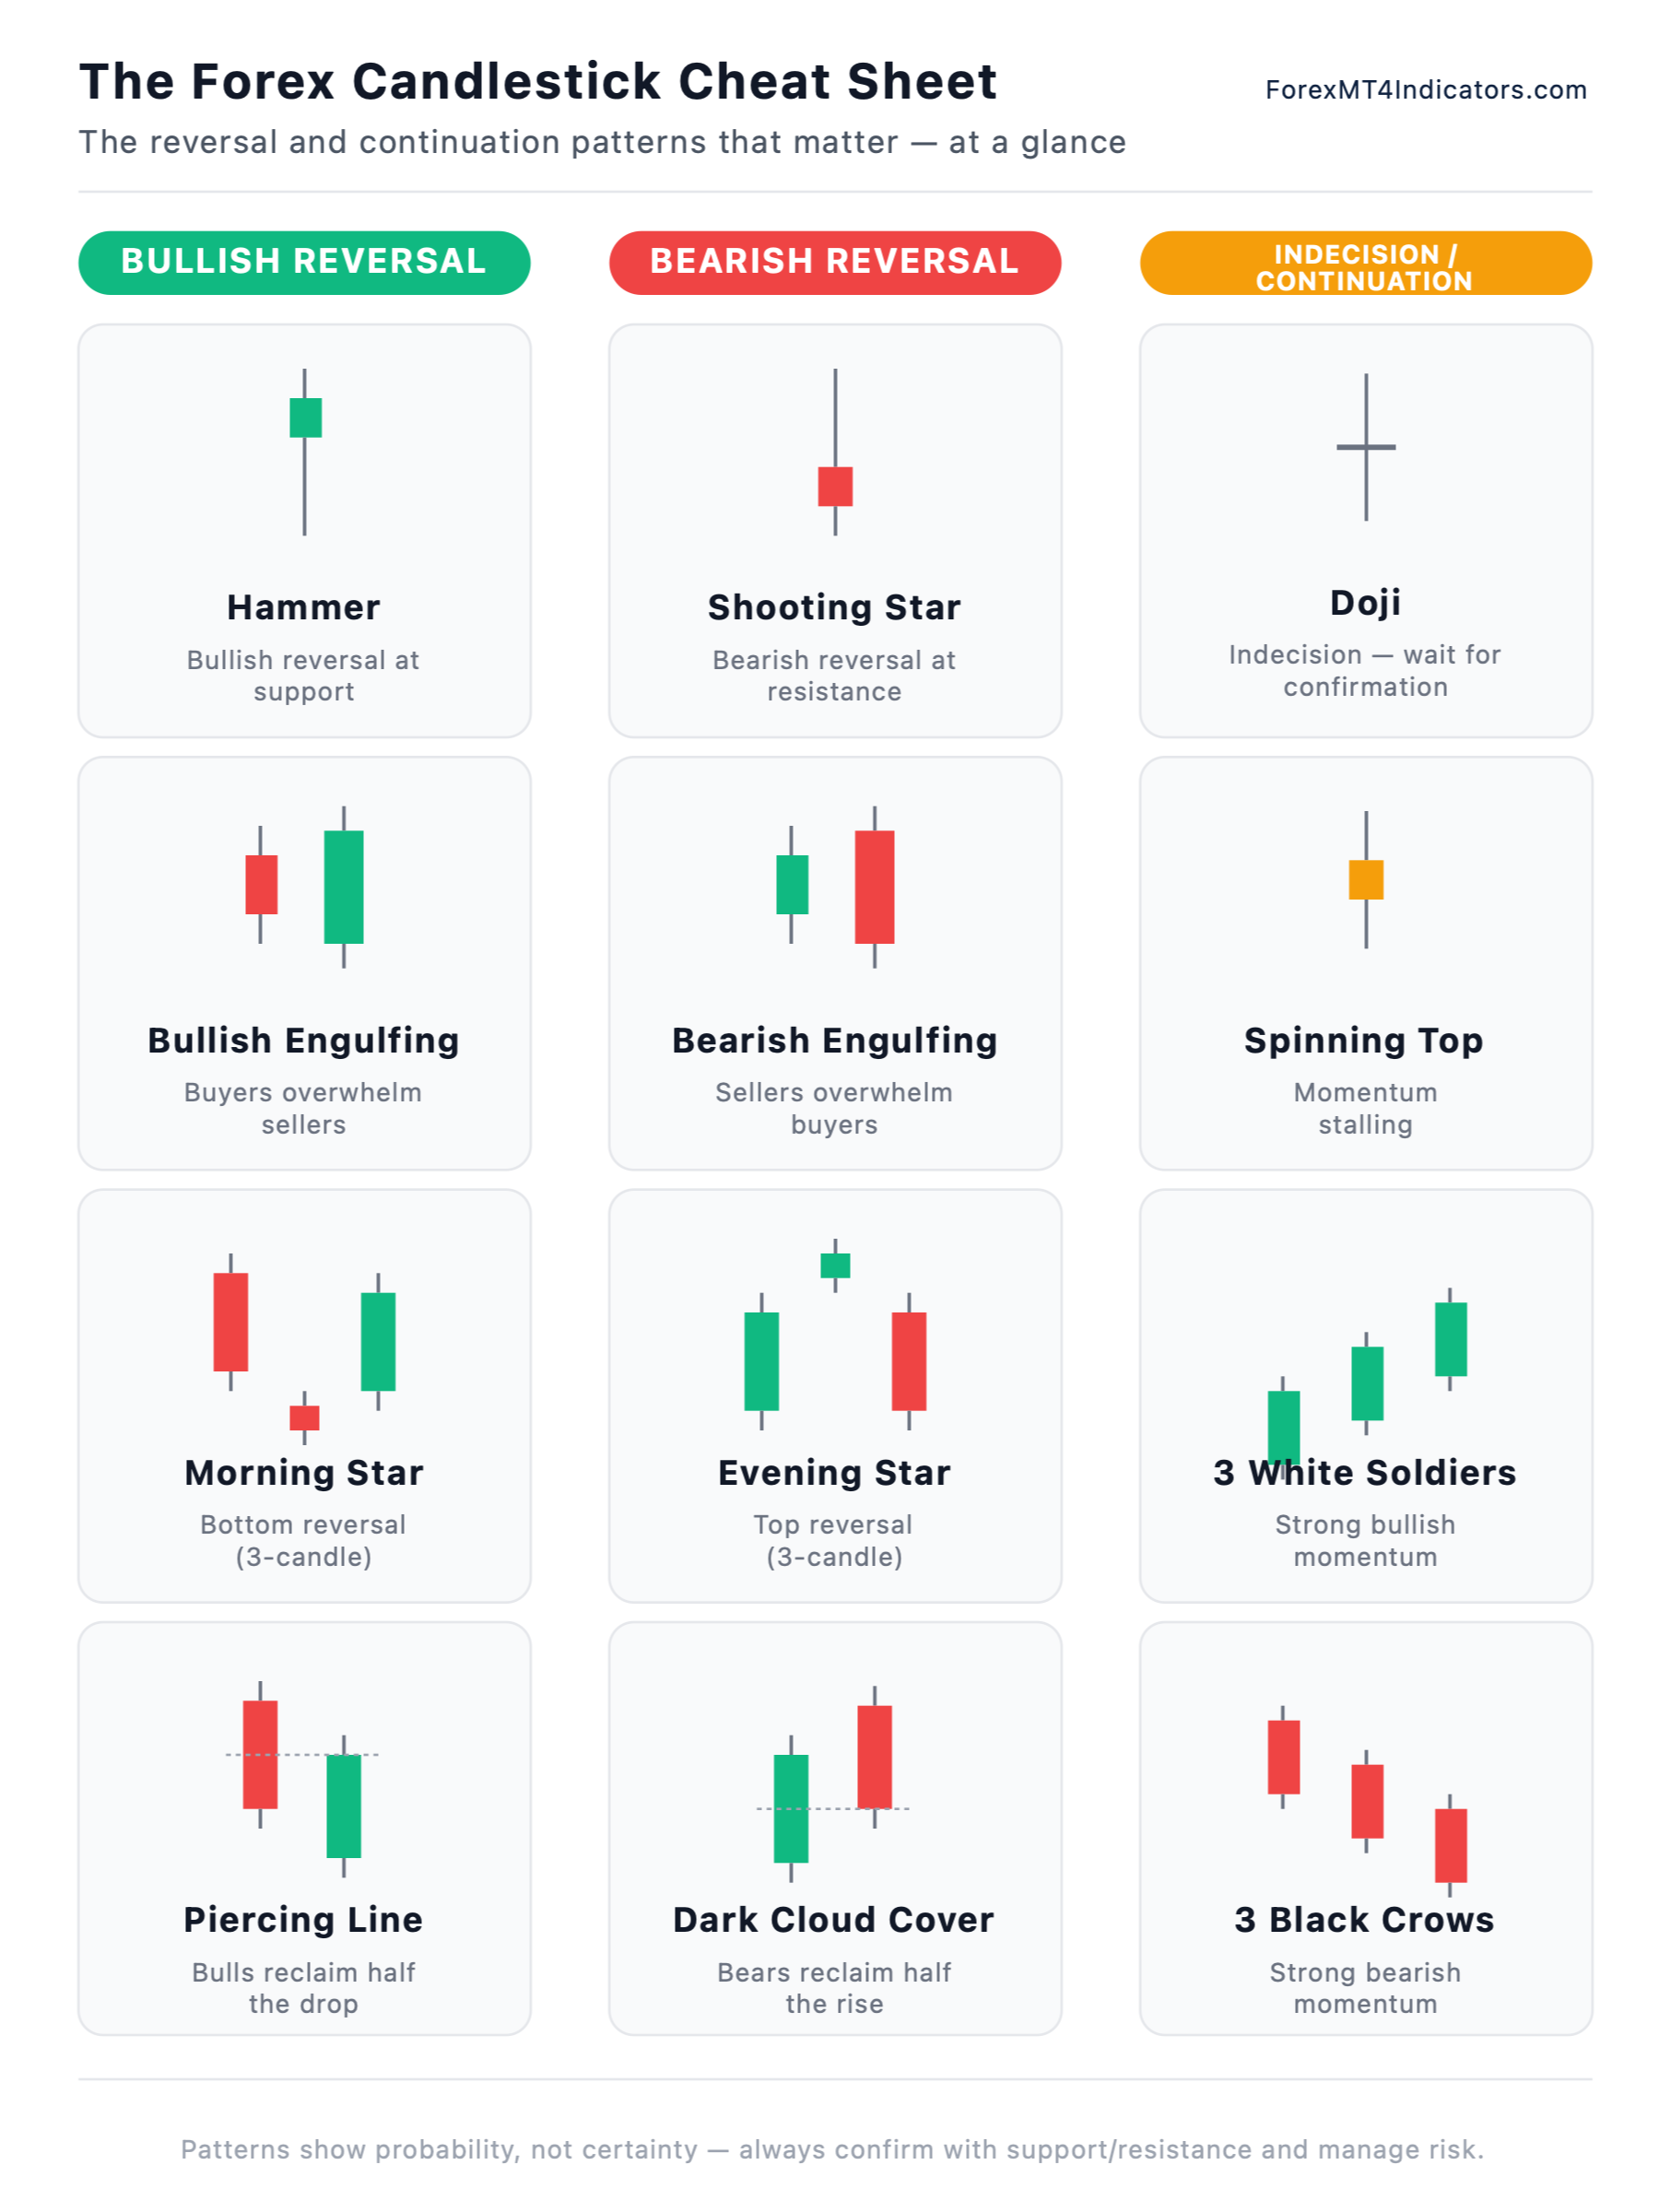
Compared with a standard Moving Average, the HTF Candle Indicator provides direct price structure rather than an averaged price. Moving averages smooth market movement but often react more slowly. Compared with Heikin Ashi candles, the HTF Candle Indicator displays actual market prices instead of modified candle calculations. Traders who rely heavily on raw price action usually appreciate this difference.
Trading forex carries substantial risk. No indicator guarantees profits. Every position should include a planned stop-loss, realistic profit target, and proper position sizing based on account risk.
How to Trade with HTF Candle Indicator MT4
Buy Entry
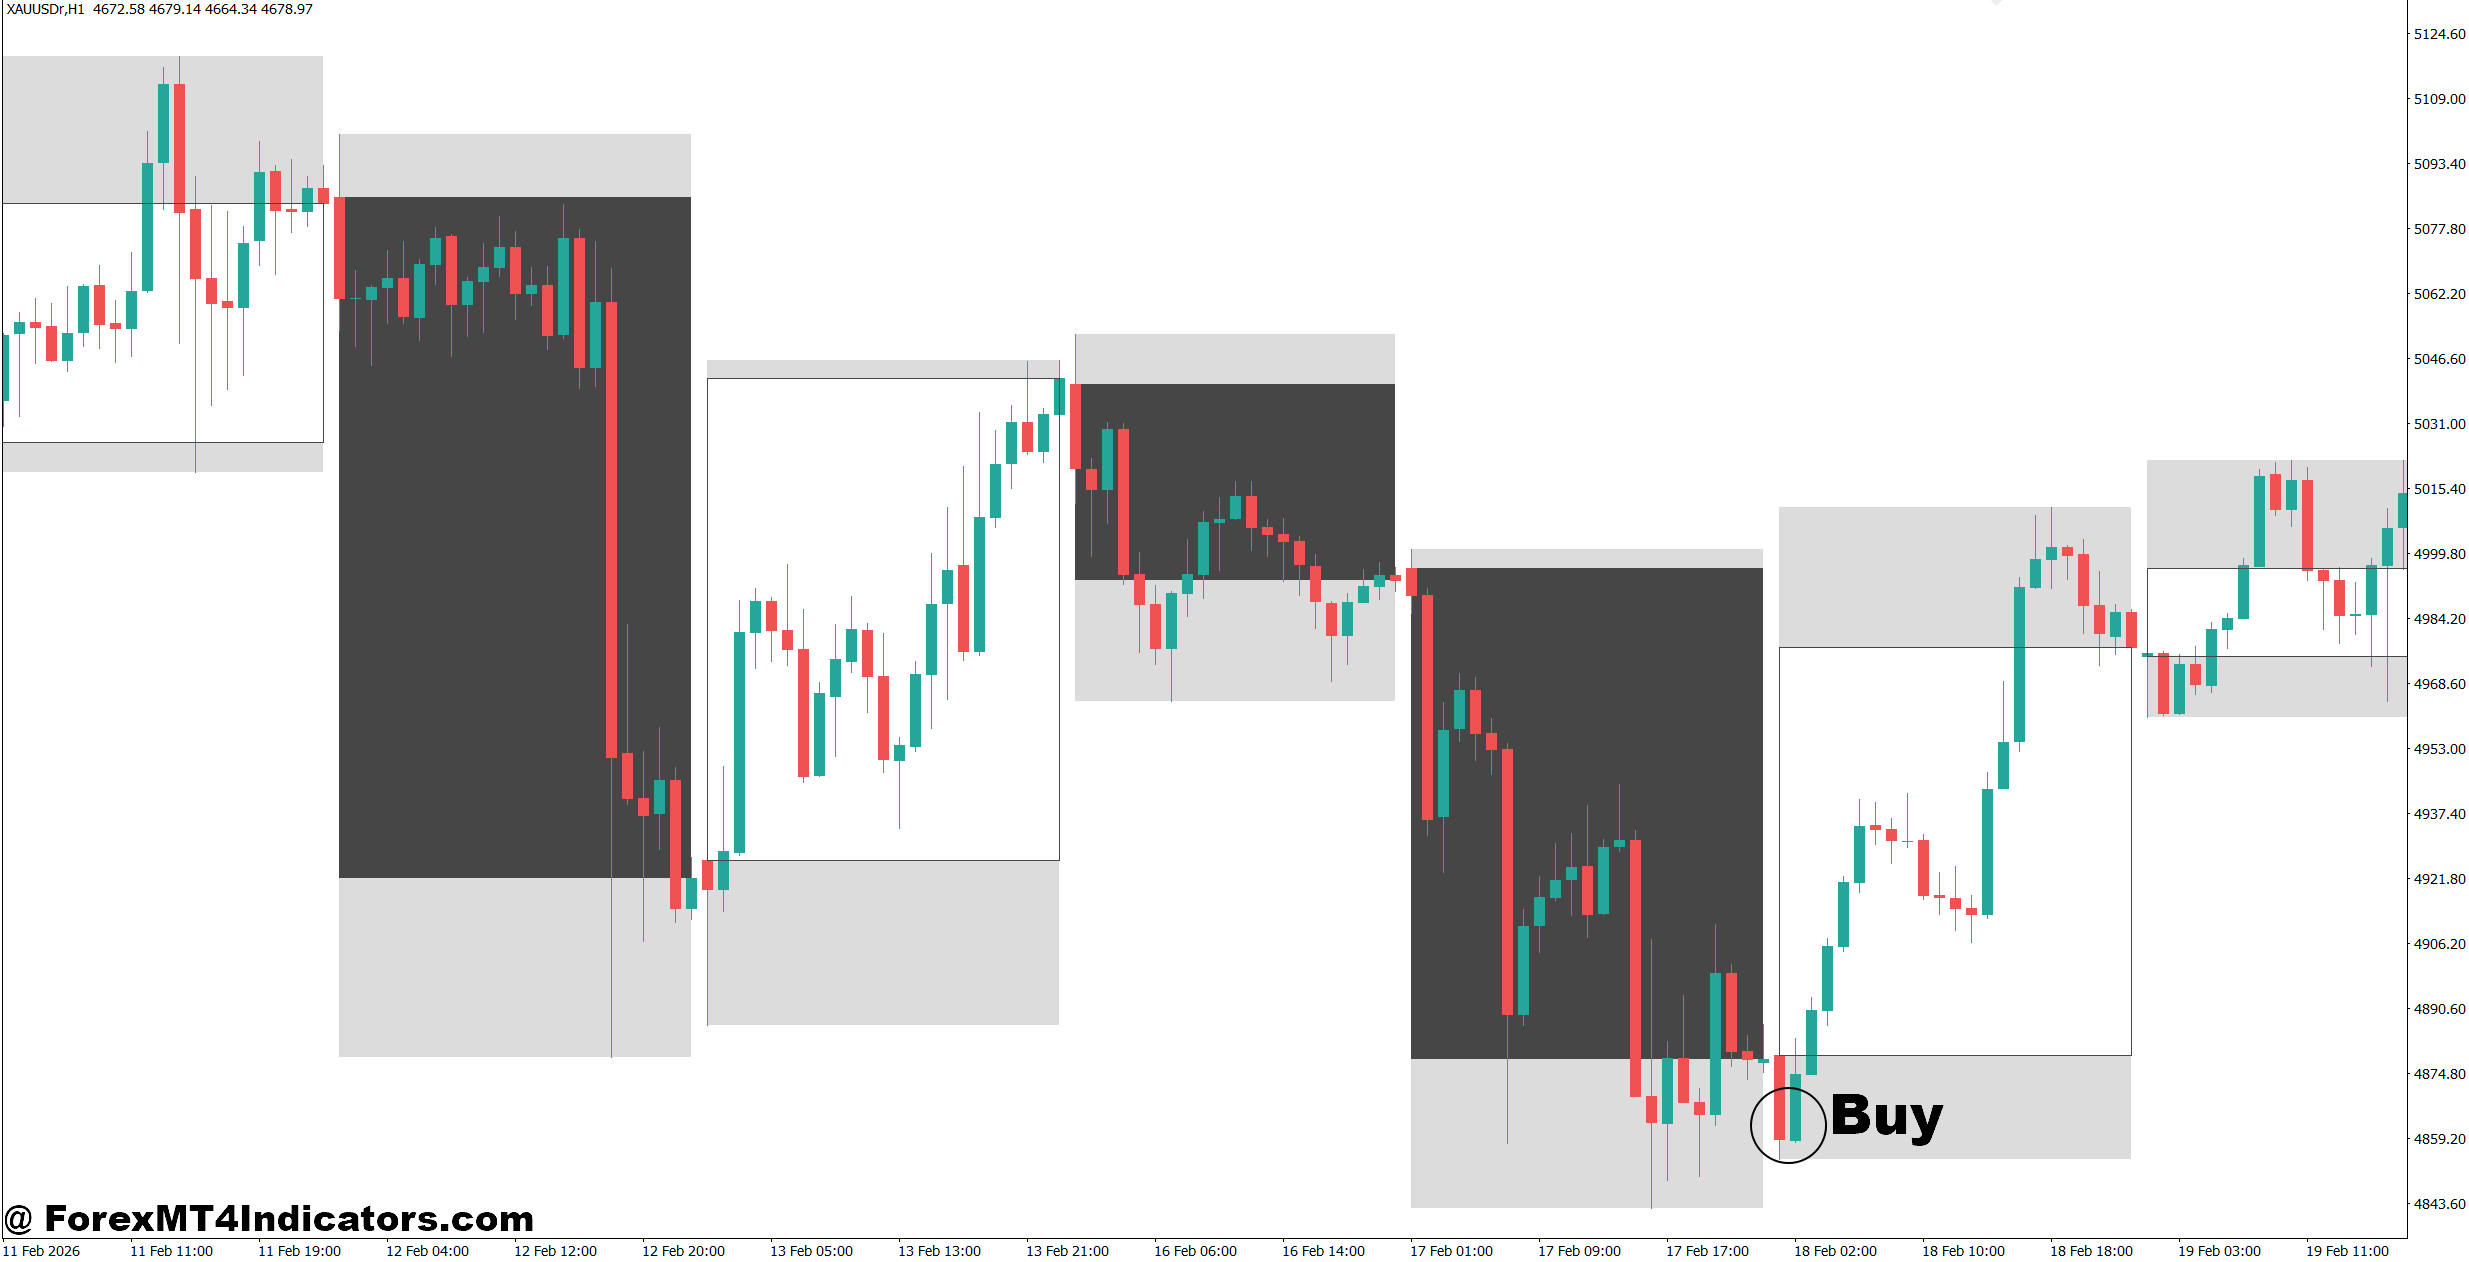
- Trade with bullish HTF candle – Buy when the H4 candle is bullish and the M15 chart forms a bullish engulfing pattern. Target 30-60 pips with a 15-20 pip stop-loss.
- Buy after support bounce – Enter on EUR/USD 1-hour when price rejects a key support level and the HTF candle remains bullish.
- Wait for candle confirmation – Open a buy only after the current HTF candle closes above the previous high by at least 10 pips.
- Confirm with moving average – Buy when price stays above the 50 EMA and the HTF candle is bullish. Risk only 1-2% per trade.
- Use pullback entries – Wait for a 20-30 pip pullback before buying in a strong daily uptrend to improve risk-to-reward.
- Trade during active sessions – Focus on London or New York sessions for stronger momentum and better execution.
- Avoid ranging markets – Skip buy trades when HTF candles are small and moving sideways for 3 or more candles.
- Protect your profit – Move the stop-loss to breakeven after gaining 20-25 pips.
Sell Entry
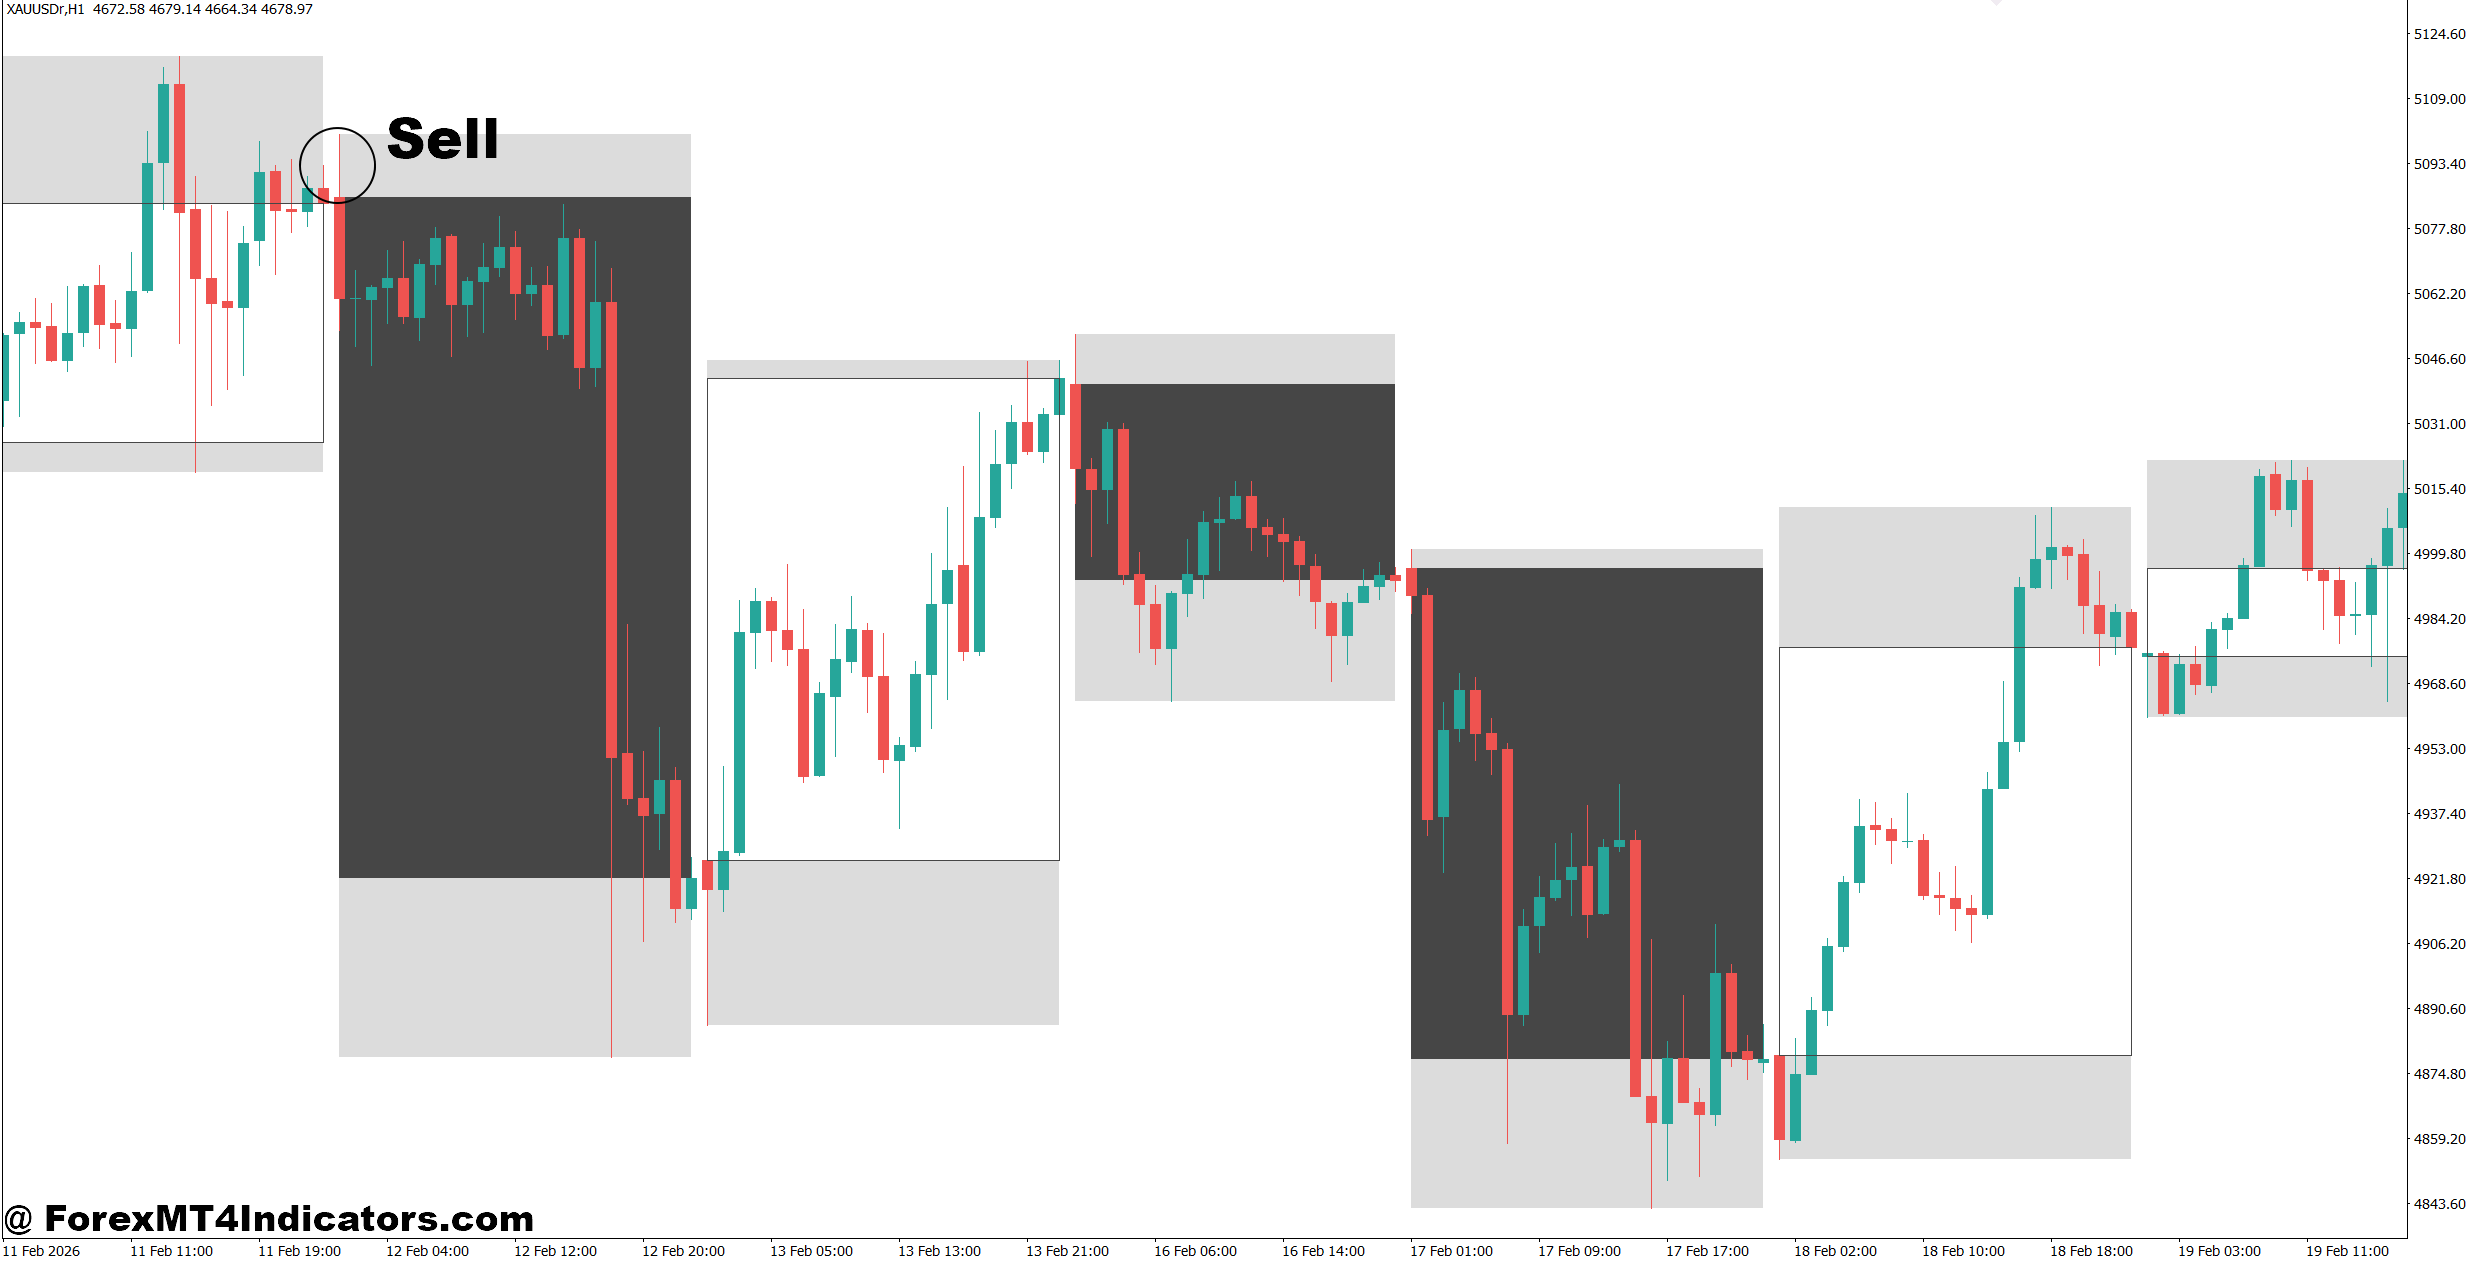
- Trade with bearish HTF candle – Sell when the H4 candle is bearish and the M15 chart prints a bearish engulfing pattern. Aim for 30-60 pips.
- Sell from resistance – Enter on GBP/USD 1-hour after price rejects a strong resistance zone with a bearish HTF candle.
- Wait for candle close – Sell only after the HTF candle closes below the previous low by at least 10 pips.
- Confirm with trend filter – Open sells when price trades below the 50 EMA and risk no more than 2% of account balance.
- Use pullback entries – Wait for a 20-30 pip retracement before selling during a strong daily downtrend.
- Trade high-volume hours – Look for sell setups during the London session when volatility is higher.
- Avoid major news events – Don’t sell 30 minutes before or after high-impact news like NFP or FOMC announcements.
- Lock in gains early – Trail the stop-loss after 25-30 pips of profit to protect against sudden reversals.
Final Thoughts
The HTF Candle Indicator MT4 gives traders a practical way to view higher timeframe price action without leaving their current chart. It helps maintain focus on the broader trend while searching for precise entries on lower timeframes. The biggest takeaways are simple: it improves market context, supports better trend confirmation, works well with price action and support or resistance, and performs best when paired with disciplined risk management. At the same time, traders should remember that no technical tool predicts every market move. Testing the indicator across different currency pairs, market sessions, and timeframes is the best way to understand where it fits within an overall trading plan.
Level up your trading
Learn to read the chart — not just the indicator
eBook · Instant PDF
Video Course · 12 modules
Recommended MT4/MT5 Brokers
- ✓ *FREE *$50 to start (withdrawable)
- ✓ Deposit bonus up to $5,000
- ✓ Negative balance protection
Trading forex and CFDs carries a significant risk of loss and is not suitable for everyone. Broker links are affiliate links — we may earn a commission at no cost to you.
Free MT4 Indicator Download

Enter Your Email Address below, download link will be sent to you.