


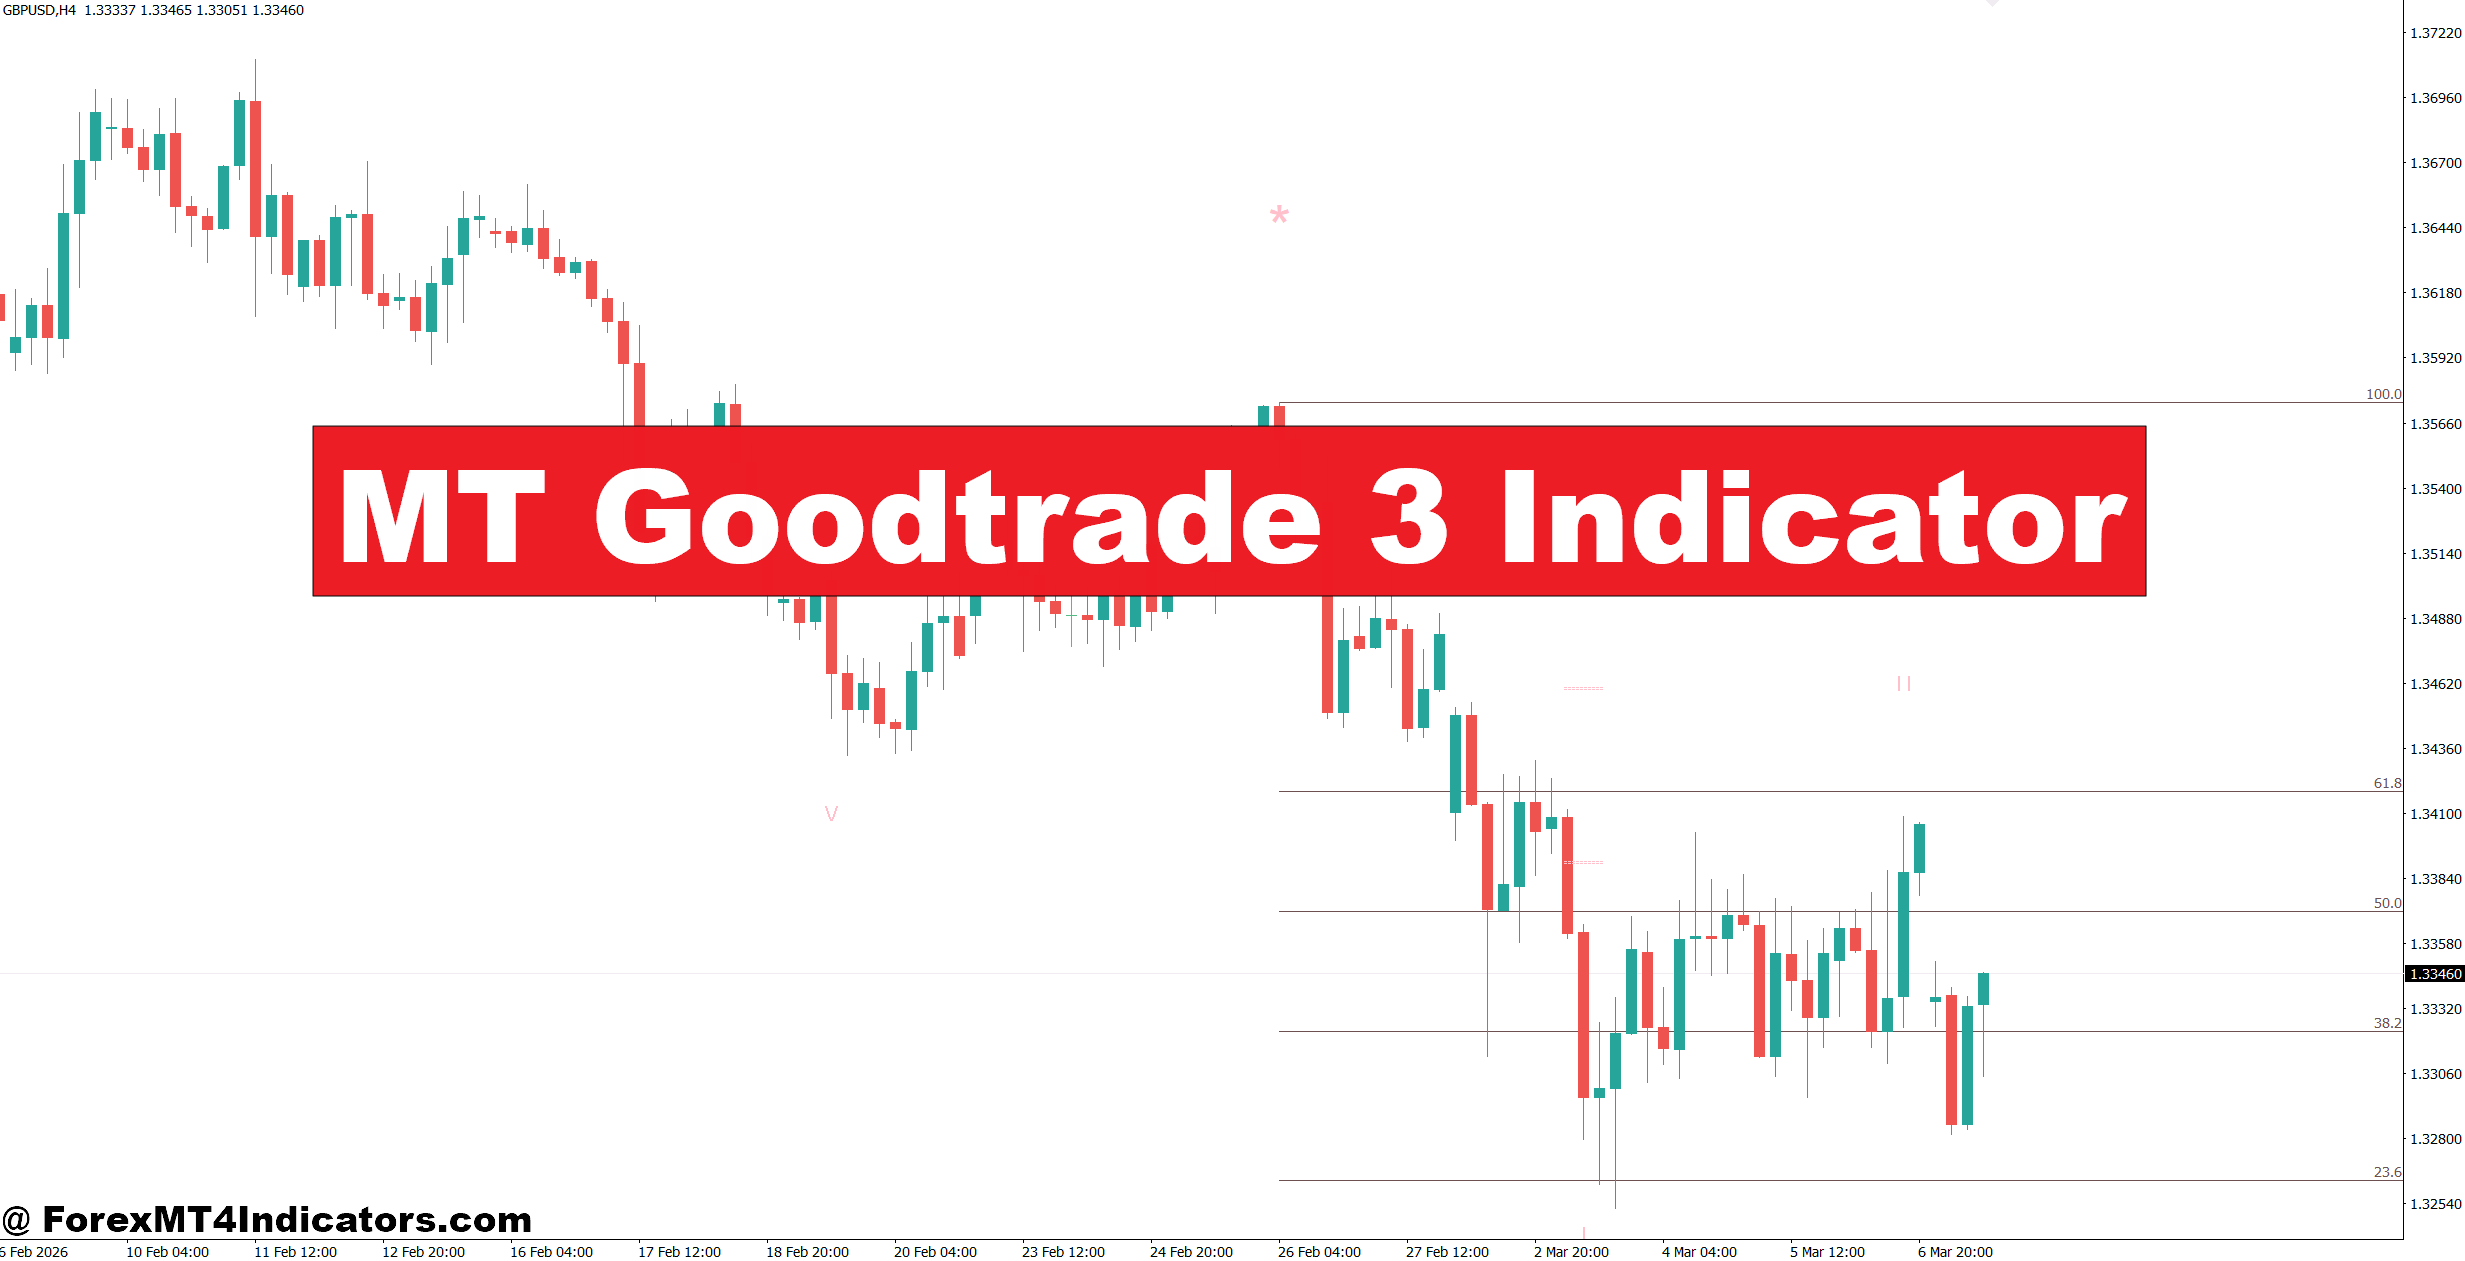
The MT Goodtrade 3 Indicator helps traders deal with this common problem by giving a clearer view of trend direction and possible price channels. Instead of chasing every move, traders can focus on areas where the market has a higher chance of continuing its current path. While no indicator removes risk, this tool can help reduce poor entries when used with solid price action and risk management.
The sections below explain how the indicator works, how traders apply it in real market conditions, and where it performs well along with the situations where extra caution is needed.
What Is the MT Goodtrade 3 Indicator?
The MT Goodtrade 3 Indicator is a trend-following channel indicator developed for the MetaTrader 4 platform. It identifies possible market swings by drawing dynamic trend channels based on recent highs and lows. These channels help traders estimate where price may continue, slow down, or reverse.
Unlike a simple moving average, the indicator focuses on market structure instead of only averaging previous prices. It attempts to identify the dominant trend while filtering out some of the smaller price swings that often confuse traders during sideways markets.
Many traders combine the MT Goodtrade 3 Indicator with support and resistance levels, candlestick patterns, or moving averages for additional confirmation. Rather than acting as a standalone signal generator, it works best as a visual decision-making tool.
How the MT Goodtrade 3 Indicator Works
The indicator analyzes recent price swings and builds trend channels using swing highs and swing lows. As new candles form, the channel adjusts automatically to reflect changing market conditions.
When price stays near the upper boundary during an uptrend, buyers usually remain in control. If price repeatedly respects the lower boundary, the trend often remains healthy. A clear break outside the channel may signal either a stronger breakout or the beginning of a trend reversal depending on market conditions.
For example, EUR/USD on the 1-hour chart may form an upward channel during the London session. After pulling back nearly 25 pips to the lower channel line, a bullish engulfing candle appears. Many traders would wait for that candle to close before entering a buy trade instead of entering during the pullback itself.
During high-impact events like the Non-Farm Payroll report, the indicator may redraw channels quickly because volatility increases. When testing this on volatile NFP days, many experienced traders found it safer to wait 15 to 30 minutes after the news before trusting newly formed channels. That approach helped avoid several fake-out moves caused by sudden liquidity spikes.
Trading forex carries substantial risk. No indicator guarantees profits.
Using the MT Goodtrade 3 Indicator in Real Trading
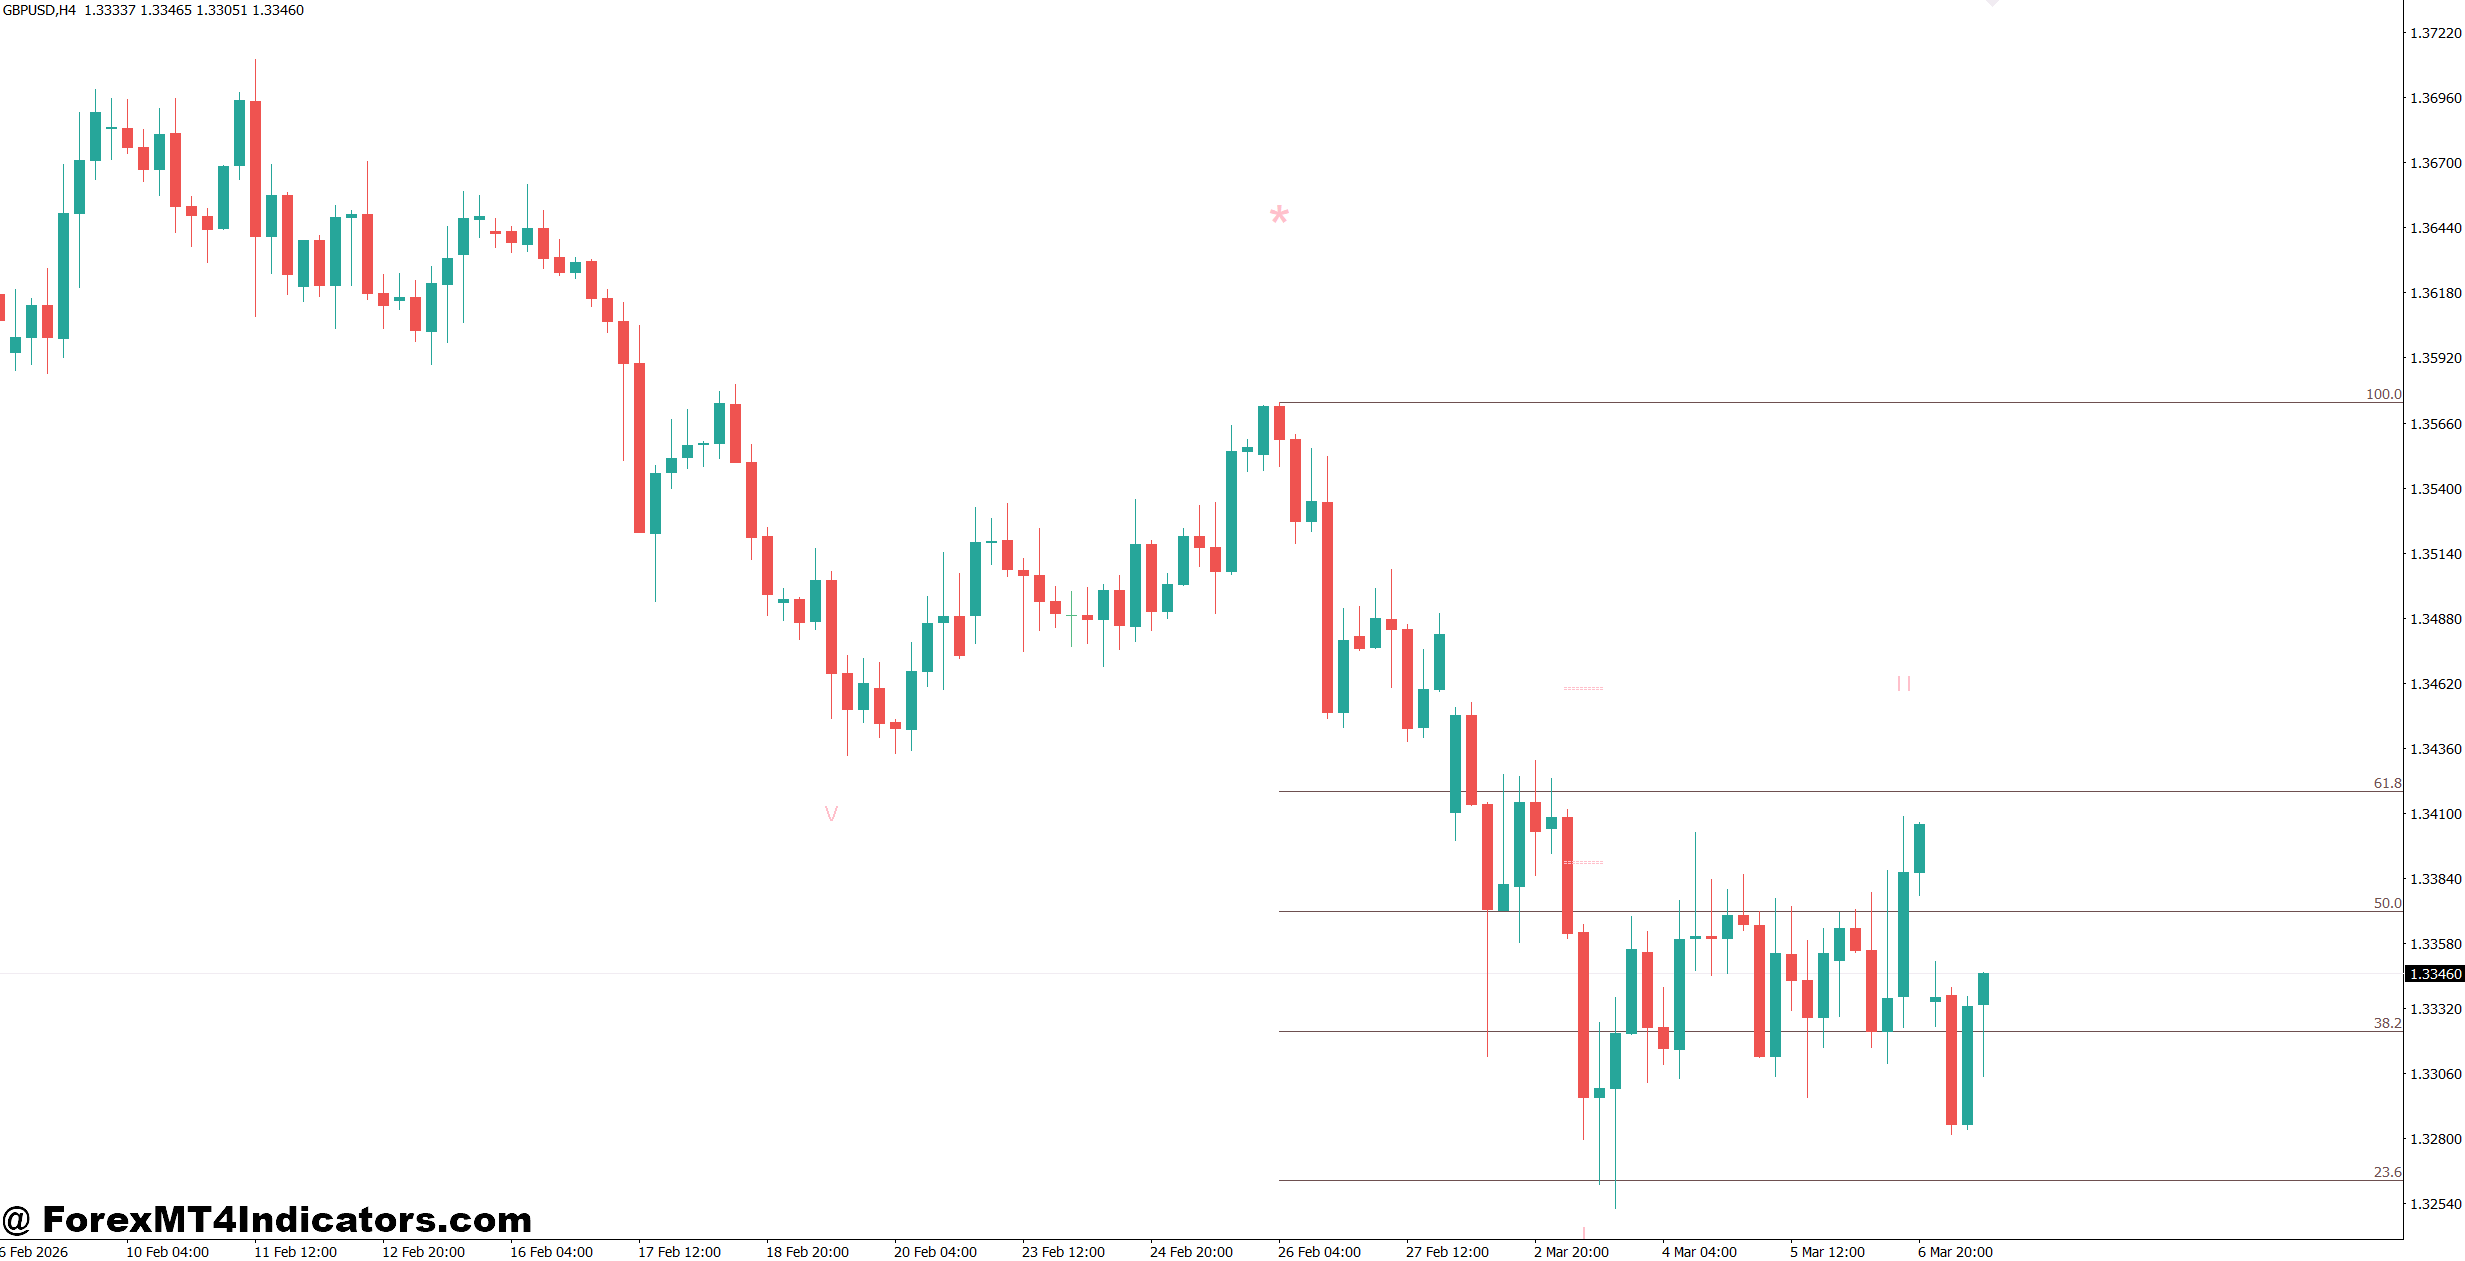
Trend Continuation Entries
The indicator performs well when markets already have a clear trend.
Suppose GBP/USD is trading above the 200-period moving average on the 4-hour chart. Price pulls back roughly 40 pips toward the lower channel before printing a bullish pin bar. That combination gives traders multiple reasons to consider a long position instead of relying only on the indicator.
Many traders place stop-loss orders 20 to 35 pips below the recent swing low while targeting a reward at least twice the initial risk.
Breakout Opportunities
Sometimes price breaks above or below the channel with strong momentum.
For instance, USD/JPY may spend several hours moving inside a narrow channel before breaking higher during the Tokyo-London overlap. If trading volume increases and the breakout candle closes well outside the channel, traders often look for a retest before entering instead of buying immediately.
Waiting for confirmation often reduces the chance of entering a false breakout.
Sideways Markets
Here’s the thing. No trend indicator enjoys ranging markets.
When EUR/CHF trades inside a narrow 30-pip range for several hours, the MT Goodtrade 3 Indicator may produce frequent channel adjustments that create confusing signals. During these conditions, many traders reduce position size or simply stay out until a stronger trend develops.
Best Settings and Customization
There isn’t a single setting that fits every market. Small adjustments based on trading style often improve consistency.
Scalpers trading the 5-minute or 15-minute charts generally prefer faster channel sensitivity to capture shorter price swings. More signals appear, but false signals also increase.
Swing traders using the 4-hour or daily charts often choose smoother settings that ignore minor market noise. Fewer signals appear, yet they usually align better with the larger market trend.
Currency pairs also matter.
- EUR/USD and GBP/USD often respond well to medium sensitivity settings because of their steady liquidity.
- XAU/USD (Gold) usually requires wider stop-loss placement due to higher volatility.
- GBP/JPY may need less aggressive channel settings since its price swings can exceed 100 pips during active sessions.
Many experienced traders avoid changing settings every week. They test one configuration over at least 50 to 100 trades before deciding whether adjustments are necessary.
Advantages, Limitations, and Comparison with Similar Indicators
One advantage of the MT Goodtrade 3 Indicator is its ability to display market structure visually. Traders can quickly recognize trend direction without drawing manual channels on every chart.
It also adapts automatically as new price data becomes available, saving time during market analysis.
But the indicator has limitations.
Like most trend-following tools, it reacts after price has already moved. Sharp reversals can produce delayed signals, especially during major economic announcements or unexpected geopolitical news.
It also performs less effectively during low-volatility sessions where price lacks clear direction.
Compared with Bollinger Bands, the MT Goodtrade 3 Indicator focuses more on directional movement than price volatility. Bollinger Bands expand and contract based on standard deviation, while Goodtrade channels emphasize trend structure.
Compared with moving averages, the indicator provides clearer visual support and resistance zones rather than only showing average price direction.
Some traders also compare it with Donchian Channels. Donchian Channels simply track the highest highs and lowest lows over a selected period, while the MT Goodtrade 3 Indicator attempts to follow evolving swing structure, giving charts a more flexible appearance.
Many traders find the strongest results come from combining this indicator with price action confirmation, higher-timeframe analysis, and disciplined money management instead of treating it as an automatic trading system.
How to Trade with MT Goodtrade 3 Indicator
Buy Entry
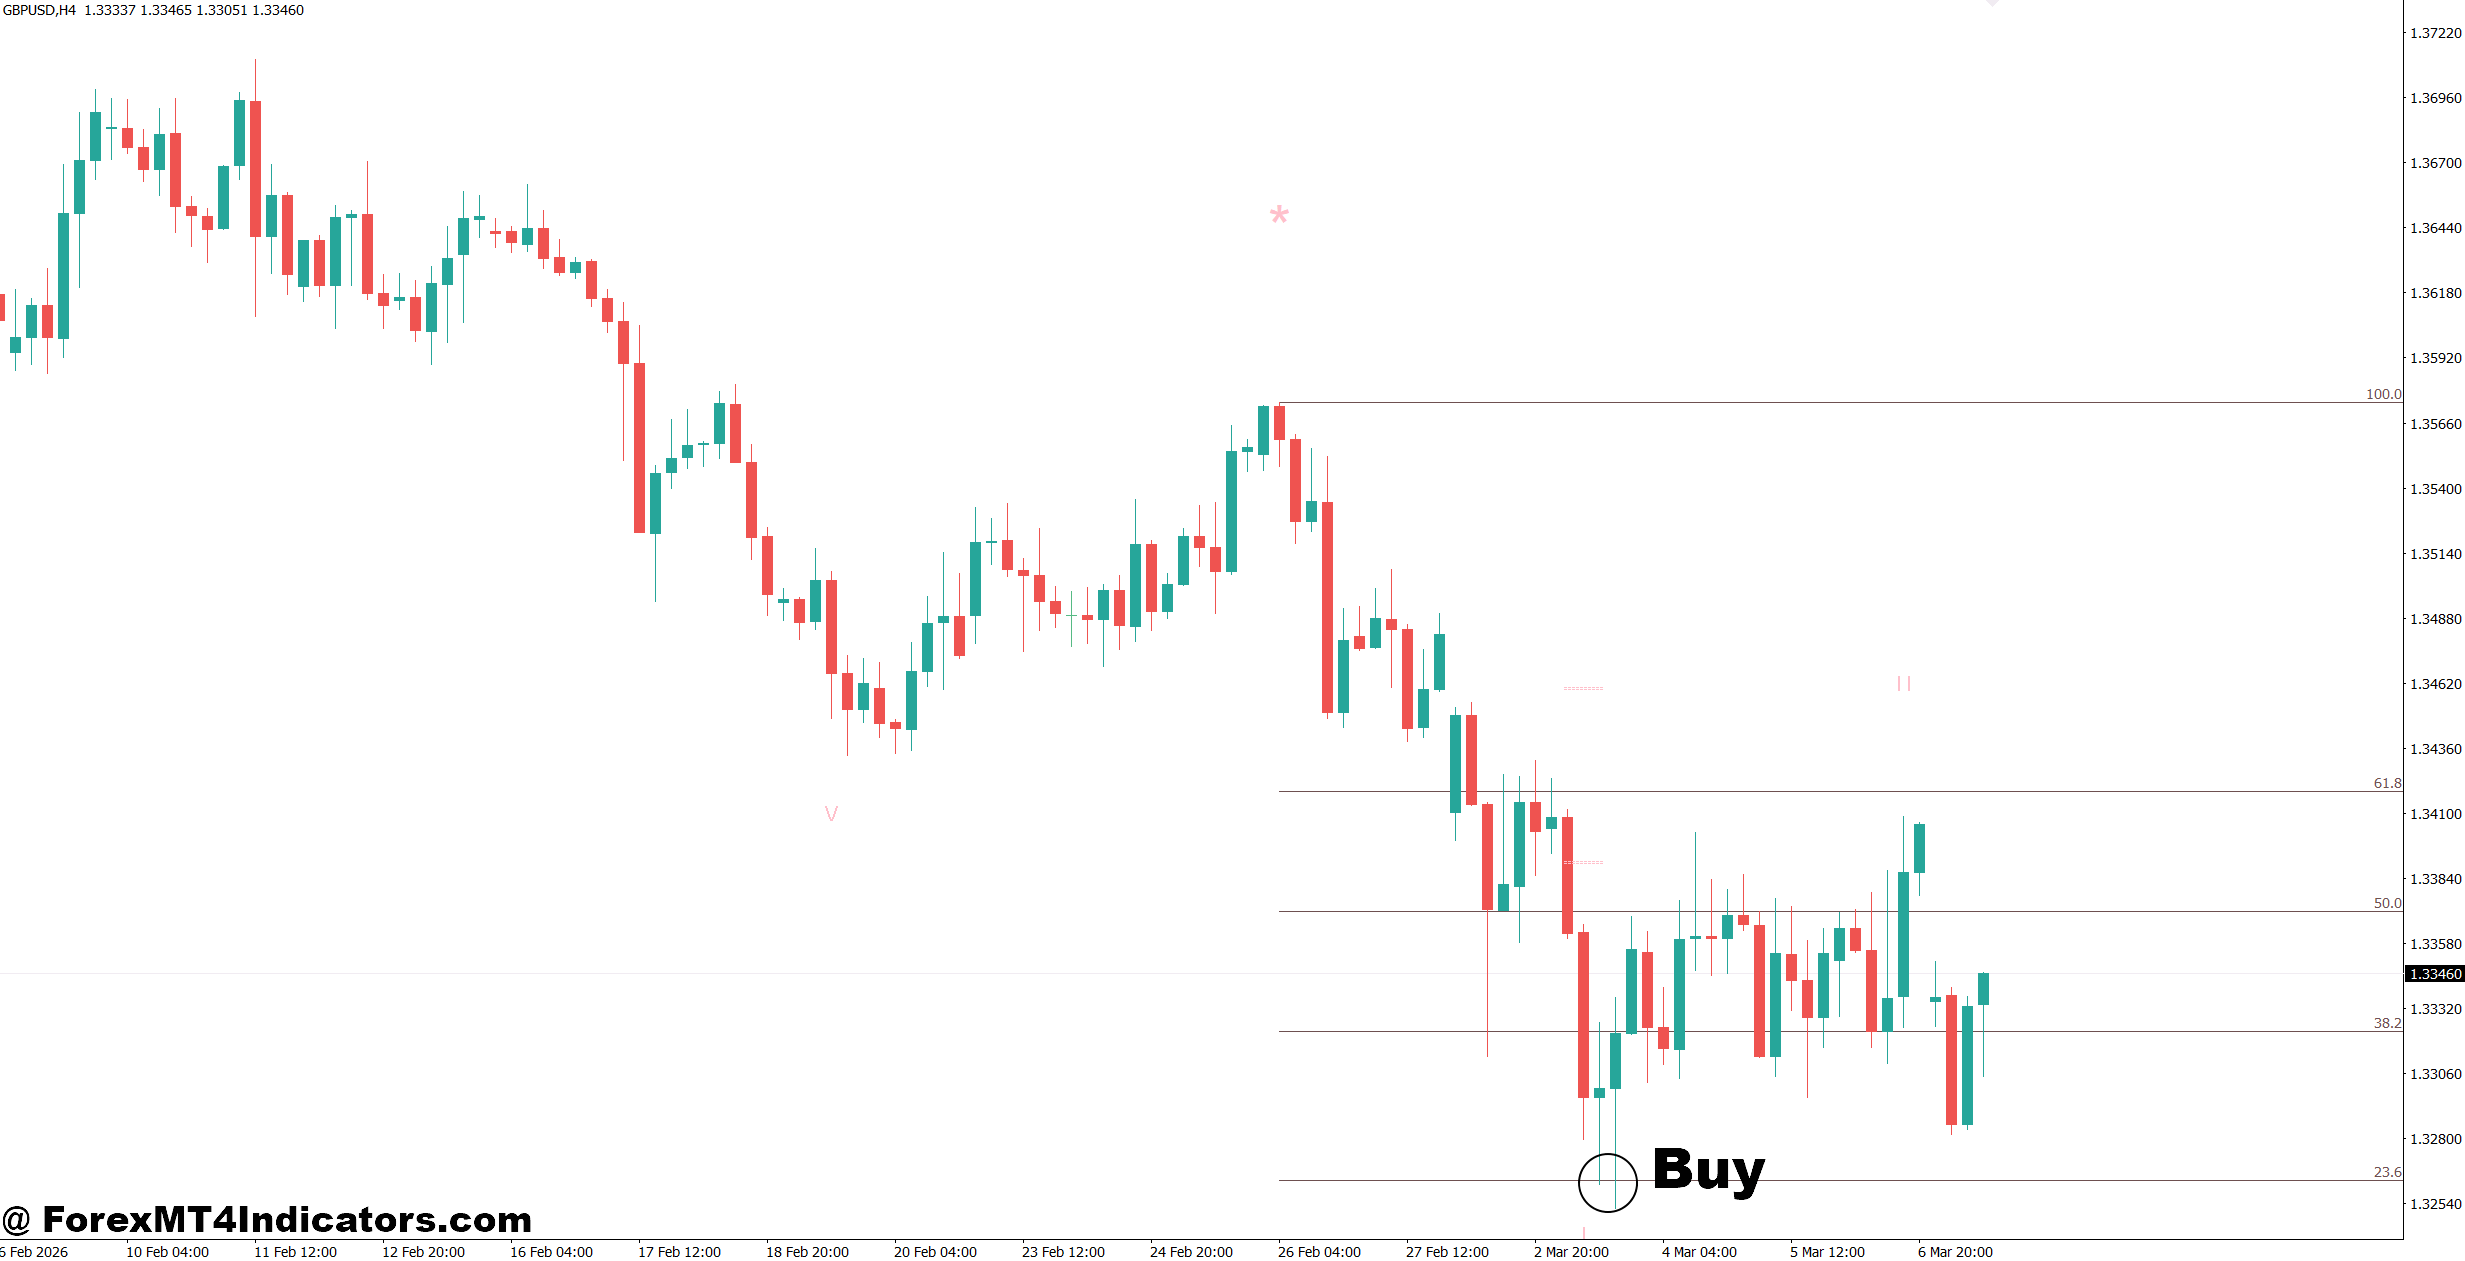
- Buy at lower channel support – Enter when EUR/USD respects the lower channel on the 1-hour chart with a bullish candle. Place a 20-30 pip stop-loss.
- Trade confirmed breakouts – Buy after price closes 15-20 pips above the upper channel and retests it successfully.
- Follow the higher timeframe trend – Take buys only when the 4-hour channel is sloping upward for better trend alignment.
- Confirm with bullish candles – Enter after a bullish engulfing or pin bar forms near channel support with at least 1:2 risk-reward.
- Use moving average confirmation – Buy only if price stays above the 50 EMA and the indicator remains bullish.
- Risk only 1-2% per trade – Keep position size small even when the setup looks strong.
- Avoid low-volatility sessions – Skip buy signals when the market moves less than 25 pips during the Asian session.
- Stay out before major news – Don’t enter within 30 minutes of NFP, CPI, or FOMC announcements.
Sell Entry
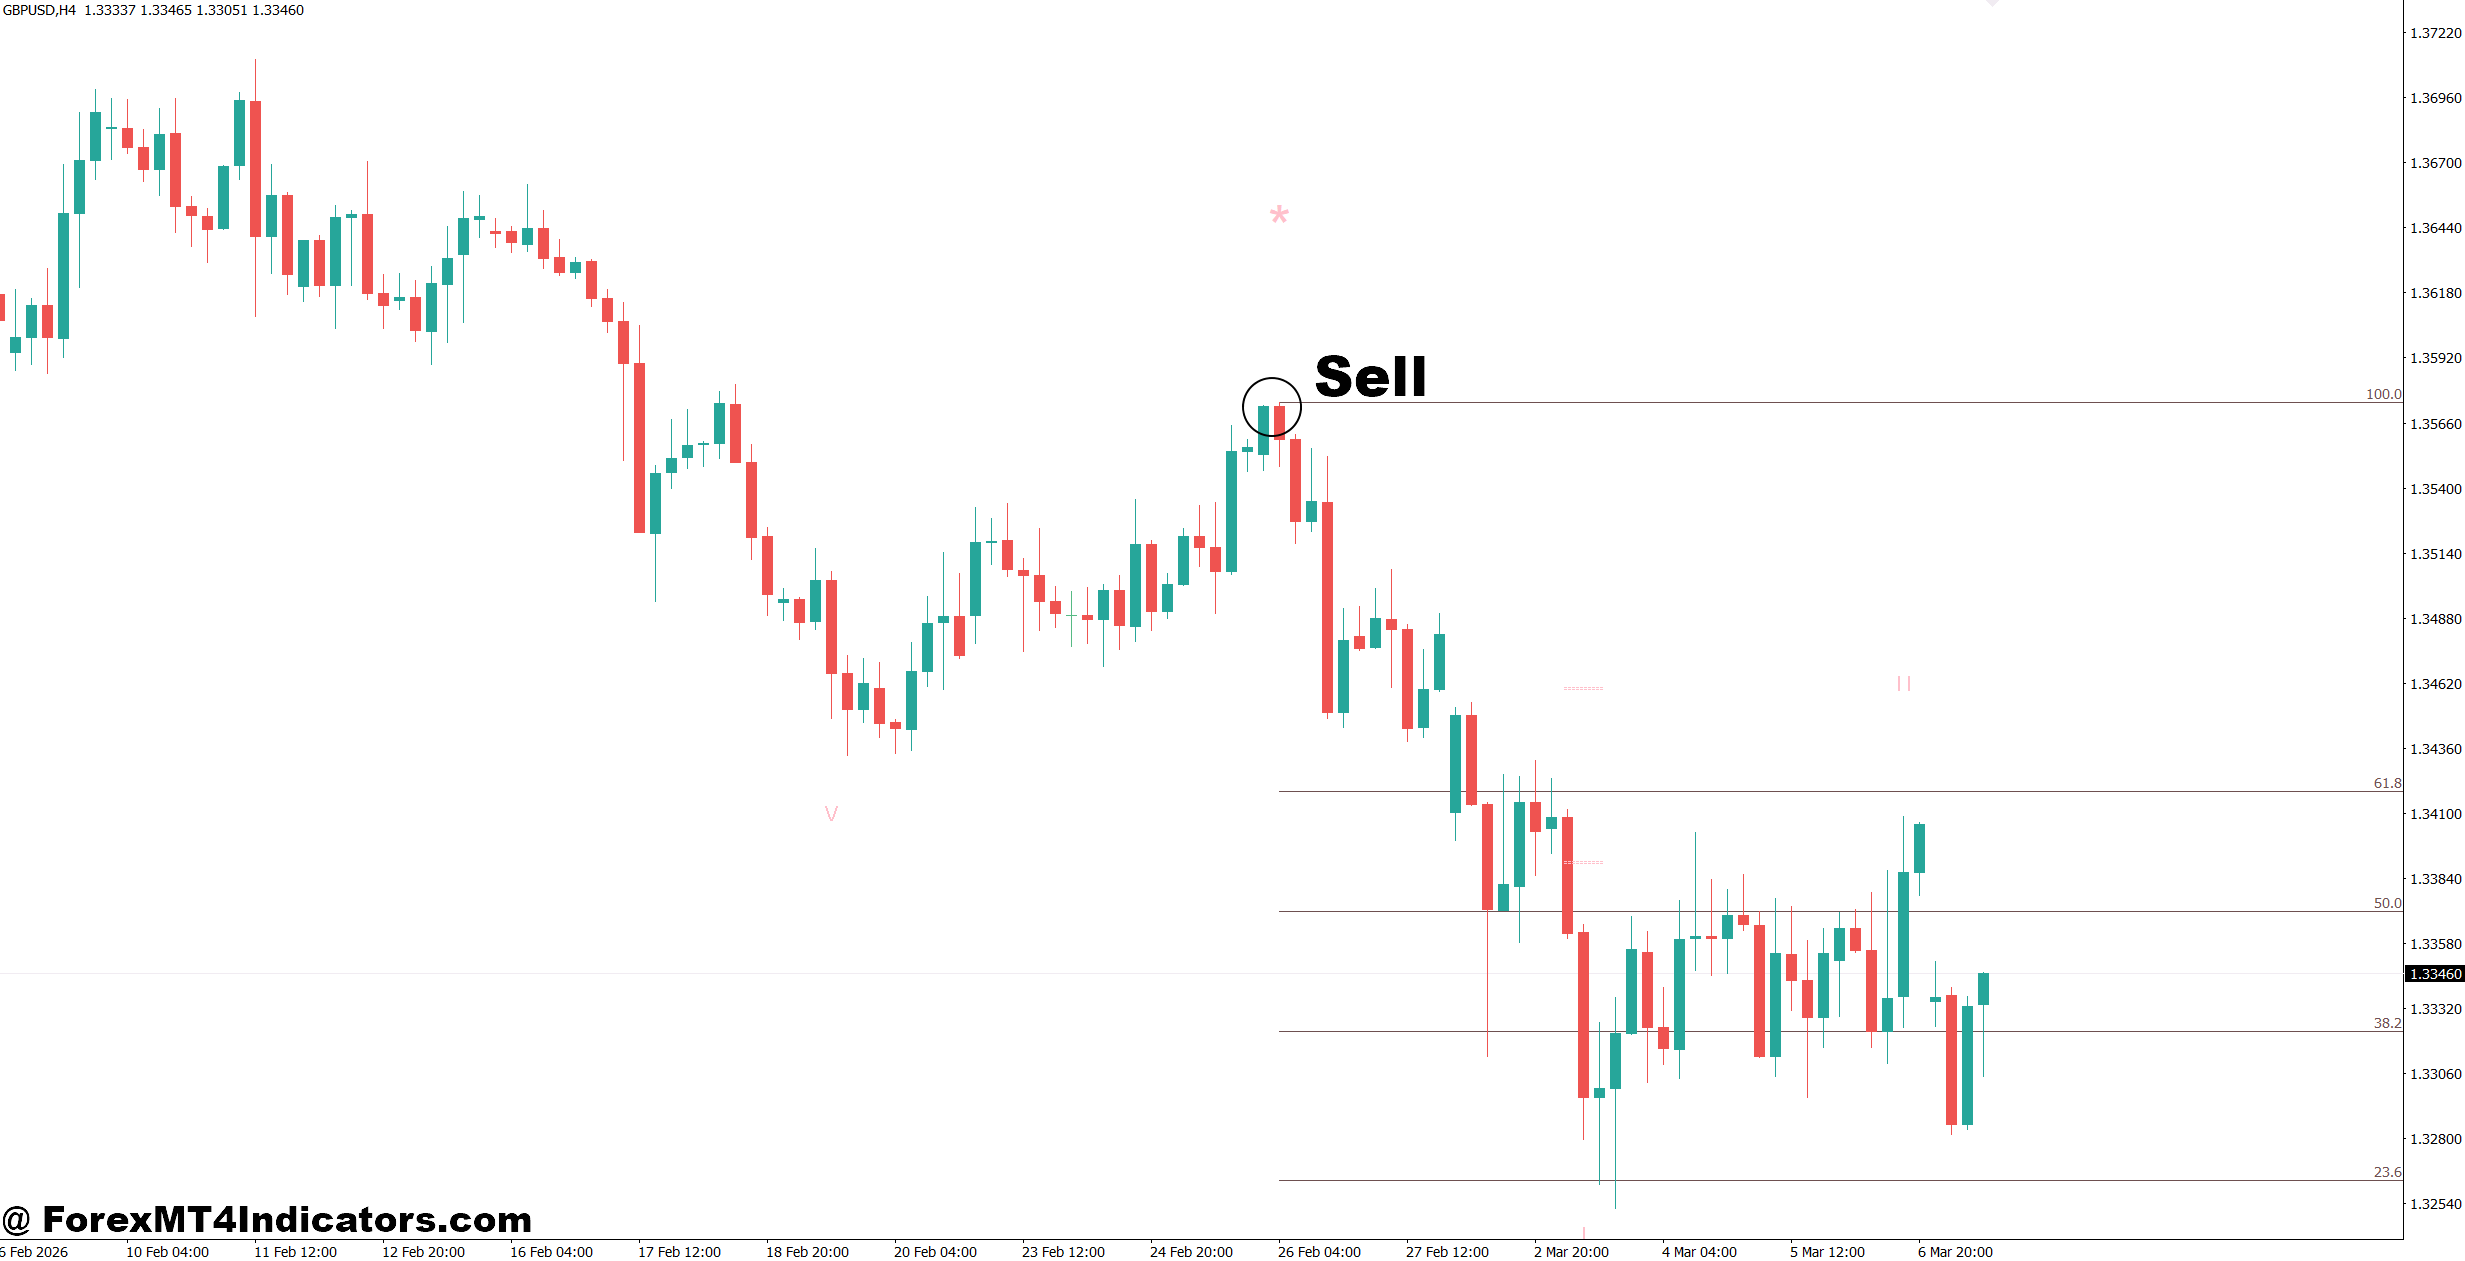
- Sell at upper channel resistance – Enter when GBP/USD rejects the upper channel on the 1-hour chart. Use a 20-30 pip stop-loss.
- Trade bearish channel breaks – Sell after price closes 15-20 pips below the lower channel with strong momentum.
- Follow the downtrend – Take sell trades only when the 4-hour channel is clearly sloping downward.
- Confirm with bearish candles – Enter after a bearish engulfing or shooting star forms near channel resistance.
- Use EMA confirmation – Sell only when price trades below the 50 EMA and the indicator stays bearish.
- Protect capital – Risk no more than 1-2% of the account on each sell trade.
- Avoid ranging markets – Skip sell signals if the pair stays inside a 30-pip sideways range.
- Don’t trade during major news – Ignore sell setups within 30 minutes before or after high-impact economic releases.
The MT Goodtrade 3 Indicator gives traders another way to read market structure instead of relying on price alone. Its biggest strengths include identifying trend channels, improving trade timing, supporting trend confirmation, and helping traders visualize potential support and resistance areas. At the same time, it has weaknesses during choppy markets and periods of extreme volatility, so careful risk management remains essential. Used alongside sound technical analysis, realistic stop-loss placement, and proper position sizing, the MT Goodtrade 3 Indicator can become a valuable part of a trading plan rather than the only reason to enter or exit a position.
Level up your trading
Learn to read the chart — not just the indicator
eBook · Instant PDF
Video Course · 12 modules
Recommended MT4/MT5 Brokers
- ✓ *FREE *$50 to start (withdrawable)
- ✓ Deposit bonus up to $5,000
- ✓ Negative balance protection
Trading forex and CFDs carries a significant risk of loss and is not suitable for everyone. Broker links are affiliate links — we may earn a commission at no cost to you.
Free MT4 Indicator Download

Enter Your Email Address below, download link will be sent to you.
