


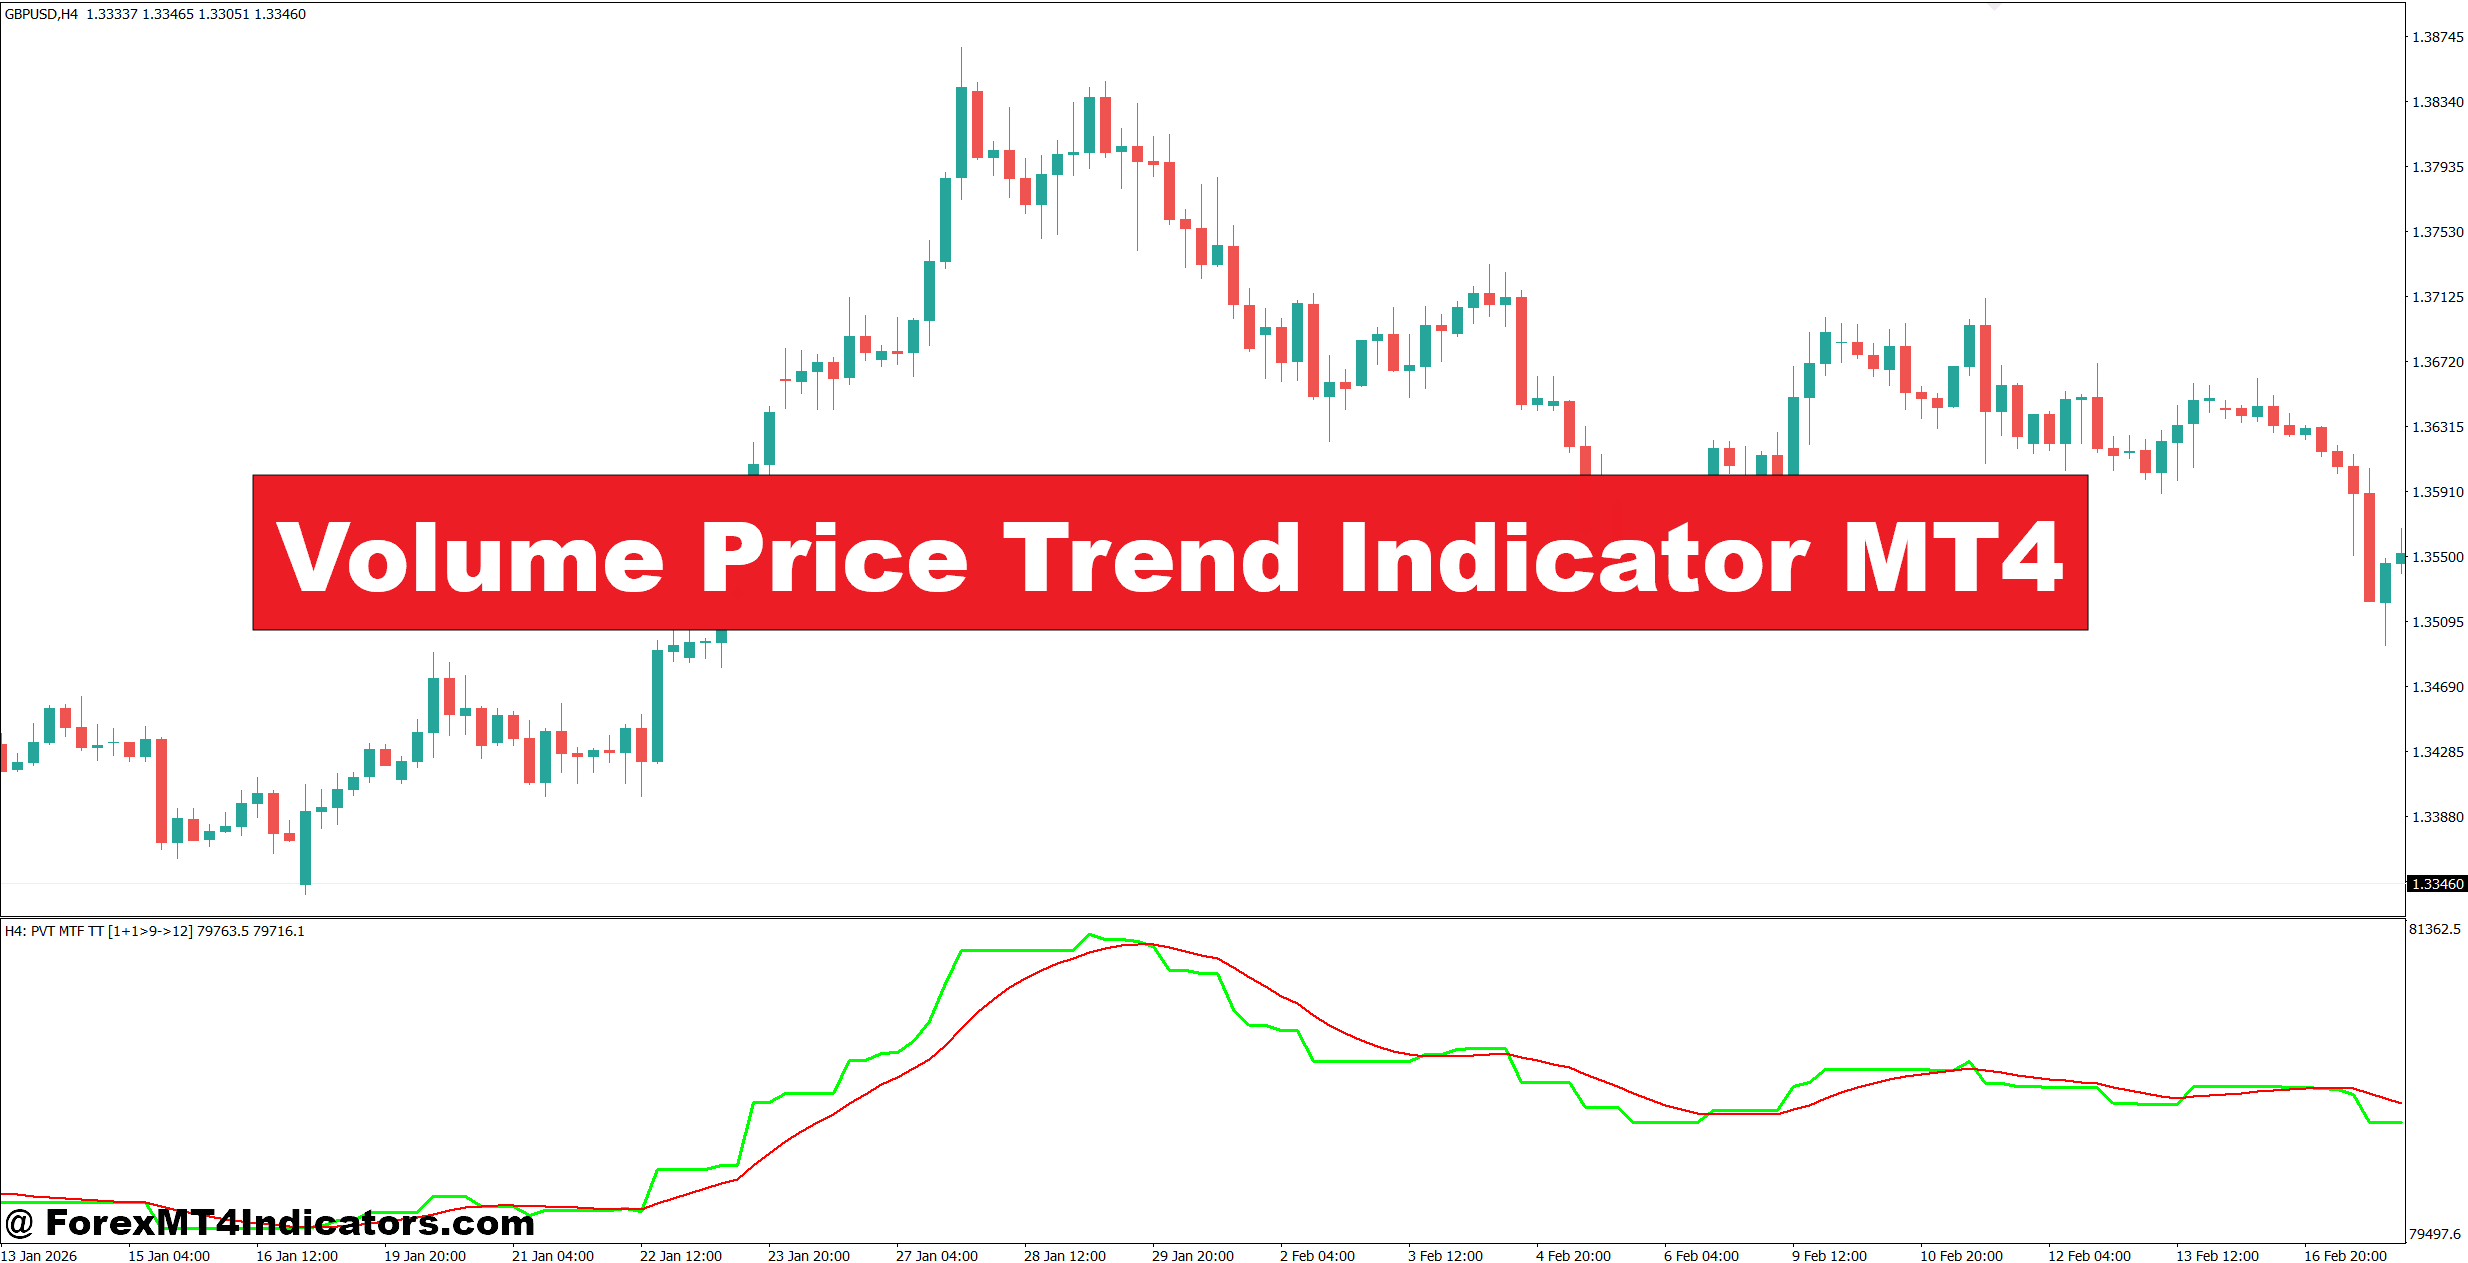
The Volume Price Trend Indicator MT4 gives traders another way to study that situation by combining price changes with volume data. Instead of looking at price alone, it helps show whether volume is generally supporting the current price direction. This can be useful when confirming breakouts, spotting weakening trends, or filtering questionable entries.
The indicator isn’t a buy-or-sell machine, though. Forex volume is usually tick volume, so the readings don’t represent centralized market-wide transaction volume. That distinction matters. In practice, traders get better results when they use the indicator alongside market structure, support and resistance, and price action. The following sections explain how it works and where it fits into a practical MT4 trading plan.
What Is the Volume Price Trend Indicator MT4?
The Volume Price Trend (VPT) indicator is a cumulative technical indicator designed to connect price movement with volume. Its basic idea is simple: a larger price move accompanied by higher volume should have a greater effect on the indicator than a small move on low volume.
A common VPT calculation can be expressed as:
VPT = Previous VPT + Volume × (Current Close − Previous Close) / Previous Close
For example, assume EUR/USD closes at 1.0850 and then rises to 1.0865. If the platform records 10,000 ticks during that candle, the positive price change contributes to the VPT value. If the next candle falls from 1.0865 to 1.0855 while activity remains high, the VPT calculation produces a negative contribution.
This cumulative behavior makes the indicator useful for studying confirmation and divergence. When price rises and VPT also trends higher, the move has volume support according to the data available on the MT4 broker feed. When price keeps climbing but VPT starts flattening or falling, traders may want to question the strength of that advance.
Here’s the key detail: MT4 forex volume normally refers to tick volume, which measures how often the price changes rather than the exact number of contracts traded across the entire forex market. The indicator can still provide useful information, but its readings should not be treated as centralized exchange volume.
How Traders Read VPT Signals on MT4
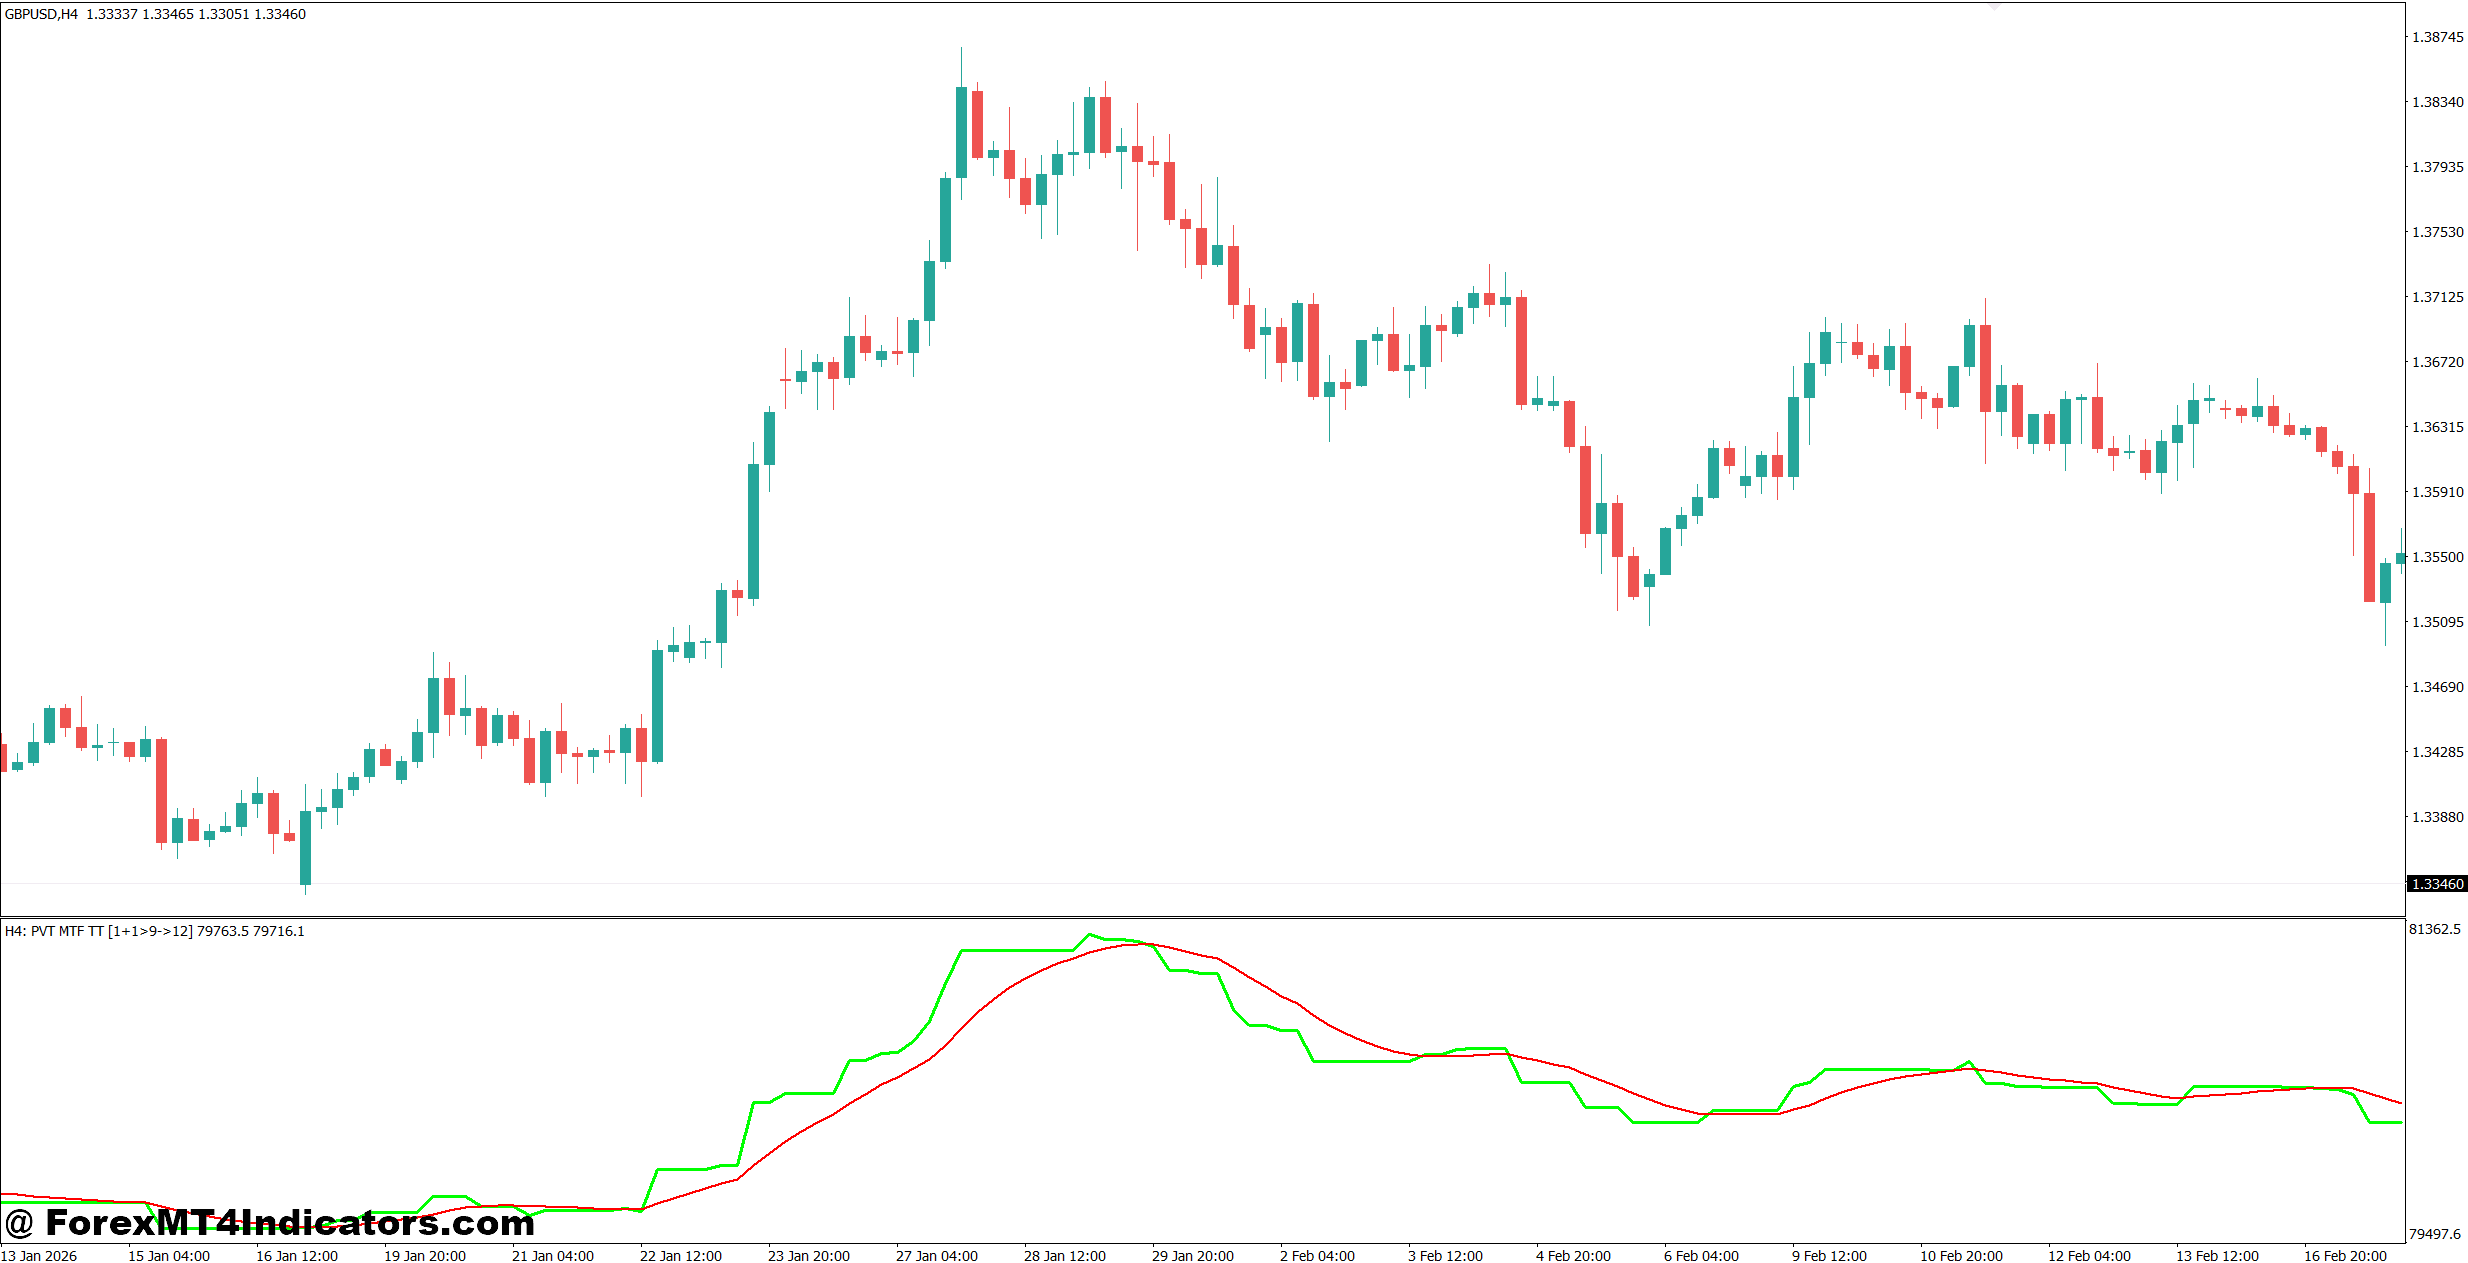
The most practical use of VPT is confirmation rather than blind signal generation. Price structure tells traders where the market is moving, while VPT can help judge whether volume activity is supporting that move.
Trend confirmation
Suppose GBP/USD breaks above resistance at 1.2750 on the 1-hour chart. The breakout candle closes at 1.2770, while VPT also pushes above its previous swing high. That combination gives the breakout more credibility than price breaking resistance while VPT remains flat.
A trader might wait for a pullback toward 1.2750 instead of buying the initial spike. If the level holds and another bullish candle appears, an entry around 1.2760 could be considered. With a stop around 1.2735, the initial risk would be roughly 25 pips.
The exact numbers should change with market volatility. A 25-pip stop may make sense for one GBP/USD setup but be too tight during a major news event.
Divergence between price and VPT
Divergence deserves more attention. Imagine EUR/USD rises from 1.0900 to 1.0980 over several H1 sessions, but VPT makes a lower high. Price is still bullish, yet the volume-price relationship isn’t confirming the latest advance.
That doesn’t mean an immediate short entry. Markets can remain overextended for longer than expected. Instead, traders can wait for a structural warning, such as a break below a recent higher low.
The same concept works in reverse. If USD/JPY falls from 158.20 to 156.90 while VPT forms a higher low, selling pressure may be losing strength. A trader could then watch the next support zone for a bullish reversal setup rather than selling into an already extended decline.
Breakout filtering
VPT can also help separate stronger breakouts from weak ones.
Consider USD/CAD on the 4-hour chart. Price has tested 1.3800 three times before finally closing above it at 1.3830. If VPT also breaks above its previous high, the breakout has supporting evidence. If VPT barely moves despite the price breakout, a trader may wait for a retest instead of chasing the candle.
This approach can reduce exposure to the classic breakout fake-out, but it won’t eliminate false signals.
Settings, Timeframes, and Practical MT4 Use
There isn’t one universal VPT setting that fits every pair. Since the calculation is cumulative, the displayed value depends heavily on the historical data loaded into MT4. Traders should focus more on the direction, slope, swing points, and relationship with price than on the absolute VPT number.
For M15 and M30 charts, shorter-term traders can use VPT alongside local support and resistance. A 10- to 20-candle lookback for visual comparison can help identify recent momentum changes, although the exact setting depends on the indicator version.
On H1, VPT becomes more useful for regular swing and intraday setups. For example, a trader might use the 20-period moving average to establish the broad direction, then wait for VPT to confirm a pullback breakout.
On H4, the indicator can help with larger trend moves. A trader holding EUR/USD for several days may care more about whether VPT continues making higher lows than about every small intraday fluctuation.
When testing the indicator on volatile NFP days, traders should be careful. A single news candle can produce a huge tick-volume reading and distort short-term interpretation. It can be better to wait for the first reaction to settle and then evaluate the next one or two candles.
A useful workflow is:
- Identify the trend and major market structure.
- Mark support and resistance before checking VPT.
- Look for VPT confirmation at important price levels.
- Wait for a candle close rather than reacting to an unfinished candle.
- Place the stop beyond a logical structure level.
- Risk a small, predefined portion of the account on each trade.
For example, risking 0.5% to 1% per setup can keep a series of losing trades from causing severe account damage. Position size should be calculated from the stop distance, not chosen first and justified afterward.
VPT vs OBV, Money Flow, and Other Volume Indicators
VPT is often compared with On-Balance Volume (OBV), but the two don’t treat price movement in exactly the same way.
OBV generally adds the full volume figure when price closes higher and subtracts it when price closes lower. VPT incorporates the percentage price change, so a larger price movement has a larger influence on the cumulative value.
That difference can matter during strong moves. A 1% price rise and a 0.1% price rise won’t have the same impact on VPT when volume is identical.
Money Flow Index (MFI) takes a different approach by combining price and volume into an oscillator. It can help identify overbought and oversold conditions, while VPT is more commonly viewed as a cumulative confirmation tool.
The Volume Price Trend Indicator MT4 therefore fits best when a trader wants to compare price direction with volume activity rather than simply identify overbought readings.
But there is a limitation traders shouldn’t ignore. Since MT4 forex volume comes from the broker’s tick data, two brokers can produce somewhat different readings. This is one reason VPT should not be treated as an independent reason to enter a trade.
A practical combination is VPT + market structure + support/resistance. For example, if gold breaks a well-tested H1 resistance level, VPT confirms the move, and the breakout candle closes strongly above the level, the setup has several pieces of evidence working together. If price breaks resistance but VPT falls and the candle leaves a long upper wick, caution makes more sense.
How to Trade with Volume Price Trend Indicator MT4
Buy Entry
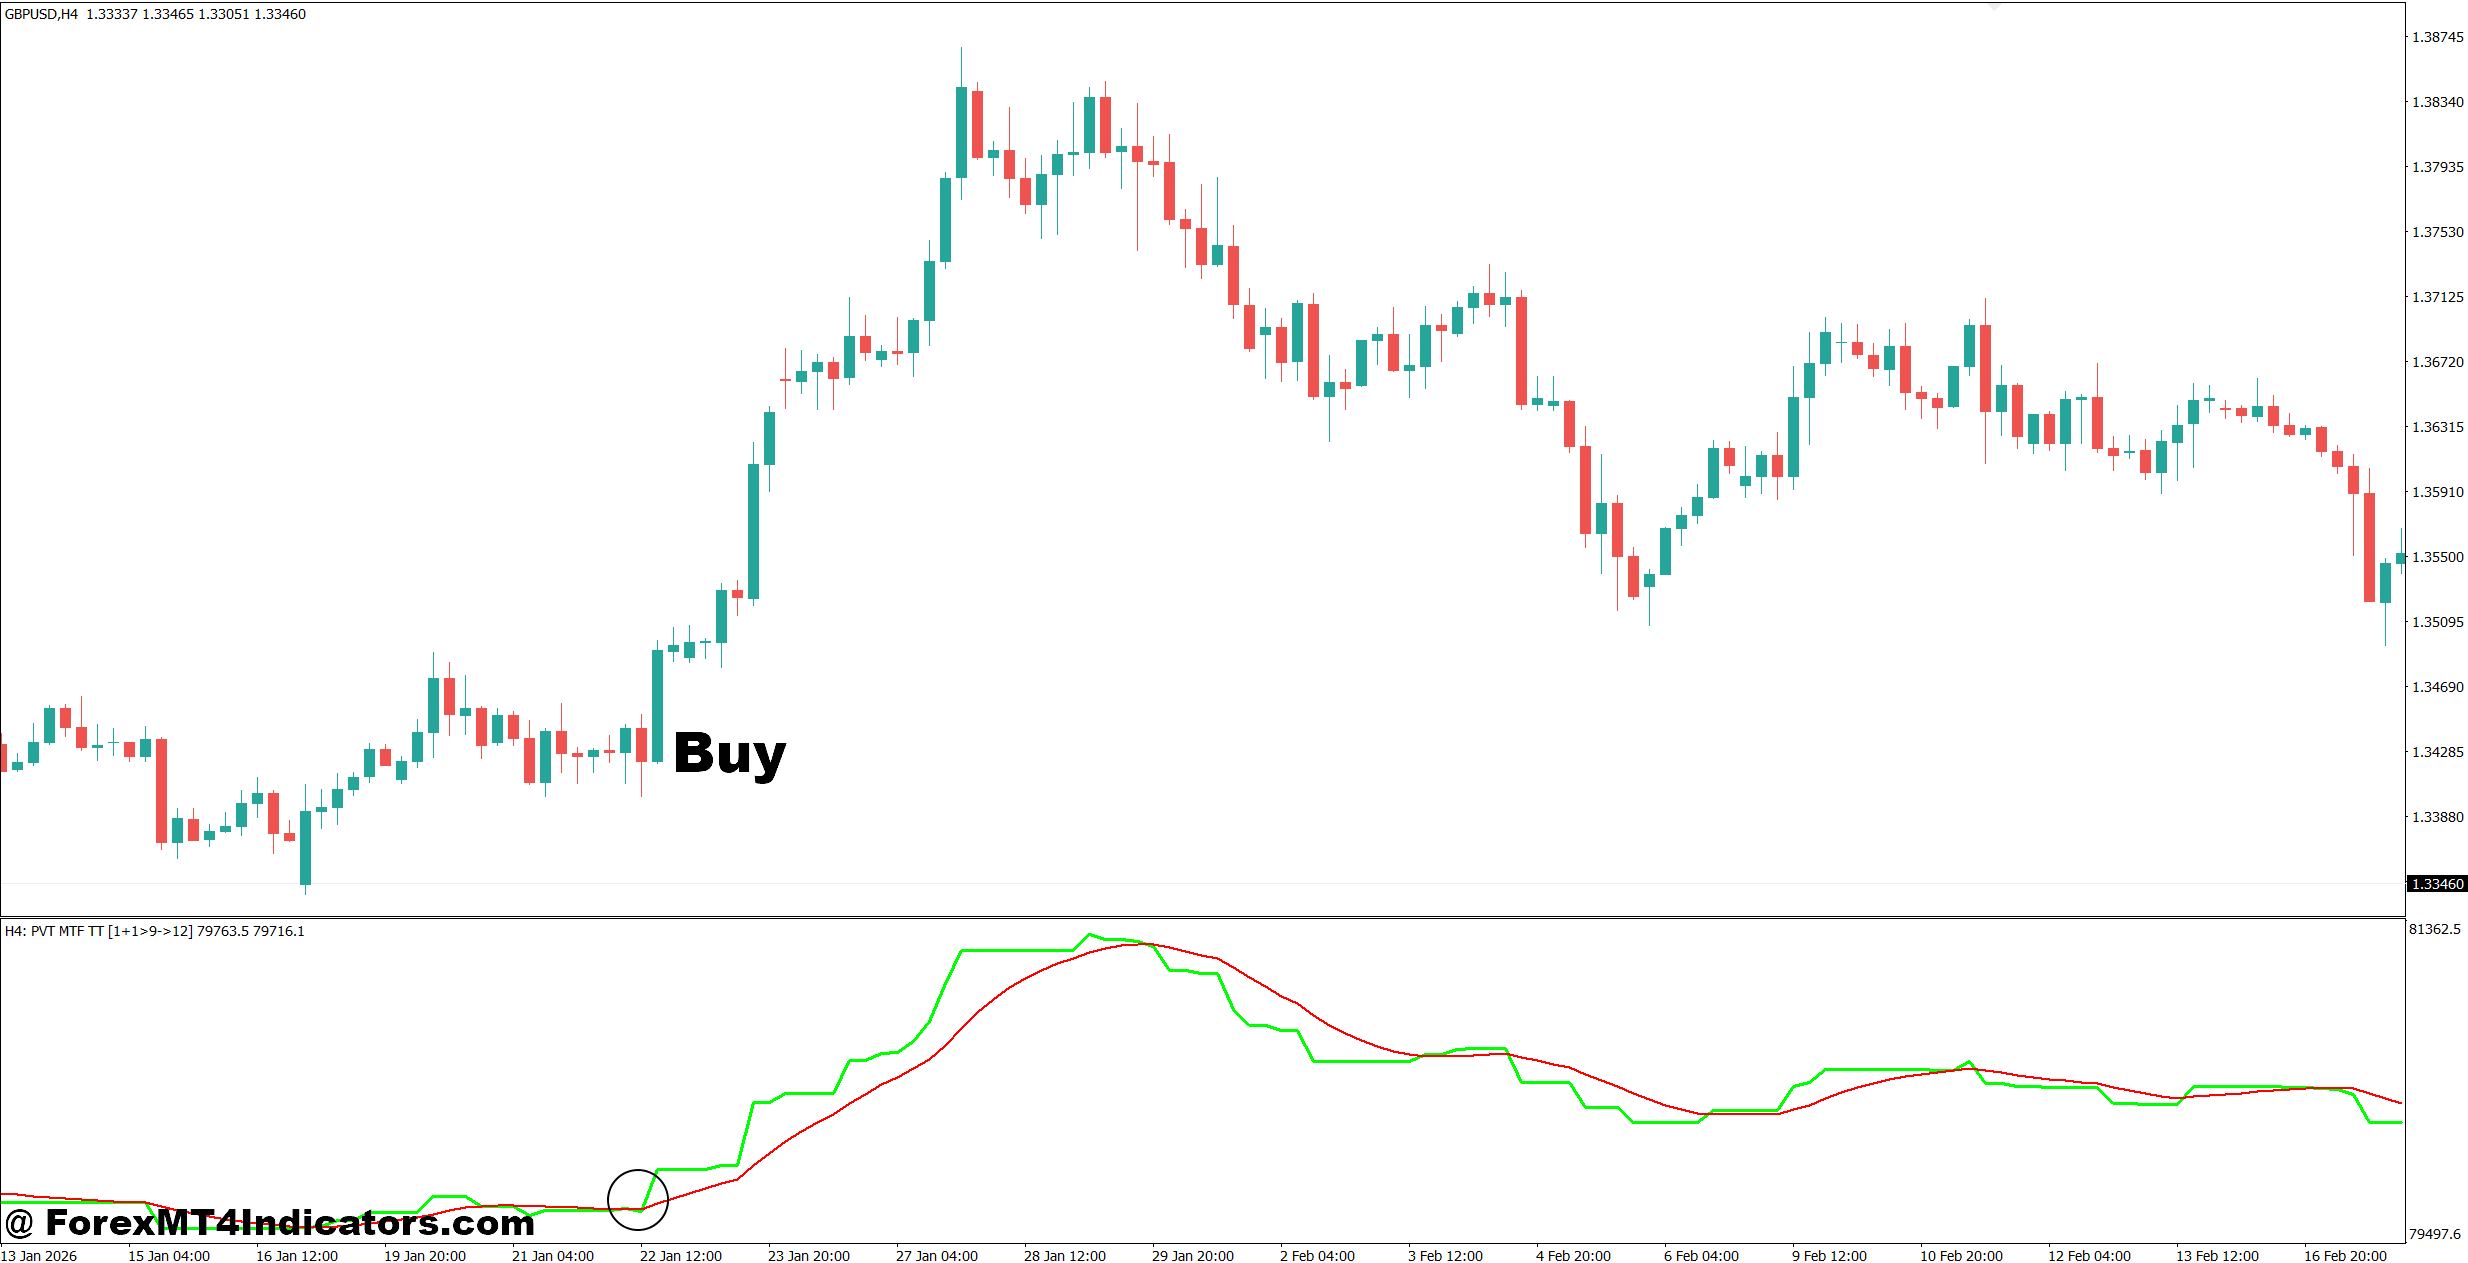
- Wait for VPT to turn bullish – Buy when VPT rises with price on the 1-hour chart, confirming stronger buying activity.
- Confirm a resistance breakout – Consider EUR/USD after a clean break above resistance by 10–15 pips, especially when VPT makes a new short-term high.
- Trade the retest – After GBP/USD breaks resistance, wait for a 5–15 pip pullback and bullish candle before entering.
- Check higher-timeframe direction – Prefer H1 buy setups when the 4-hour VPT and price both show higher highs and higher lows.
- Use divergence carefully – If EUR/USD makes a higher low while VPT also forms a higher low, the bullish structure gains confirmation.
- Set controlled risk – Place the stop 15–30 pips below the recent swing low and risk no more than 1% of account equity.
- Target a realistic move – Aim for at least 30–60 pips on H1 setups or use a minimum 1:2 risk-to-reward ratio.
- Avoid weak confirmations – Don’t buy when price breaks resistance but VPT remains flat or falls, particularly during major news spikes.
Sell Entry
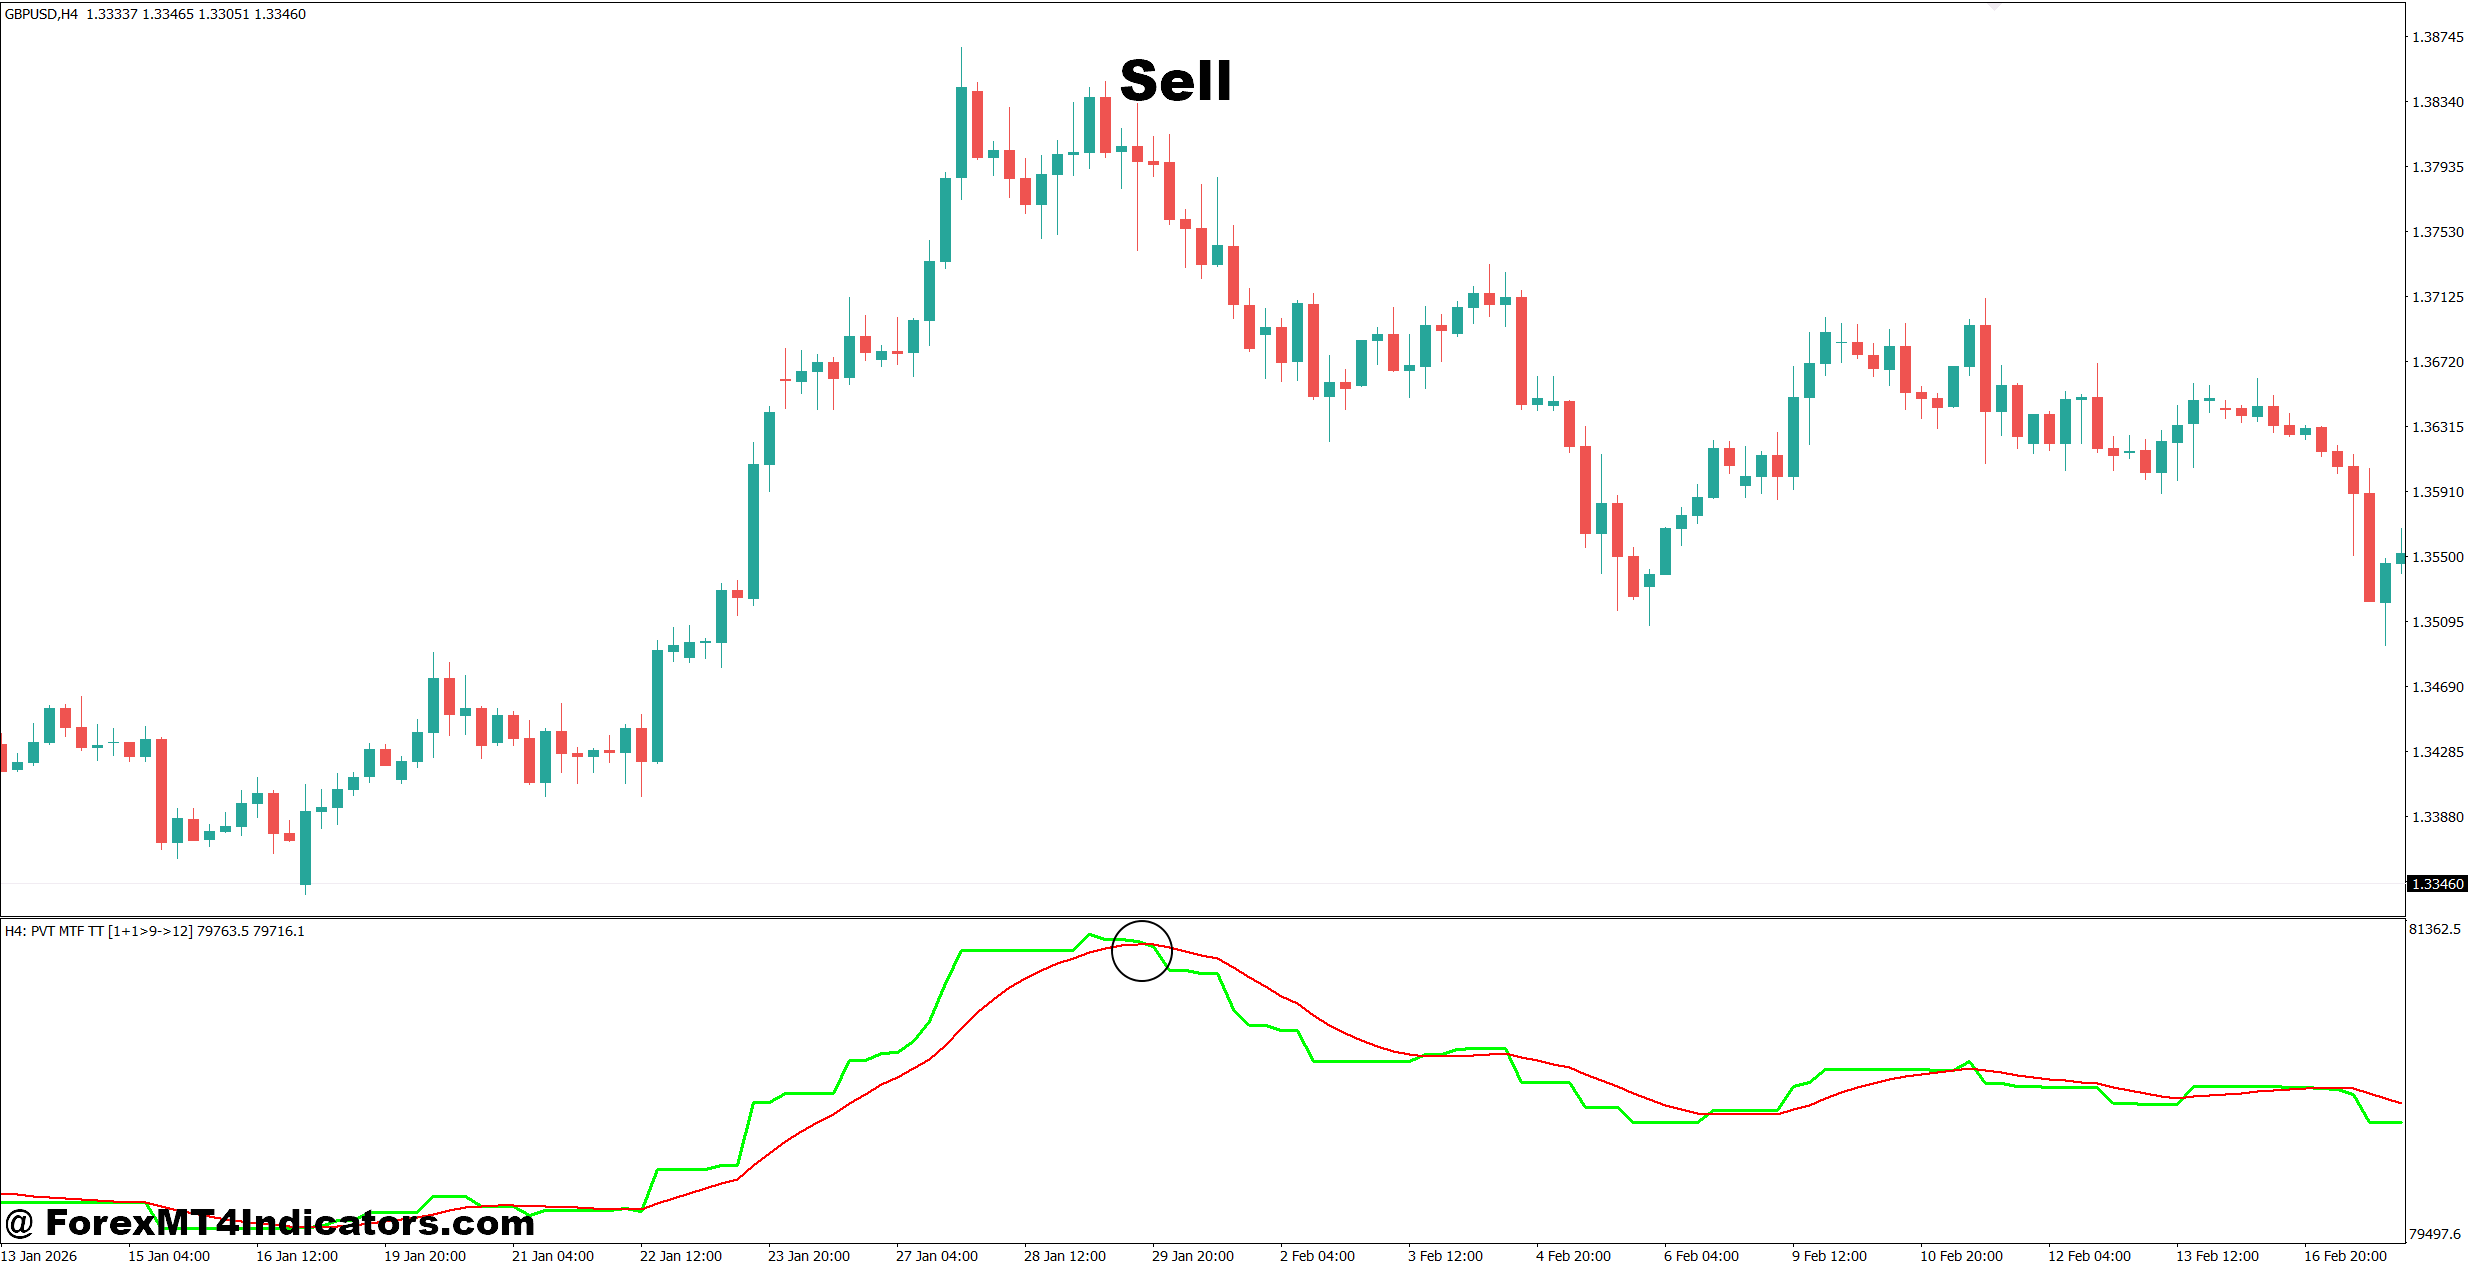
- Wait for VPT to turn bearish – Sell when VPT falls with price on the 1-hour chart, showing weaker buying pressure.
- Confirm support breakdown – Consider GBP/USD after price closes 10–15 pips below strong support while VPT makes a fresh low.
- Sell the retest – After EUR/USD breaks support, wait for a 5–15 pip retest followed by a bearish candle before entering.
- Check the 4-hour trend – Give more weight to H1 sell signals when 4-hour price and VPT both form lower highs and lower lows.
- Watch bearish divergence – If EUR/USD reaches a new high while VPT forms a lower high, wait for a bearish structure break before selling.
- Control downside risk – Place the stop 15–30 pips above the recent swing high and keep risk around 0.5%–1% per trade.
- Set practical profit targets – Look for 30–60 pips on H1 trades or target the next major support while maintaining at least 1:2 risk-to-reward.
- Avoid news-driven entries – Don’t sell immediately after an NFP or central-bank spike; wait for the daily or 4-hour candle structure to stabilize.
Conclusion
The Volume Price Trend Indicator MT4 can give traders another perspective on whether price movement is being supported by volume activity. Its value comes from the relationship between price and VPT, not from the indicator line alone.
- Use VPT for confirmation rather than treating it as an automatic entry signal.
- Watch divergence when price reaches new highs or lows without similar VPT strength.
- Combine it with structure such as support, resistance, trendlines, and swing highs or lows.
- Respect the data limitation because MT4 forex volume is generally broker-based tick volume.
Trading forex carries substantial risk. No indicator guarantees profits. Before using VPT with real money, traders should test their preferred settings across different pairs, timeframes, spreads, and market conditions. A useful next step is to compare several historical breakout and divergence setups and record whether VPT actually improved the trade selection process.
Level up your trading
Learn to read the chart — not just the indicator
eBook · Instant PDF
Video Course · 12 modules
Recommended MT4/MT5 Brokers
- ✓ *FREE *$50 to start (withdrawable)
- ✓ Deposit bonus up to $5,000
- ✓ Negative balance protection
Trading forex and CFDs carries a significant risk of loss and is not suitable for everyone. Broker links are affiliate links — we may earn a commission at no cost to you.
Free MT4 Indicator Download

Enter Your Email Address below, download link will be sent to you.
