


The Hurst Cycle Indicator MT4 is a technical analysis tool based on the idea that financial markets can show recurring price cycles. Instead of focusing only on whether price is moving up or down, it attempts to identify the rhythm between potential highs and lows.
The Hurst approach comes from cycle analysis associated with J.M. Hurst. In practical trading, the concept assumes that several market cycles can operate at the same time. A shorter cycle may create minor swings inside a larger cycle, while the longer cycle can influence the broader market structure.
Different MT4 versions may calculate and display Hurst cycles in slightly different ways. Some analyze historical price movement to estimate dominant cycle periods, while others use smoothing, moving-average relationships, or spectral-style calculations to identify recurring frequencies. Traders should therefore check the specific indicator’s inputs before assuming that every Hurst indicator uses the same formula.
The key idea remains simple: price may spend certain periods moving toward a cycle low and other periods moving toward a cycle high.
For example, suppose EUR/USD is trading on the 1-hour chart and has been making higher highs for several sessions. The indicator begins showing that a short-term cycle is approaching an expected low. That doesn’t automatically mean the trend has changed. It can simply warn traders that a pullback may be getting closer.
How Hurst Cycle Analysis Works in MT4
Cycle analysis looks for repetition in historical price behavior. One common approach is to smooth price data, measure the distance between significant turning points, and estimate the dominant period. If several swing lows appear roughly 18 to 22 candles apart, an indicator may identify a cycle close to that range.
The exact calculation depends on the MT4 version. Some implementations may use detrending and spectral analysis to separate different frequencies from price data. Others use a simpler rolling calculation to estimate cycle length. This distinction matters because two indicators carrying the same Hurst name can produce different signals.
A practical way to read the tool is to watch the timing rather than treating its lines as entry orders. If a cycle low is projected near a known H1 support zone, traders have a more useful setup. They can wait for price to test that area and look for confirmation such as a bullish rejection candle, a higher low, or a break above a nearby swing high.
Consider GBP/USD on a 1-hour chart. Assume price falls 55 pips into previous support around 1.2700 while the Hurst cycle model points toward a possible low within the next 3 to 5 candles. A trader might wait for price to hold 1.2700 and then break 1.2730 before considering a long position. The cycle provides timing context; price action provides confirmation.
That distinction can prevent a common mistake: buying simply because an indicator says a cycle low is due.
Reading Cycle Highs and Lows
A projected cycle low can be treated as an area where traders start watching for bullish evidence. A projected cycle high works in the opposite direction.
The strongest setups often appear when several factors line up. For instance:
- A cycle low approaches.
- Price reaches established support.
- The previous bearish swing loses momentum.
- A bullish candle closes above a short-term resistance level.
- The higher timeframe trend remains constructive.
The same principle applies to short trades. A cycle high near resistance becomes more interesting when price forms a lower high and breaks nearby support.
Hurst Cycle Indicator Settings and Trading Examples
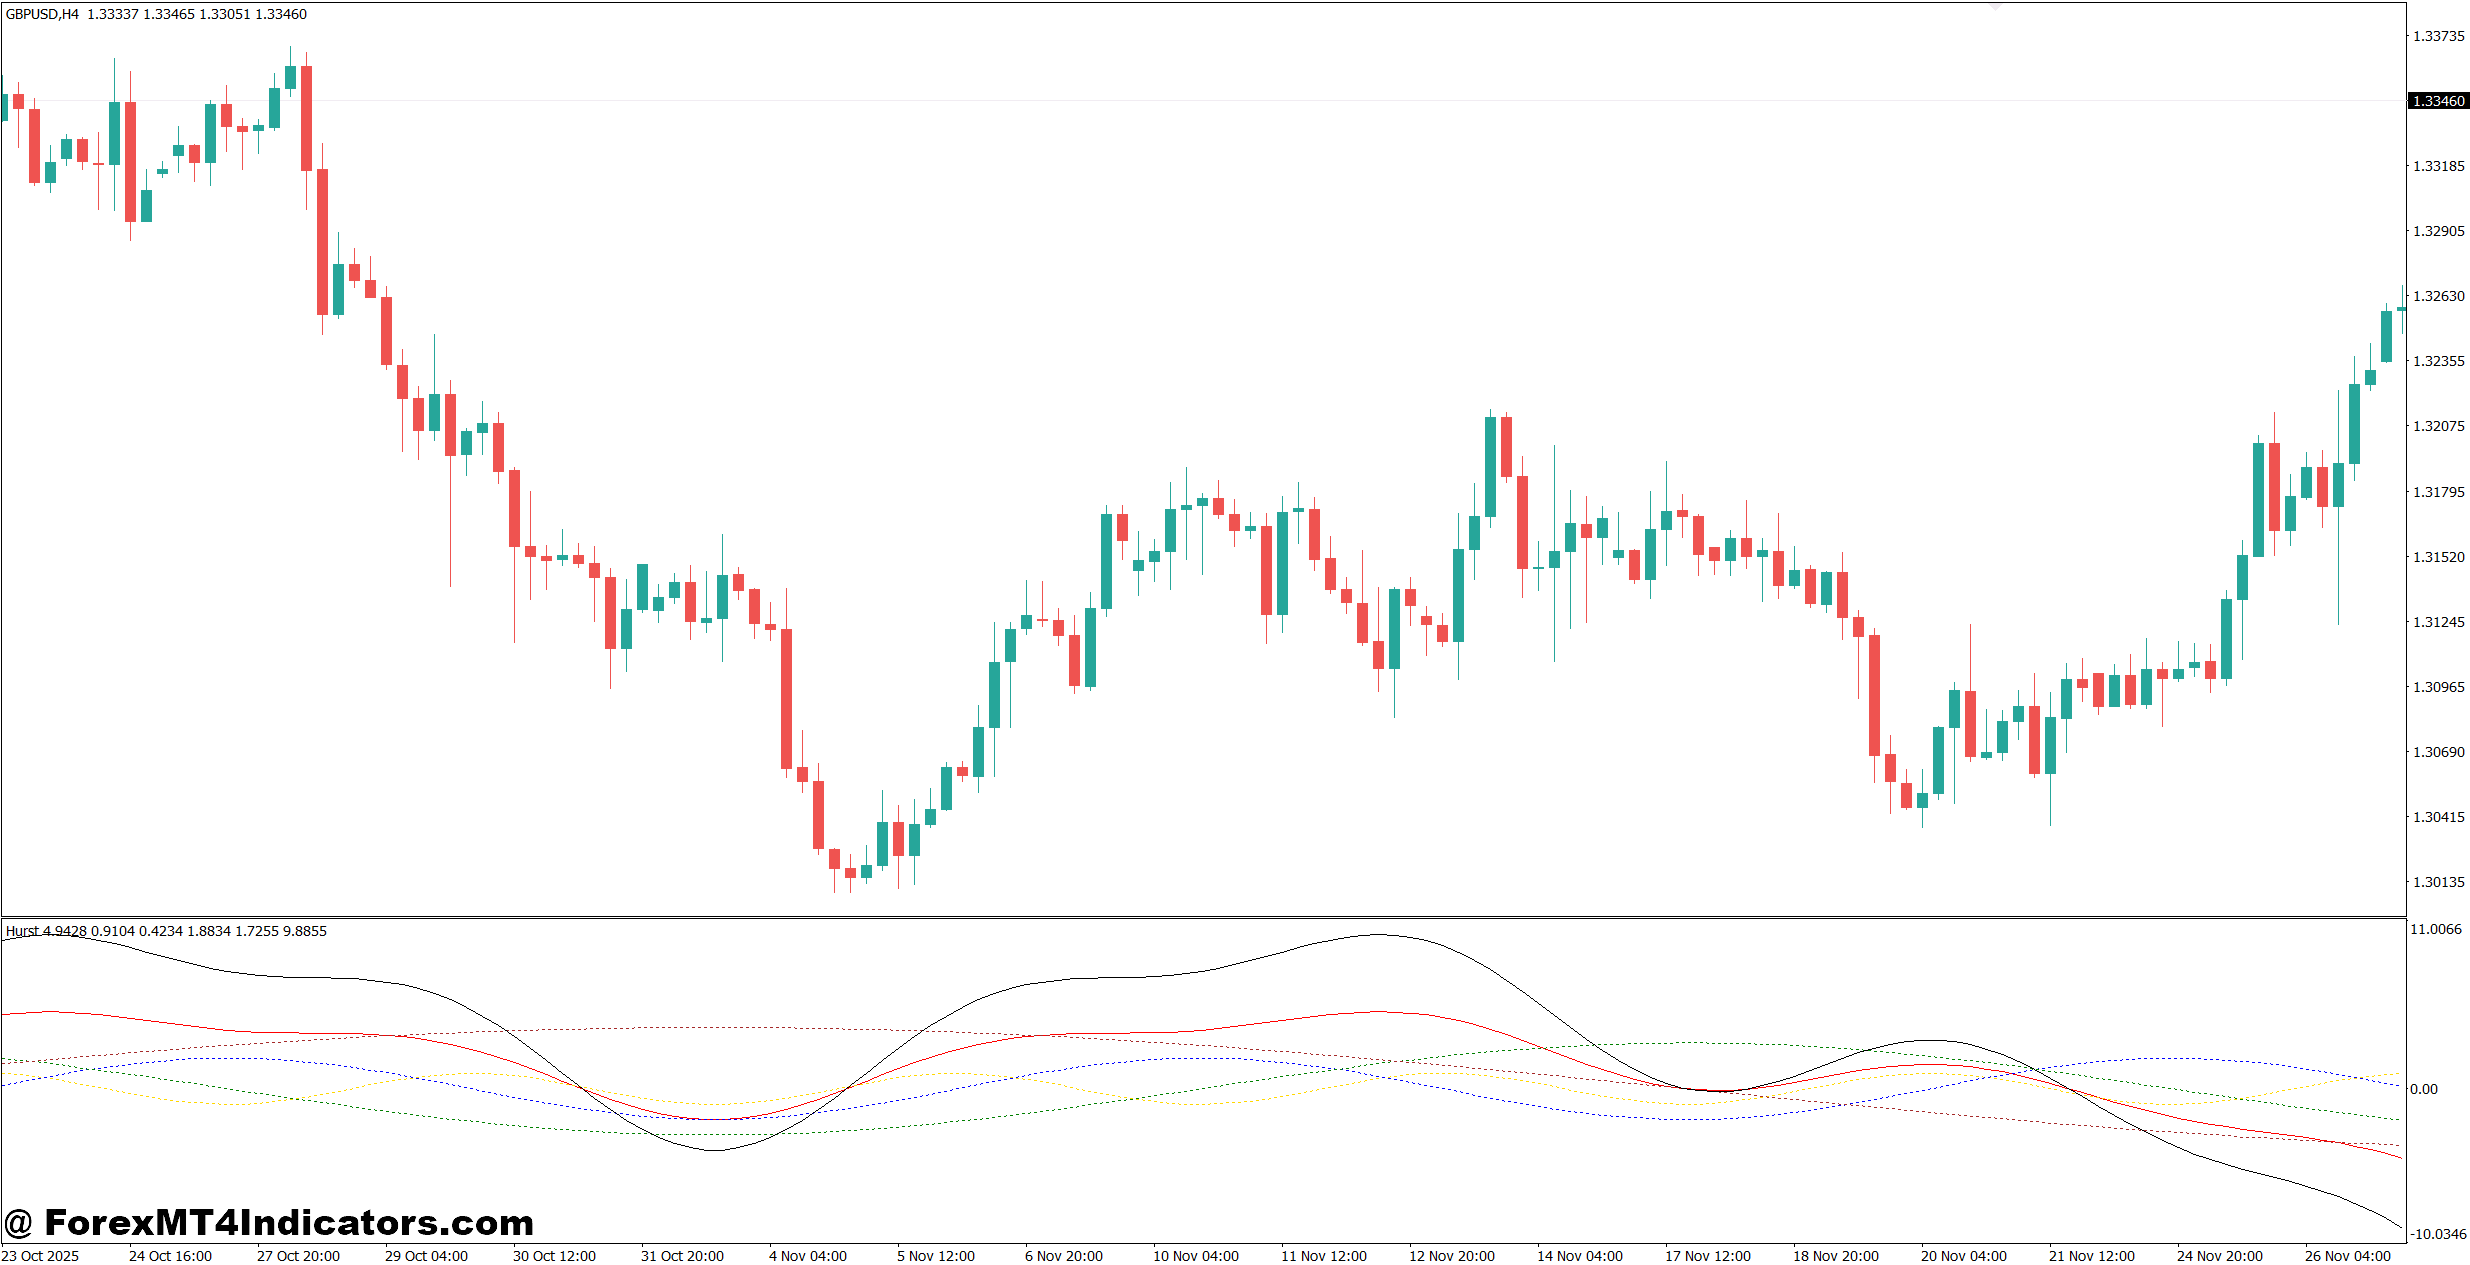
Settings should match the chart’s trading horizon. A parameter that works reasonably well on a daily chart may be too slow for a 5-minute strategy.
For intraday forex trading, traders can start by observing the indicator on the 15-minute, 1-hour, and 4-hour charts rather than immediately changing every input. The goal is to understand how the selected cycle length behaves before optimizing it.
A useful testing process is to record at least 30 to 50 historical signals. For each one, traders can write down the pair, timeframe, projected cycle point, entry confirmation, stop distance, and result. This exposes whether a setting actually helps or merely looks good on a handful of charts.
For example, on EUR/USD H1, a trader might test a cycle around 20 candles. If the projected turning points repeatedly arrive within roughly 3 to 4 candles of important swings, the setting may have practical value. If the indicator frequently changes its projected turning point after price moves, the trader should treat it with more caution.
Pair behavior also matters. EUR/USD often provides relatively clean technical movement during liquid sessions, while GBP/JPY can produce much sharper swings. A cycle setting that feels stable on EUR/USD may generate more false timing signals on a volatile cross.
News creates another problem. During NFP releases, CPI announcements, or unexpected central-bank comments, normal cycle behavior can be disrupted within minutes. A cycle forecast that looked reasonable before the release can become irrelevant after a 70-pip price spike.
That’s why experienced traders generally avoid placing a trade solely because a cycle is expected to turn.
Advantages and Limitations of the Hurst Cycle Indicator
One useful feature is timing. Traditional trend indicators can tell traders that price is bullish, but they may not show when a pullback is likely to become more relevant. Cycle analysis adds another layer by examining the timing of swings.
It can also help traders organize market observations. Instead of guessing when a correction might occur, a trader can monitor the expected cycle window and wait for price action to confirm it.
But there are clear limitations.
Cycle periods aren’t fixed. Market conditions change, and a cycle that appears stable during a quiet period can shorten or stretch when volatility increases. The indicator may also adjust its calculations as new candles arrive. Traders should check whether their specific version repaints historical cycle points before relying on backtested results.
Another issue is trend strength. A strong trend can continue through several expected cycle highs or lows. For example, if GBP/USD rallies 180 pips after a major fundamental catalyst, repeatedly shorting because a cycle high is approaching can become expensive.
A sensible risk model is more useful than trying to predict every turning point. A trader risking 1% of a $5,000 account has a maximum planned loss of $50. If the technical setup requires a 25-pip stop, the position size should be calculated around that risk rather than chosen first and justified afterward.
Trading forex carries substantial risk. No indicator guarantees profits.
Hurst Cycles vs RSI, Moving Averages, and Other Tools
The Hurst Cycle Indicator differs from an RSI because the two tools answer different questions. The 14-period RSI measures momentum and can highlight overbought or oversold conditions. Hurst cycle analysis focuses more on the timing and rhythm of price swings.
Moving averages are also different. A 50-period moving average can help define trend direction, while a Hurst-based tool can provide information about possible cycle timing. Combining them can be more useful than expecting either indicator to work alone.
For example, EUR/USD on H1 may remain above its 50-period moving average while a Hurst cycle approaches a low. Rather than shorting the expected cycle high or buying immediately, traders can wait for a pullback toward support. If price holds that level and breaks the previous H1 swing high, the cycle and trend information point in the same direction.
Support and resistance can add another layer of confirmation. A cycle low occurring in the middle of a wide trading range isn’t as compelling as one occurring directly at a well-tested support level.
This is where the indicator becomes more practical. It doesn’t need to predict every market turn. It can simply help traders decide when to pay closer attention.
How to Trade with Hurst Cycle Indicator MT4
Buy Entry
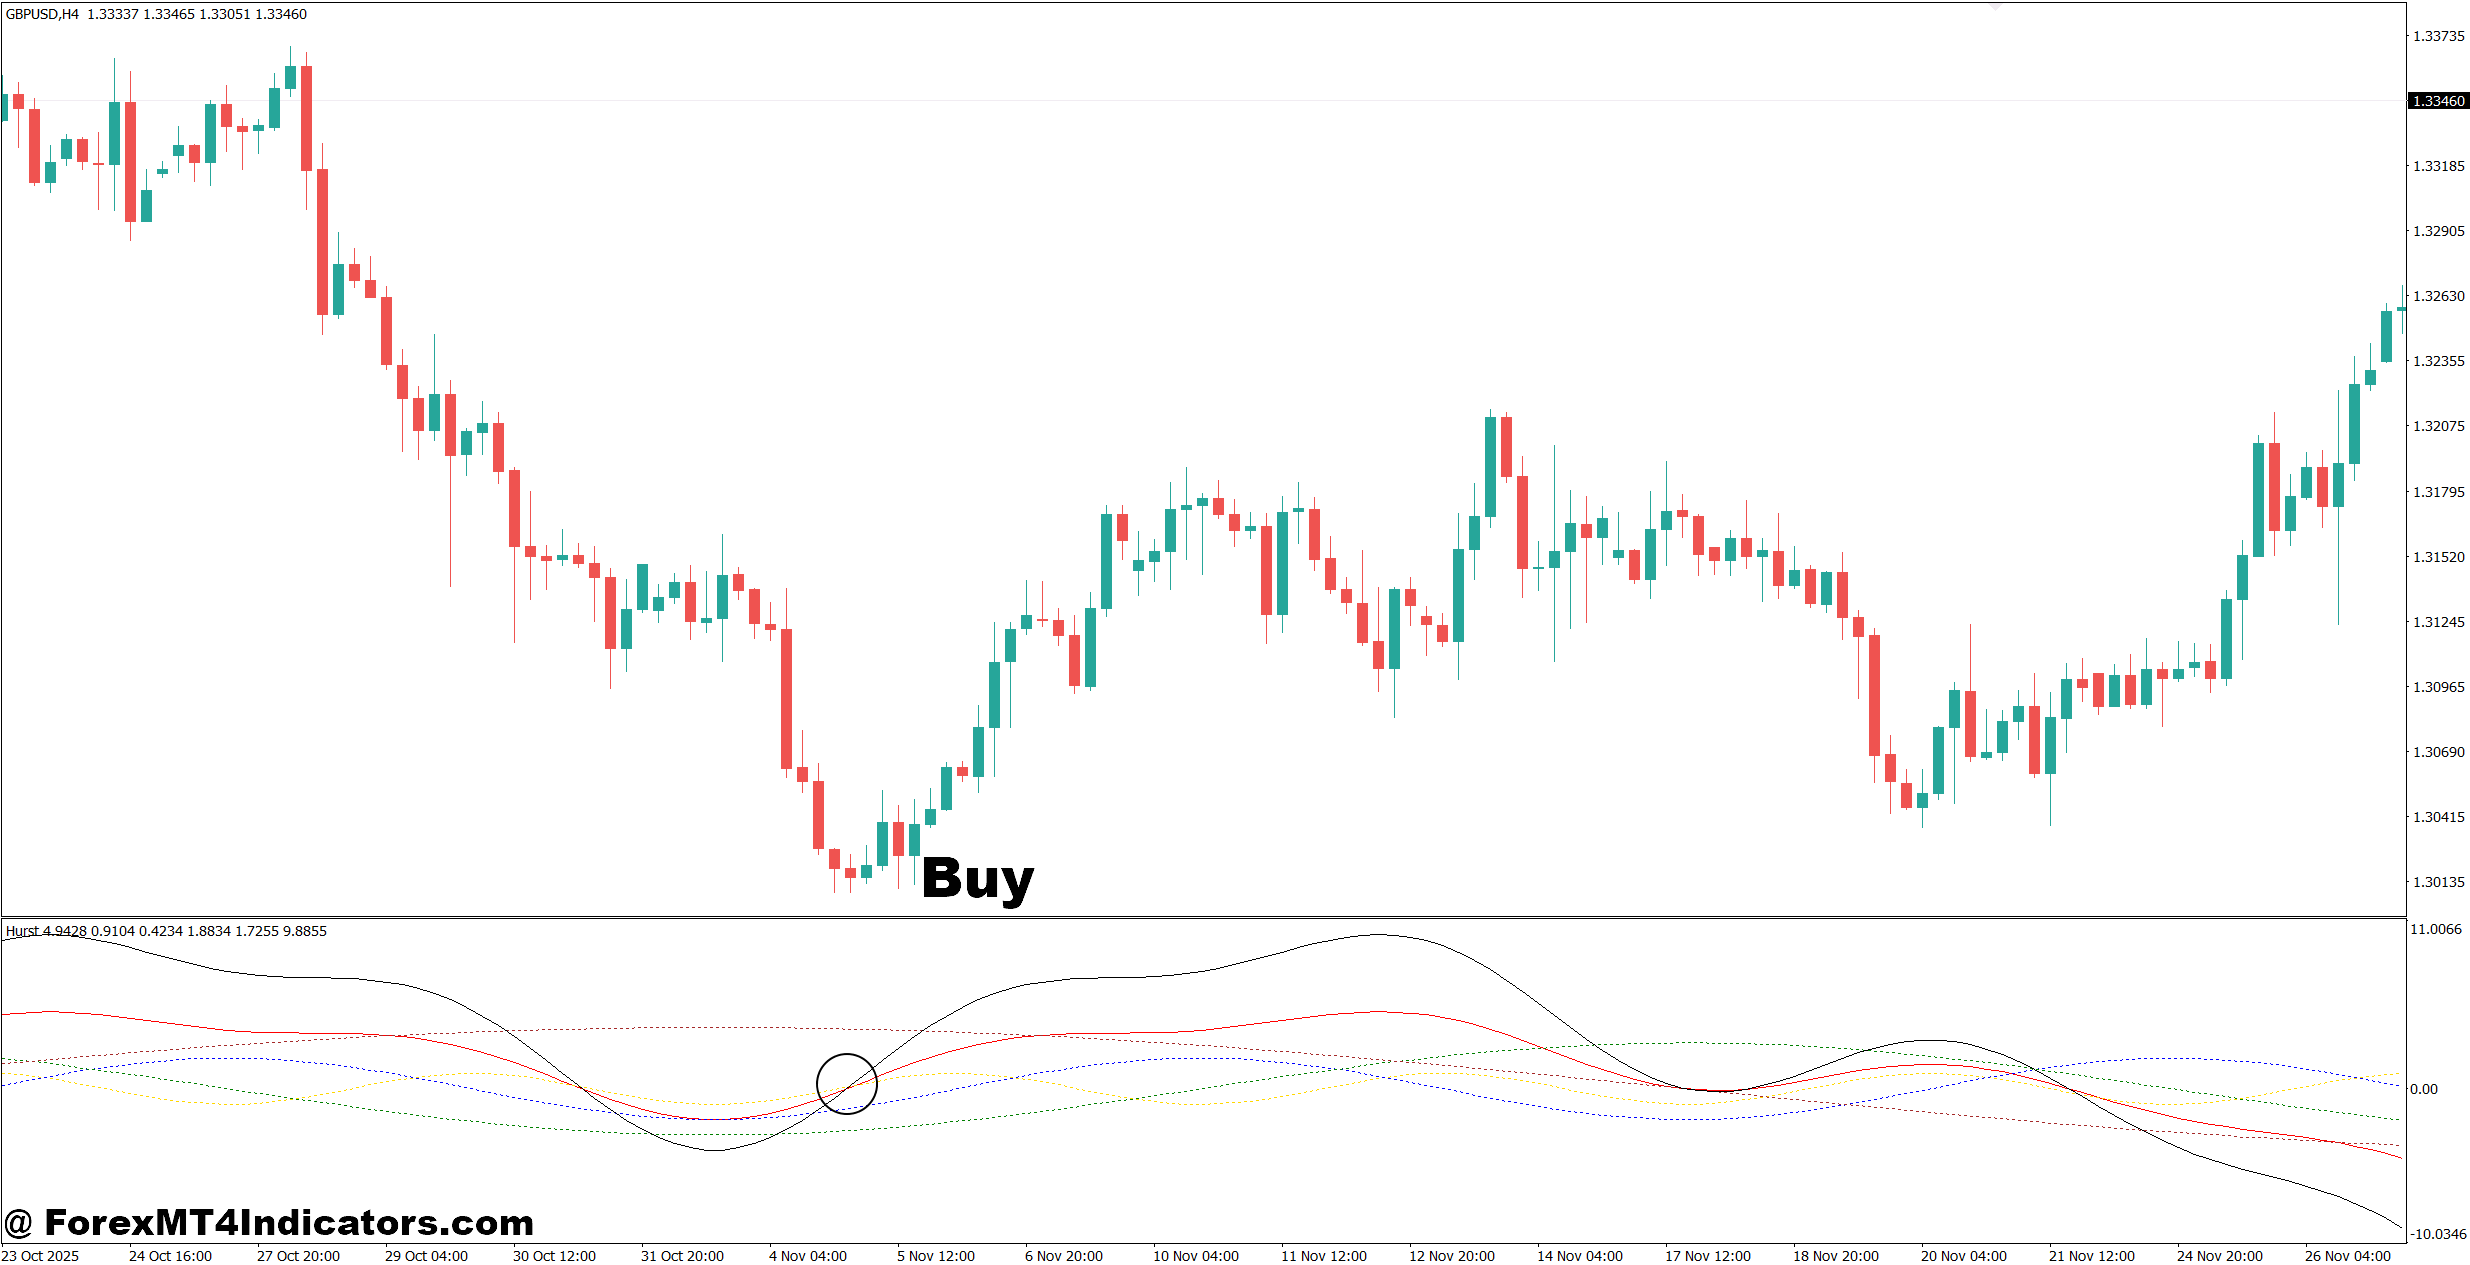
- Wait for a cycle low – Look for a bullish cycle turn on the 1-hour or 4-hour chart before considering a buy.
- Confirm H1 support – Buy EUR/USD when a cycle low forms near strong support and price rejects the zone by 10–15 pips.
- Check bullish structure – Enter after price breaks the previous H1 swing high by at least 5–10 pips.
- Use higher-timeframe bias – Favor GBP/USD buys when the daily trend is bullish and the H4 chart forms a higher low.
- Set a tight stop – Place the stop 15–30 pips below the confirmed swing low, depending on pair volatility.
- Target 1:2 risk/reward – If the stop is 20 pips, aim for at least 40 pips of profit before considering an extended target.
- Risk only 1% – Limit each Hurst-based trade to around 1% of account equity to reduce damage from failed cycle signals.
- Avoid major news – Don’t buy immediately before NFP, CPI, or central-bank releases because a cycle signal can fail during sharp volatility.
Sell Entry
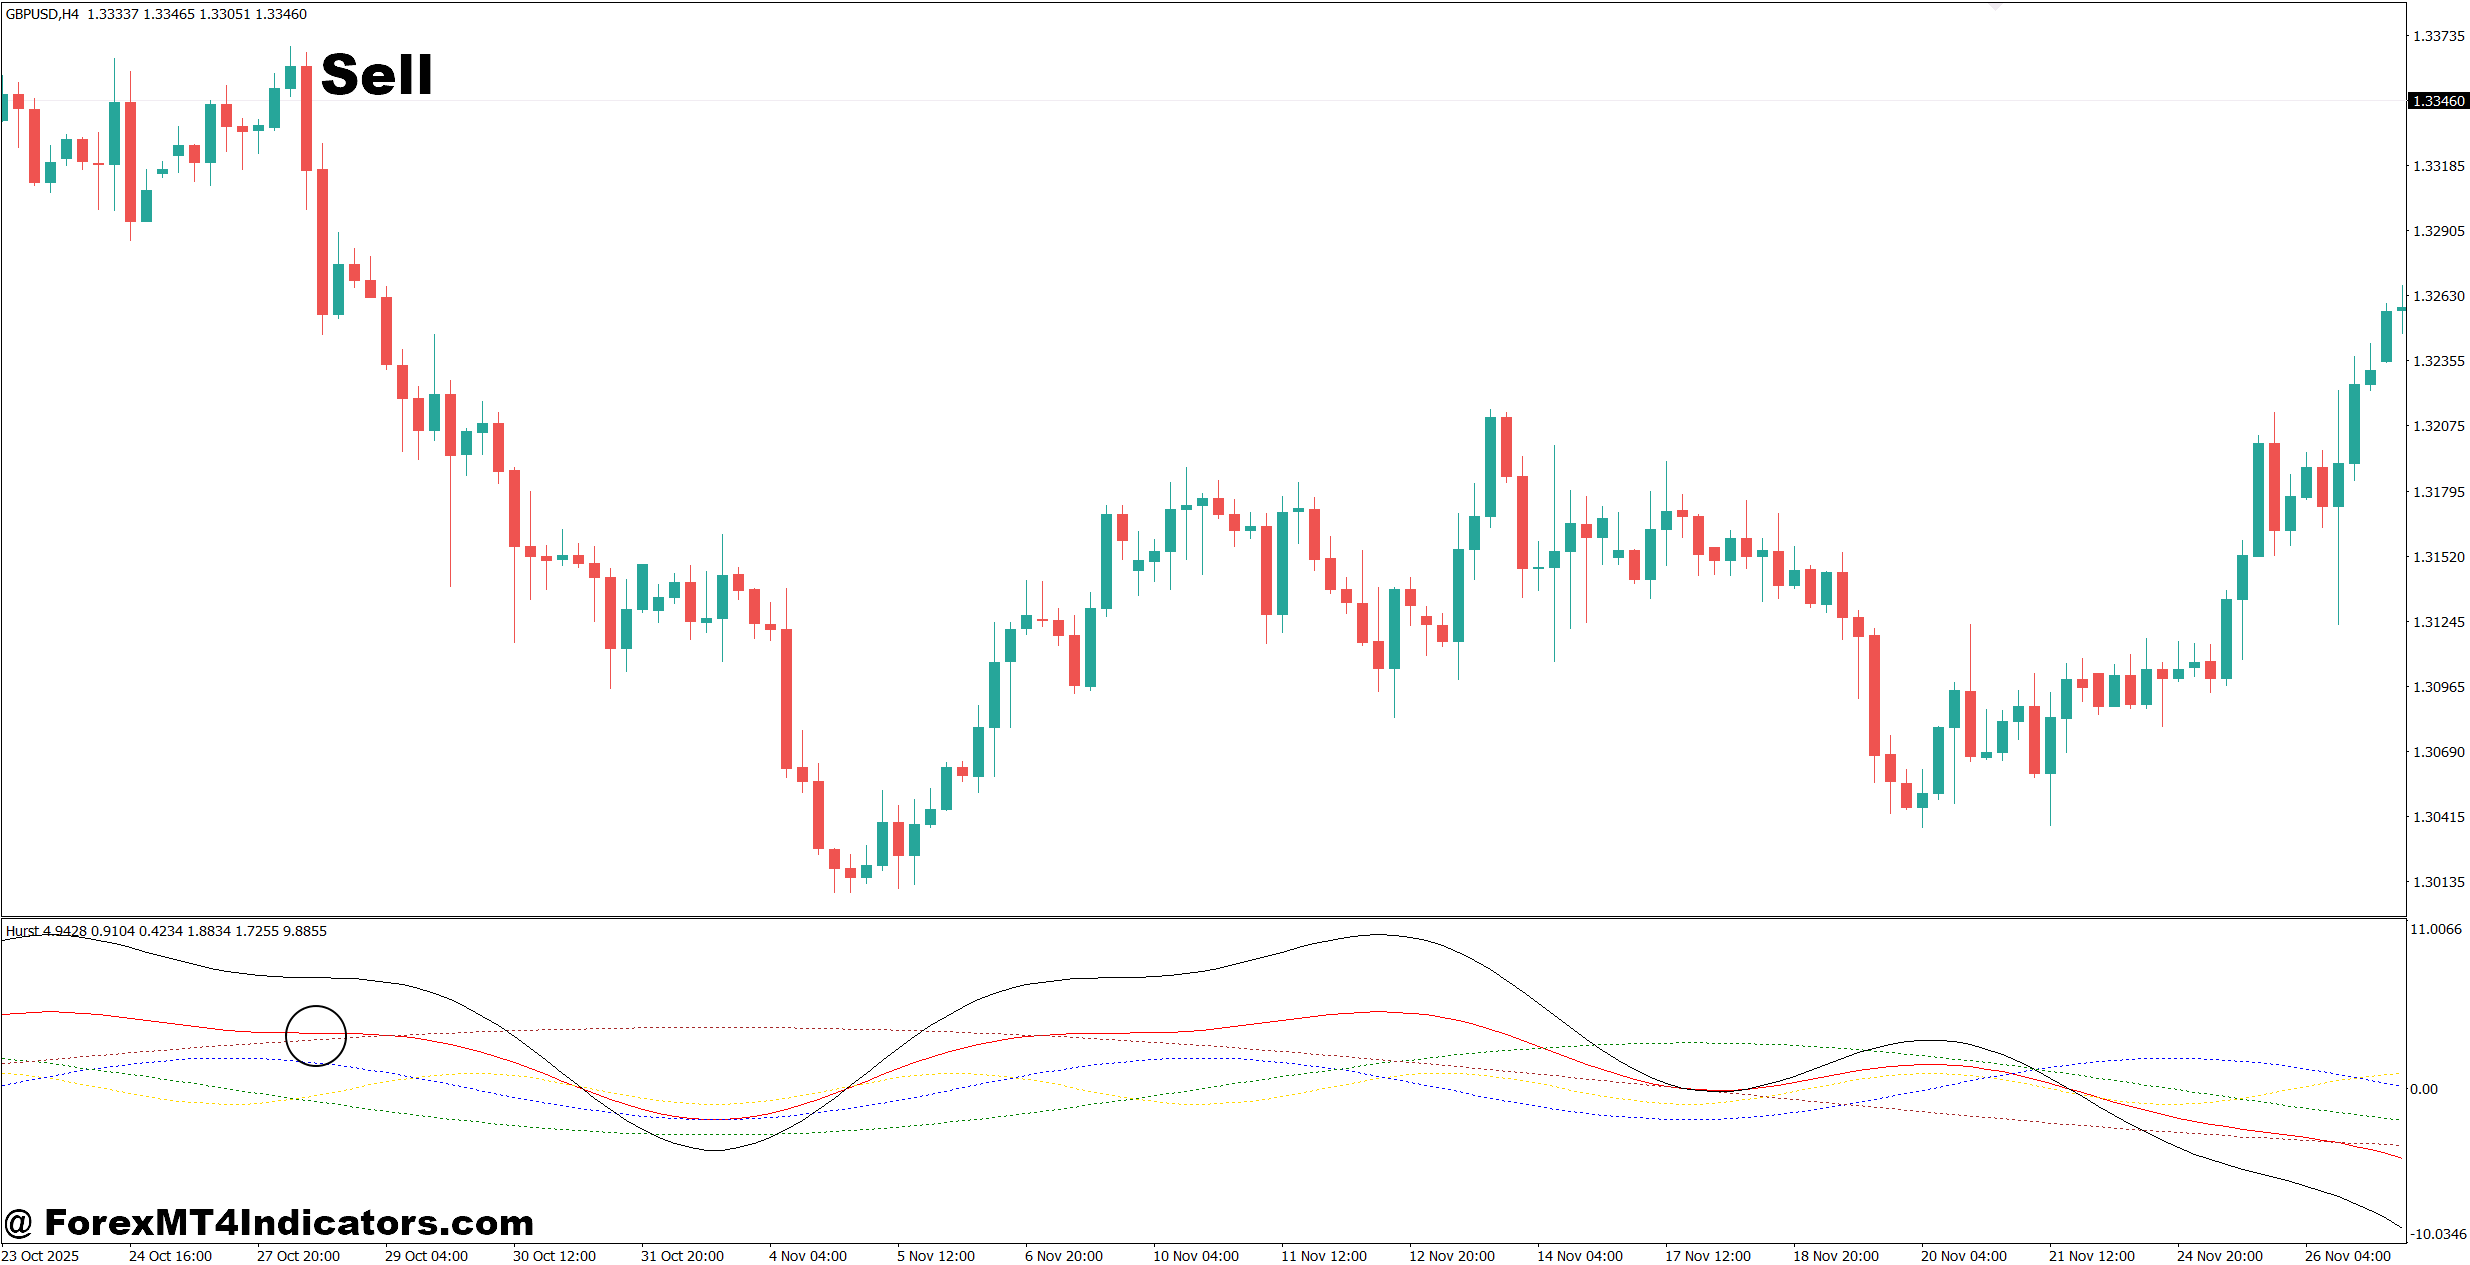
- Wait for a cycle high – Look for a bearish cycle turn on the 1-hour or 4-hour chart before opening a short.
- Confirm H1 resistance – Sell EUR/USD when a cycle high forms near resistance and price rejects the zone by 10–15 pips.
- Require bearish confirmation – Enter after price breaks the previous H1 swing low by 5–10 pips rather than selling the first reversal candle.
- Follow the daily trend – Favor GBP/USD shorts when the daily structure is bearish and H4 creates a lower high.
- Place the stop above resistance – Use a 15–30 pip stop when market structure supports that distance; avoid overly tight stops during volatile sessions.
- Aim for 1:2 minimum – With a 25-pip stop, look for roughly 50 pips of downside potential before entering.
- Keep risk below 1% – Use position sizing so one failed cycle prediction doesn’t cost more than about 1% of trading capital.
- Skip weak signals – Don’t short when price is strongly bullish, the cycle point is unclear, or major news is less than 15–30 minutes away.
Conclusion
The Hurst Cycle Indicator MT4 can be useful for traders who want to study the timing of market swings rather than relying only on trend direction. Its practical value increases when cycle timing agrees with price structure, support or resistance, and momentum.
- Use cycle highs and lows as areas of interest, not automatic entries.
- Test settings across at least 30 to 50 historical examples.
- Confirm signals with price action and the higher-timeframe trend.
- Reduce reliance on cycle forecasts during major economic news.
The best use of Hurst cycle analysis is usually selective. A trader doesn’t need every projected turning point to be correct. The goal is to find situations where several independent factors support the same trade idea. Before using the Hurst Cycle Indicator MT4 with real money, traders should test its exact version on their preferred pairs, spreads, and timeframes. A few weeks of disciplined forward testing can reveal far more than a perfect-looking historical chart.
Level up your trading
Learn to read the chart — not just the indicator
eBook · Instant PDF
Video Course · 12 modules
Recommended MT4/MT5 Brokers
- ✓ *FREE *$50 to start (withdrawable)
- ✓ Deposit bonus up to $5,000
- ✓ Negative balance protection
Trading forex and CFDs carries a significant risk of loss and is not suitable for everyone. Broker links are affiliate links — we may earn a commission at no cost to you.
Free MT4 Indicator Download

Enter Your Email Address below, download link will be sent to you.
