


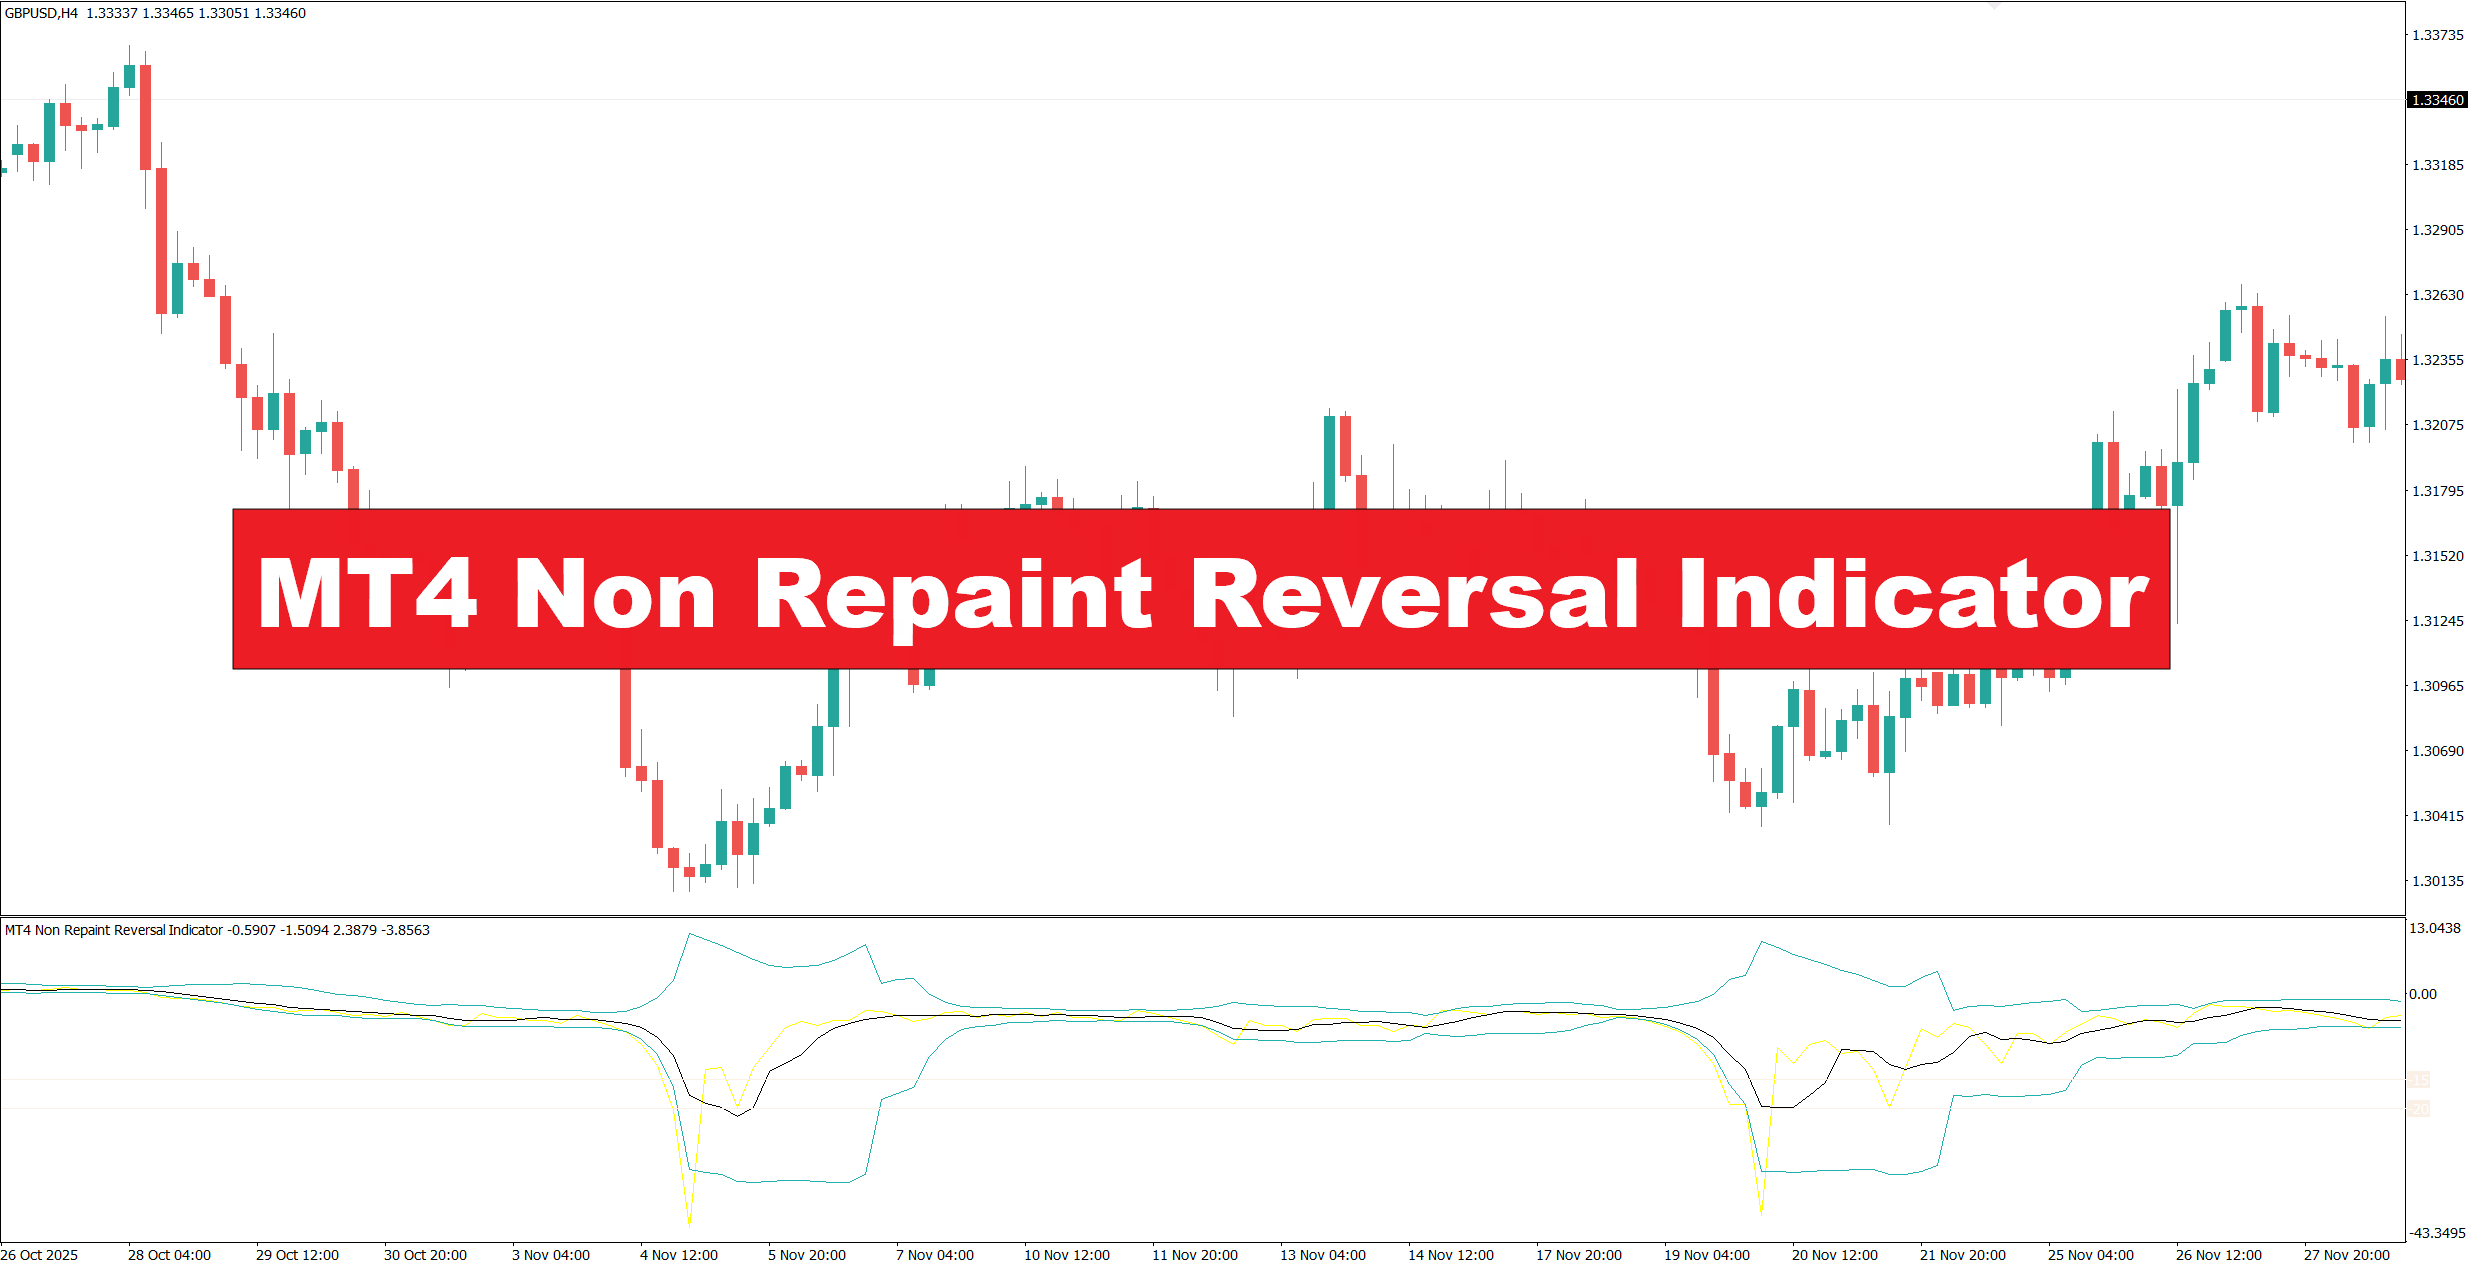
The MT4 Non Repaint Reversal Indicator is a technical analysis tool designed to highlight possible bullish and bearish reversals on a MetaTrader 4 chart. Depending on the specific version, it may display arrows, dots, lines, or other visual markers when its reversal conditions are met.
The key feature is the non-repainting behavior. Once a signal appears on a closed candle, the indicator should not move that historical signal to another candle simply because later market data changes. That distinction matters when traders review past setups.
Most reversal indicators work from combinations of price behavior, momentum, volatility, and recent highs or lows. A typical version may compare current price movement with a lookback period, calculate directional momentum, and then require confirmation before placing a reversal marker. Some versions also use moving averages, ATR-based filters, RSI conditions, or swing-point calculations.
The exact formula depends on the indicator’s source code. Traders should not assume every product labeled “non repaint” uses the same calculation. A proper test should confirm that signals remain fixed after the candle closes.
How the Reversal Logic Works in Practice
The basic idea is simple: the indicator looks for signs that the current move may be losing strength.
For example, suppose EUR/USD has fallen 65 pips over six 1-hour candles and reaches a previously tested support zone. If the indicator detects a bullish reversal condition near that level, it can print a buy signal after the required conditions are satisfied.
The signal becomes more useful when price action agrees. A trader might wait for a bullish candle to close above the previous candle’s high rather than buying immediately when the arrow appears. A 12-pip stop below the recent swing low could then define the trade risk.
A similar setup can occur on GBP/USD. Imagine the pair rises 90 pips during the London session before reaching resistance around a previous daily high. If a bearish reversal signal appears and the next H1 candle closes below the signal candle’s low, the trader has additional evidence that sellers are stepping in.
This approach helps separate a signal from an actual trade setup. An arrow by itself is not enough.
A useful confirmation routine
Traders can check four things before entering:
- The signal appears after a meaningful price extension.
- Price is near support, resistance, or a recent swing point.
- The signal candle closes rather than relying on an unfinished candle.
- The potential reward is at least 1.5 to 2 times the planned risk.
For instance, a EUR/USD setup with a 15-pip stop should ideally offer at least 23-30 pips of realistic upside before major resistance. If resistance sits only 10 pips away, the signal may be better ignored.
MT4 Non Repaint Reversal Indicator Settings
Settings can make a major difference. A fast configuration may produce more signals but also create more whipsaws. A slower setup can reduce noise but may enter after a large portion of the reversal has already happened.
On M5 and M15 charts, traders often need tighter filtering because short-term price movement contains considerable noise. A lookback setting around 10-20 candles can make the indicator more responsive, but it may also increase false signals.
On H1, a setting around 20-40 candles can provide a slower view of market swings. For H4 trading, traders may prefer even broader settings because a single candle represents a much larger price move.
These numbers are starting points, not universal rules. EUR/USD and USD/JPY may behave differently from GBP/JPY, which can move aggressively during active sessions.
A practical test could use EUR/USD H1 for 50-100 historical setups. Traders can record the signal direction, entry price, stop distance, maximum favorable excursion, and final result. That gives a better picture than simply looking at a chart and counting successful arrows.
News also deserves attention. When testing the indicator on NFP days, CPI releases, or central-bank announcements, traders may see price jump 30-80 pips within minutes. A reversal signal during such conditions can fail before a sensible stop can protect the position.
Strengths, Limitations, and Comparisons
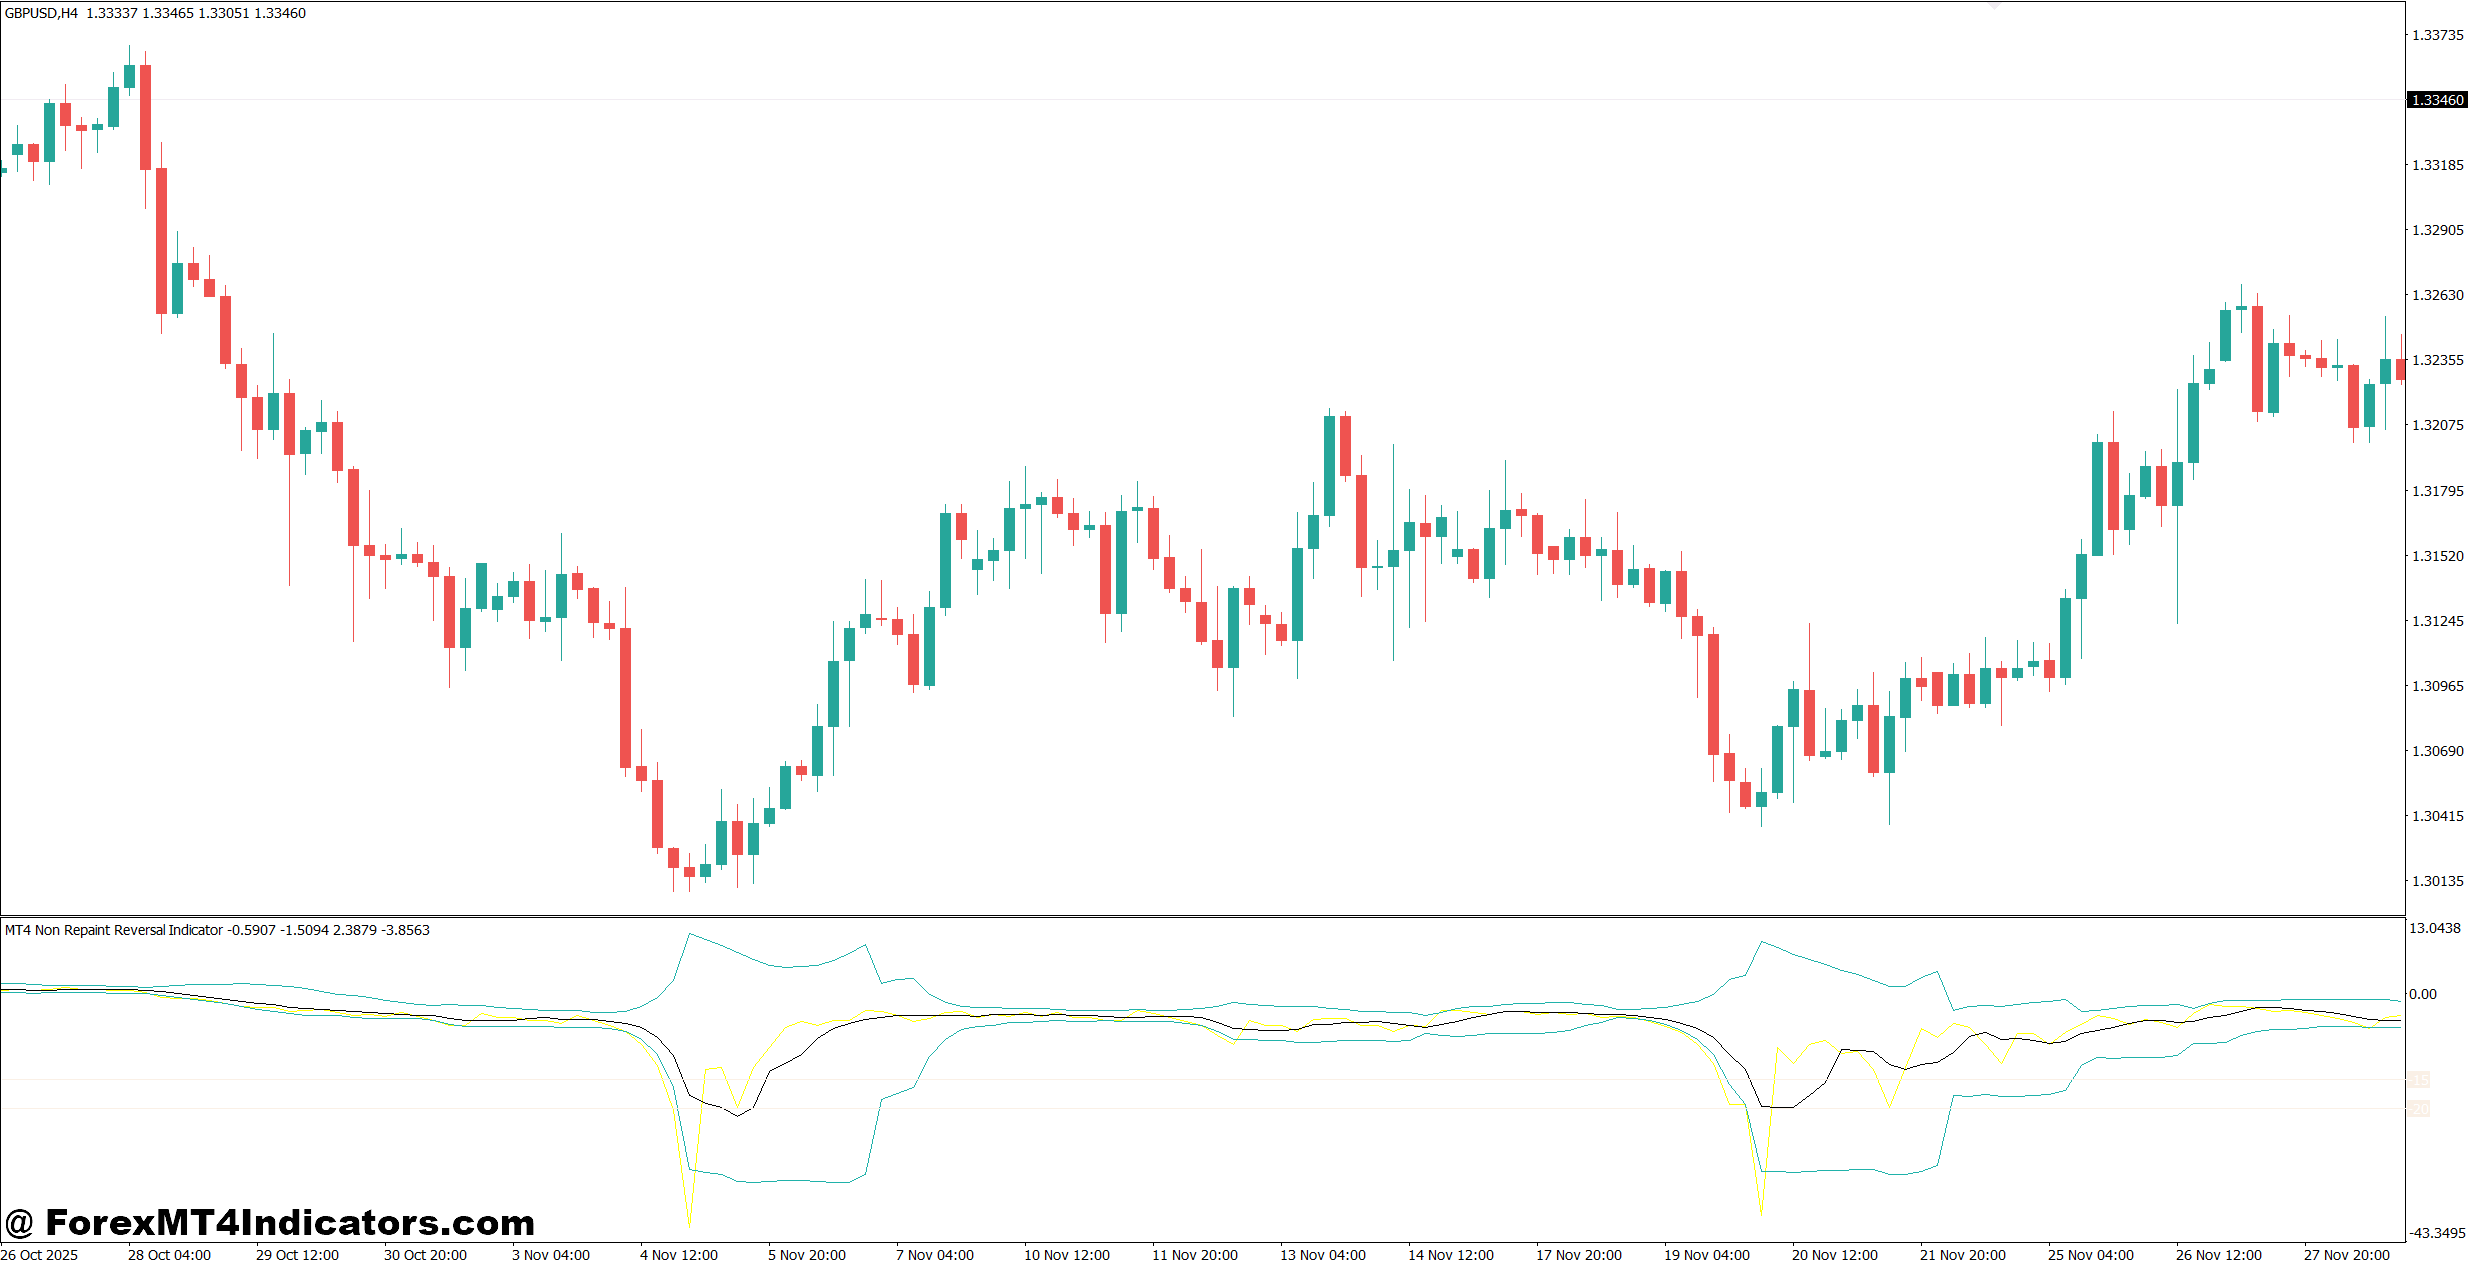
The biggest advantage of a non-repainting reversal tool is cleaner historical analysis. If a signal stays where it originally appeared, traders can judge whether the method would have worked in real time.
It can also help with chart structure. A trader watching H1 support and resistance may use reversal signals as an alert rather than constantly scanning every candle. This is especially useful when several currency pairs are being monitored.
But there are clear limitations. Non-repainting does not mean non-losing. A signal can remain perfectly fixed and still be wrong. Strong trends can also produce repeated reversal signals while price keeps moving in the same direction.
This is where comparison with other indicators becomes useful. RSI, for example, can identify overbought and oversold conditions, but an overbought reading can remain in place during a strong bullish trend. Moving averages are better suited to trend direction, while support and resistance help traders judge where reversals have a better chance of developing.
The reversal indicator sits somewhere between these approaches. It can provide timing, while market structure provides context.
A trader might therefore combine an H1 50-period moving average with the reversal indicator. If price remains above the moving average, bearish reversal signals could be treated cautiously. A bullish signal near H1 support would receive more attention if the broader trend remains upward.
That said, traders should avoid adding five or six indicators just to feel safer. If every tool gives a different answer, the chart becomes harder to read rather than easier.
A Simple Trading Framework
Consider GBP/USD on the 1-hour chart. Price has climbed 75 pips into a resistance zone formed by two previous H4 highs. A bearish non-repaint signal appears, and the next candle closes 8 pips below the signal candle’s low.
A trader could enter around that breakdown, place a 15-pip stop above the recent swing high, and target the next support zone approximately 35 pips lower. That creates a potential reward-to-risk ratio above 2:1.
Now consider the opposite situation. USD/JPY prints a bullish reversal signal after only a 12-pip decline, but there is no nearby support and the pair is trading below a falling H1 moving average. The signal may technically be valid, yet the surrounding conditions are weak. Skipping the trade can be the better decision.
This is one of the habits experienced traders develop: not every signal deserves an order.
Position sizing matters just as much. If an account risks 1% per trade, a $2,000 account would put $20 at risk. A 20-pip stop should then be matched with a position size that keeps the maximum planned loss close to that amount, subject to the pair’s pip value and broker specifications.
Trading forex carries substantial risk. No indicator guarantees profits.
How to Trade with MT4 Non Repaint Reversal Indicator
Buy Entry
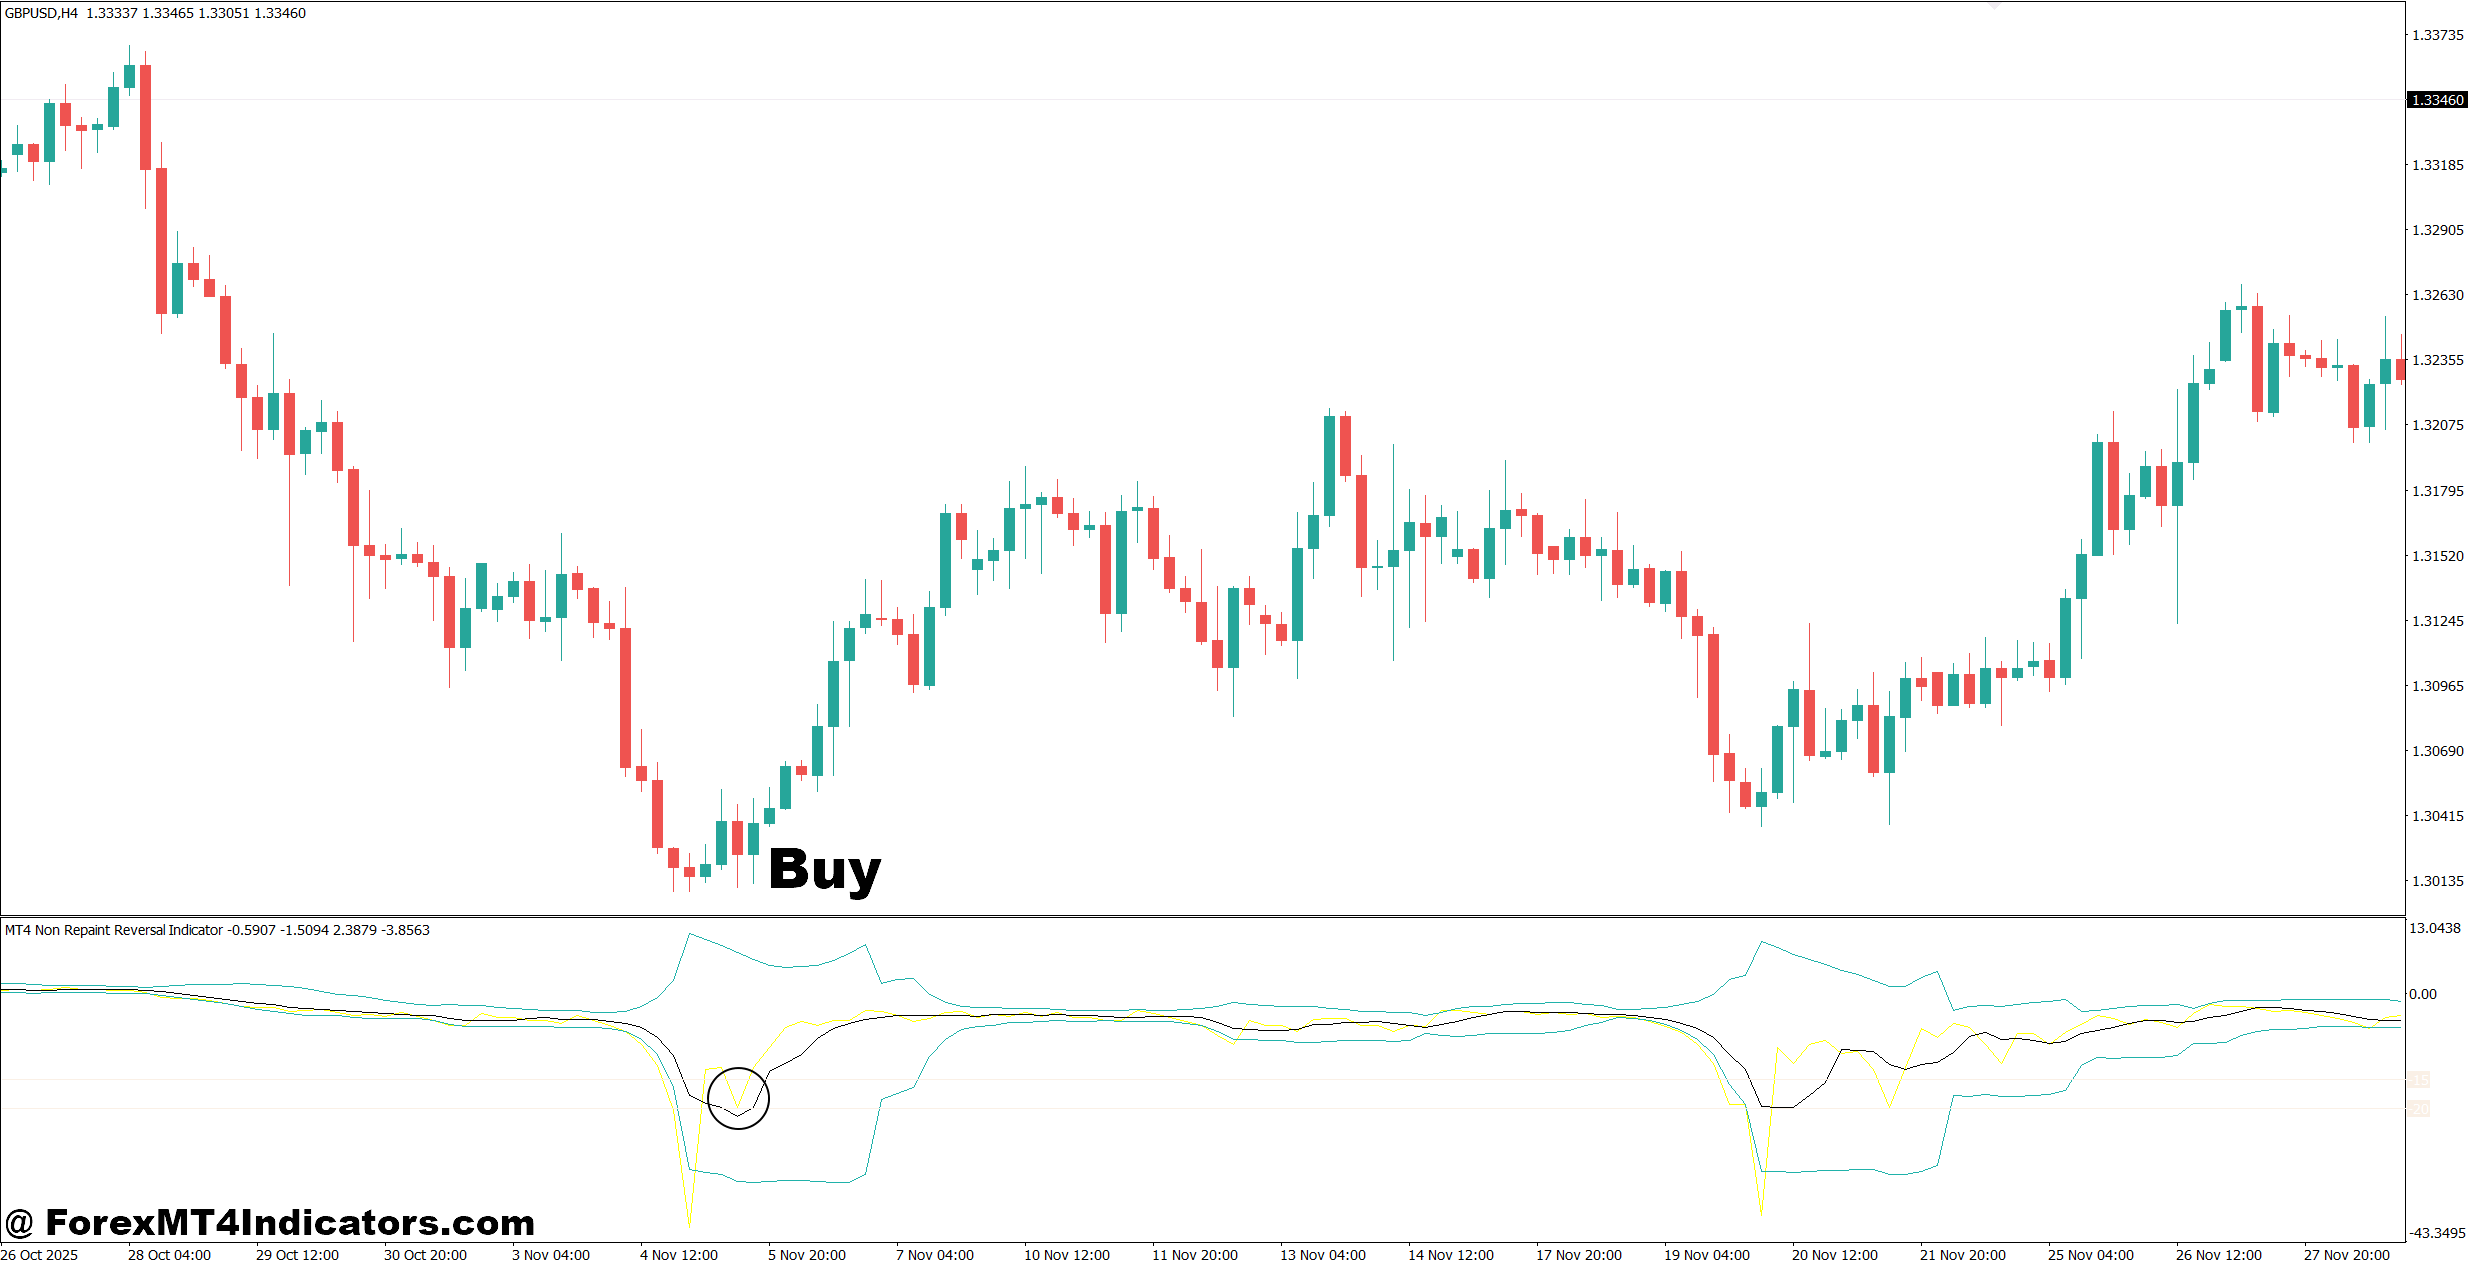
- Wait for a confirmed BUY arrow – Enter only after the signal candle closes on the M15, H1, or H4 chart; avoid acting on an unfinished candle.
- Check nearby support – Prefer BUY signals within 10–20 pips of strong support, especially on EUR/USD H1 or H4 charts.
- Confirm bullish price action – Look for a bullish engulfing candle or higher close after the reversal signal before entering.
- Use a 10–20 pip stop – Place the stop below the recent swing low, depending on volatility and timeframe.
- Target 1.5–2R minimum – If risking 15 pips, aim for at least 23–30 pips before major resistance.
- Confirm the higher timeframe – A BUY signal on EUR/USD H1 has more context when the H4 structure shows higher highs and higher lows.
- Risk only 1% per trade – Keep the maximum account loss near 1%; avoid increasing lot size after a losing signal.
- Skip weak reversal setups – Don’t buy GBP/USD after a signal if price is 20+ pips below major resistance or a strong bearish trend remains intact.
Sell Entry
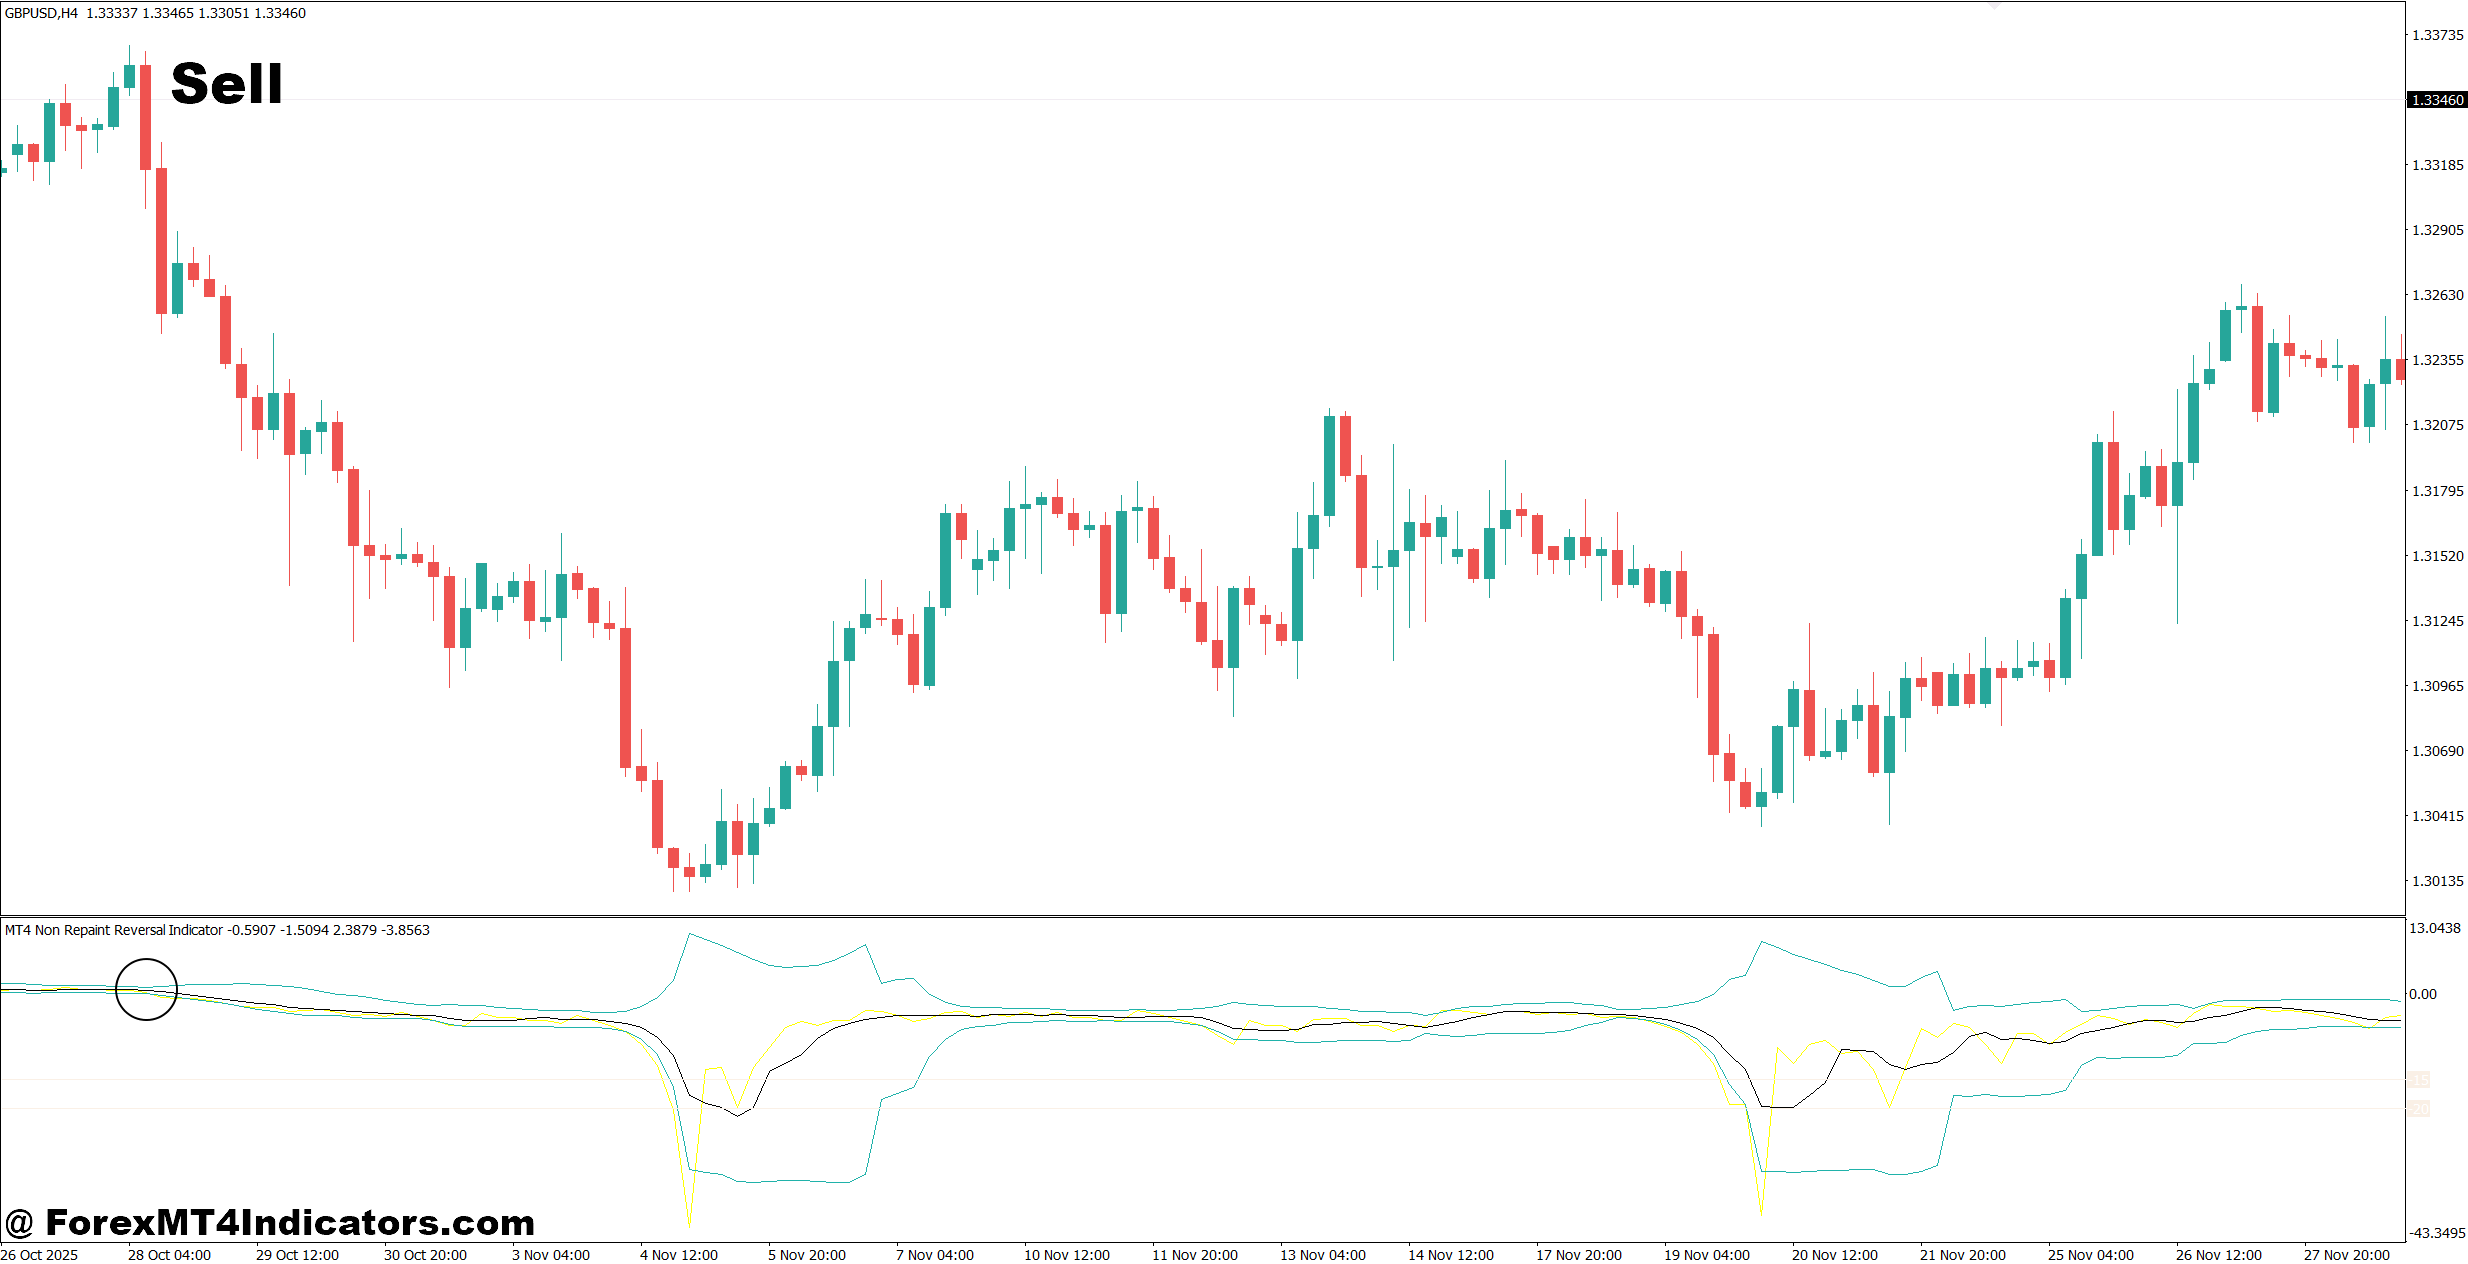
- Wait for a confirmed SELL arrow – Let the M15, H1, or H4 signal candle close before entering to avoid false intrabar signals.
- Sell near resistance – Favor signals within 10–20 pips of established resistance or a previous daily high.
- Confirm bearish momentum – Wait for a bearish engulfing candle or a close below the previous candle’s low.
- Set a 10–20 pip stop – Place the stop above the recent swing high while allowing enough room for normal market noise.
- Aim for 1.5–2R – With a 20-pip stop on GBP/USD H1, look for roughly 30–40 pips of realistic downside.
- Check the daily trend – A SELL signal on EUR/USD H4 carries more weight when the Daily chart shows lower highs and lower lows.
- Keep risk near 1% – Reduce position size when volatility expands rather than widening the stop without adjusting the lot size.
- Avoid selling strong breakouts – Don’t take a SELL signal when GBP/USD has broken daily resistance with a large 30–50 pip bullish candle and strong momentum.
Final Thoughts
The MT4 Non Repaint Reversal Indicator can be useful for traders who want clearer reversal alerts and more reliable historical testing. Its main strength is that completed signals should remain fixed instead of shifting after later candles appear. But the indicator should act as a timing tool, not a standalone trading system.
A practical approach is to:
- Check the signal against support and resistance.
- Confirm the candle has closed before acting.
- Use market structure and trend direction for context.
- Keep risk near 1% or less when testing a new setup.
The best results come from testing the actual indicator on the chosen pair and timeframe rather than trusting a handful of attractive historical examples. Before risking real money, traders can forward-test it on a demo account for several weeks and record every signal. That process will show whether the MT4 Non Repaint Reversal Indicator fits the trader’s own style, risk tolerance, and execution habits.
Level up your trading
Learn to read the chart — not just the indicator
eBook · Instant PDF
Video Course · 12 modules
Recommended MT4/MT5 Brokers
- ✓ *FREE *$50 to start (withdrawable)
- ✓ Deposit bonus up to $5,000
- ✓ Negative balance protection
Trading forex and CFDs carries a significant risk of loss and is not suitable for everyone. Broker links are affiliate links — we may earn a commission at no cost to you.
Free MT4 Indicator Download

Enter Your Email Address below, download link will be sent to you.
