

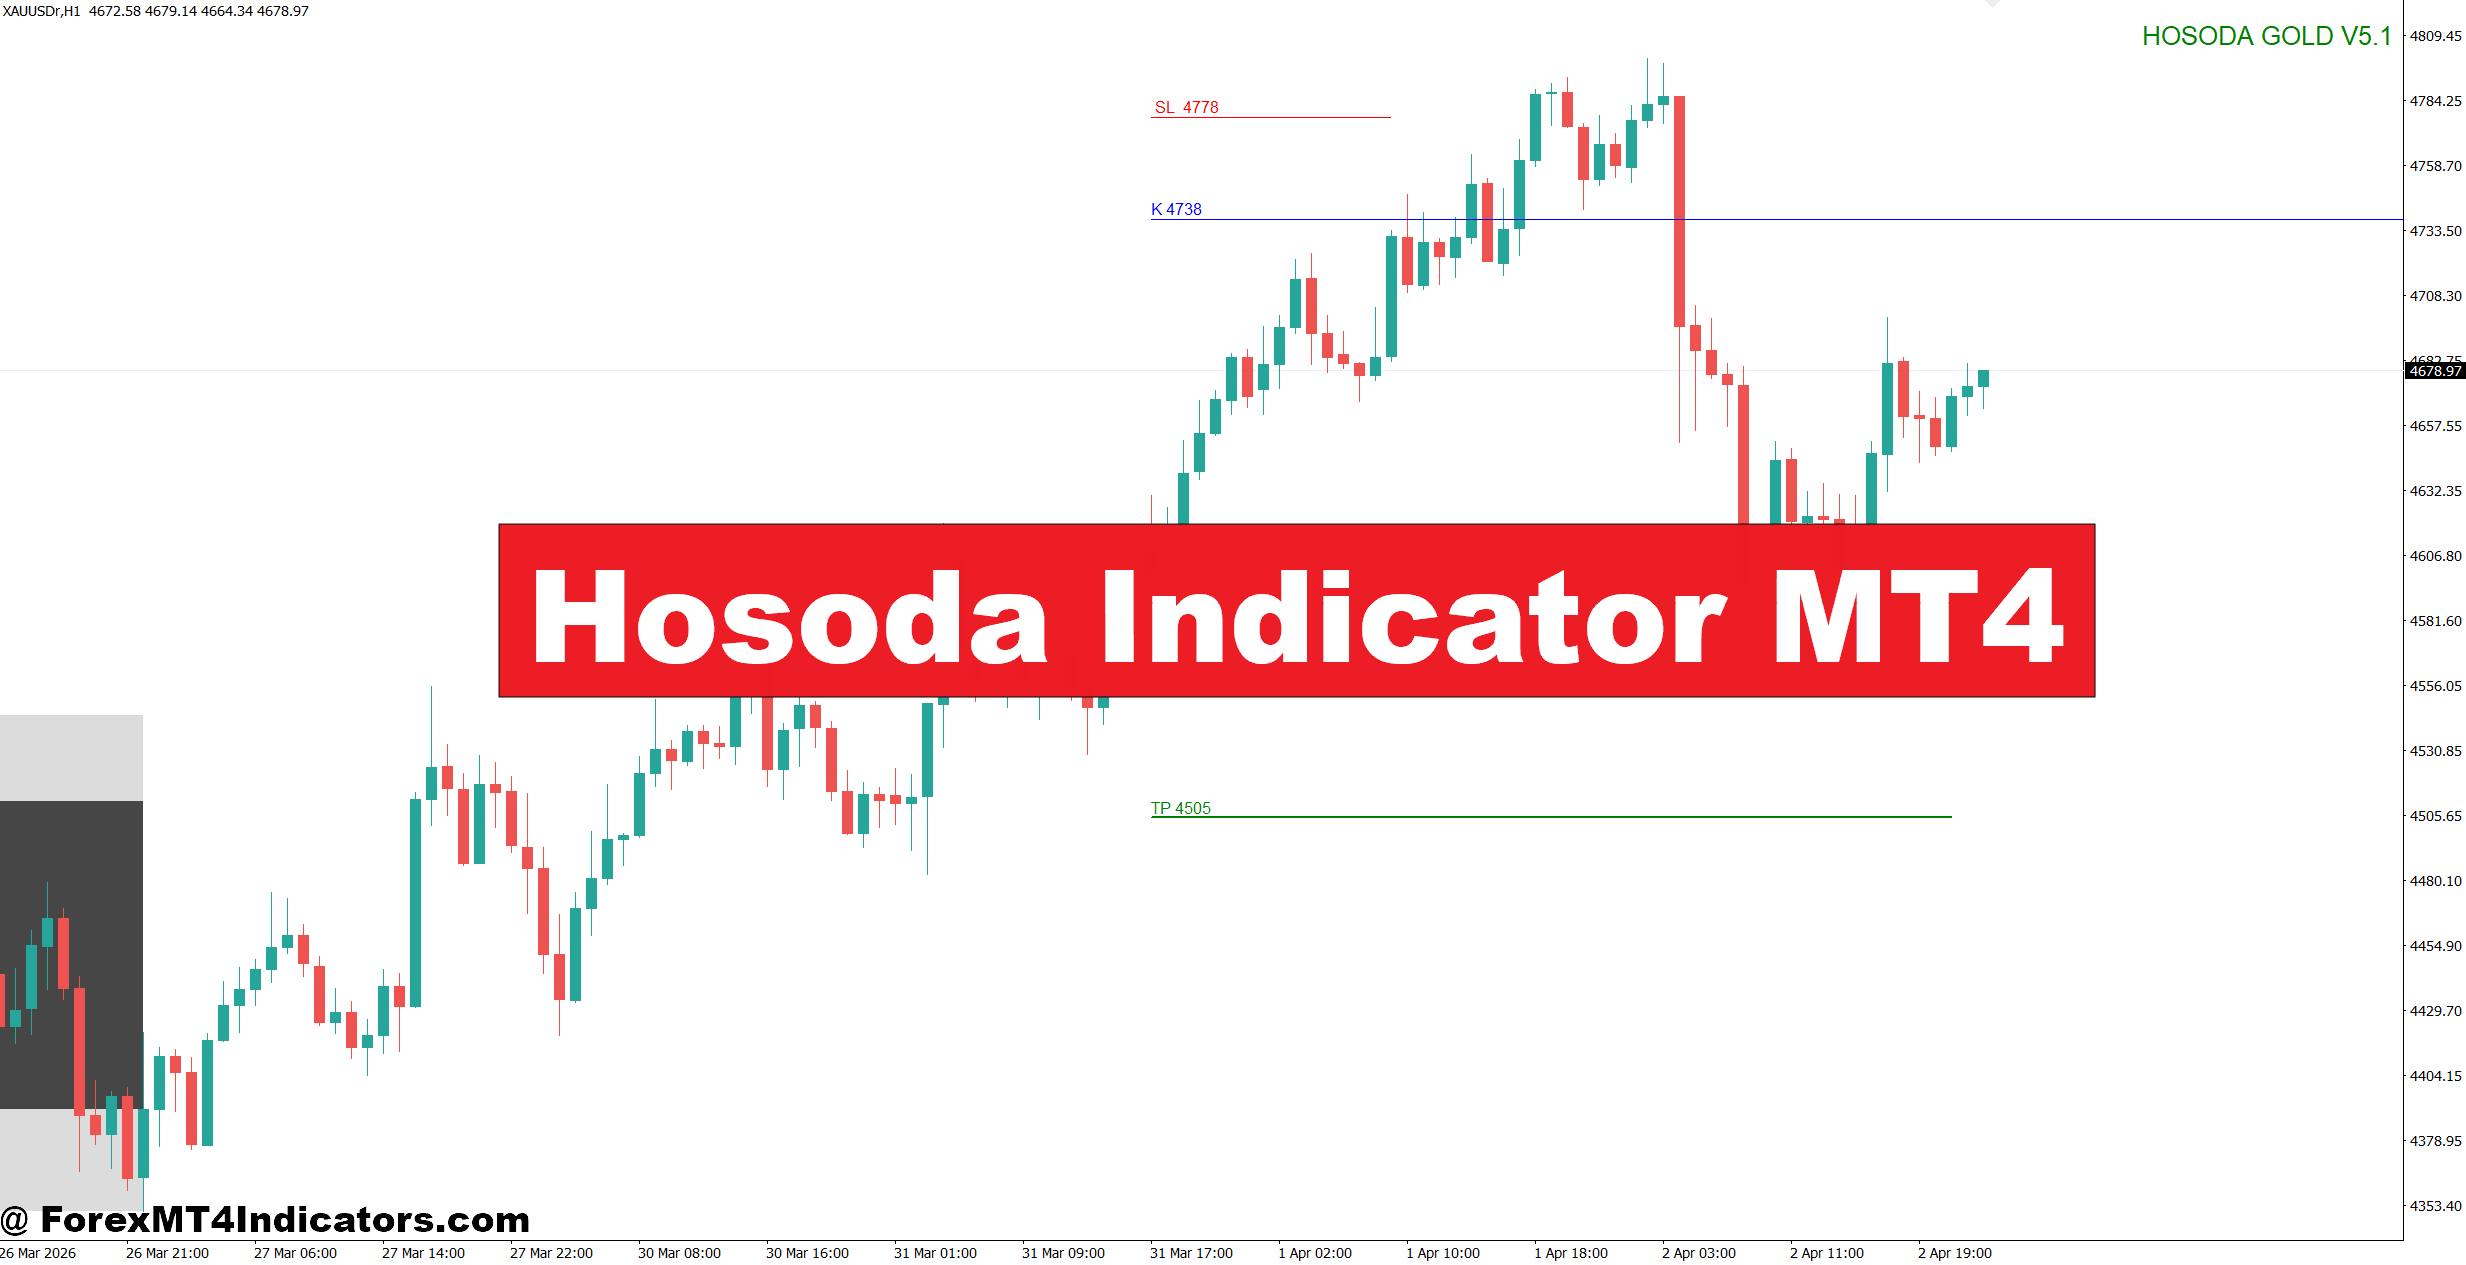
The Hosoda Indicator MT4 was designed to solve this problem by giving traders a broader view of market direction, momentum, and potential support or resistance levels in one chart. Instead of focusing on only moving averages or oscillators, it combines several components to show where buyers and sellers have the advantage.
Many traders find that it reduces unnecessary trades during choppy sessions while helping them stay with stronger trends. That doesn’t mean every signal is profitable, but it can improve decision-making when combined with proper risk management and price action. The following sections explain how the indicator works, how traders apply it, and where it performs best.
What Is the Hosoda Indicator MT4?
The Hosoda Indicator MT4 is based on the famous Ichimoku Kinko Hyo trading system created by Japanese journalist Goichi Hosoda. Rather than acting as a single indicator, it combines several calculations into one complete market analysis tool.
Its main components include:
- Tenkan-sen (Conversion Line)
- Kijun-sen (Base Line)
- Senkou Span A
- Senkou Span B
- Chikou Span (Lagging Line)
- The Kumo, also known as the cloud
Each element serves a different purpose. Some measure short-term momentum, while others identify trend direction or future support and resistance.
Unlike many indicators that only react after a move begins, the Hosoda Indicator projects part of its analysis ahead of current price. This forward-looking cloud helps traders estimate where future barriers may develop.
Many swing traders prefer using it on the H1, H4, and Daily charts because trends are generally cleaner than on lower timeframes.
How the Hosoda Indicator Works
The calculation uses the highest highs and lowest lows over different lookback periods instead of traditional closing-price averages.
The default settings are:
- Tenkan-sen: 9 periods
- Kijun-sen: 26 periods
- Senkou Span B: 52 periods
Tenkan-sen reacts quickly to price movement, making it useful for spotting short-term momentum changes. Kijun-sen moves more slowly and often acts as dynamic support or resistance.
The cloud forms from Senkou Span A and Senkou Span B. When Span A stays above Span B, the cloud usually indicates bullish conditions. When Span A falls below Span B, bearish pressure often dominates.
For example, GBP/USD on the 4-hour chart may show:
- Price trading above the cloud
- Tenkan crossing above Kijun
- Chikou Span remaining above previous price action
When these signals align, buyers often have stronger momentum behind the trend than during isolated moving average crossovers.
Still, traders should remember that the cloud expands during volatile sessions and contracts during slower markets, changing the quality of trade setups.
Using the Hosoda Indicator in Real Trading
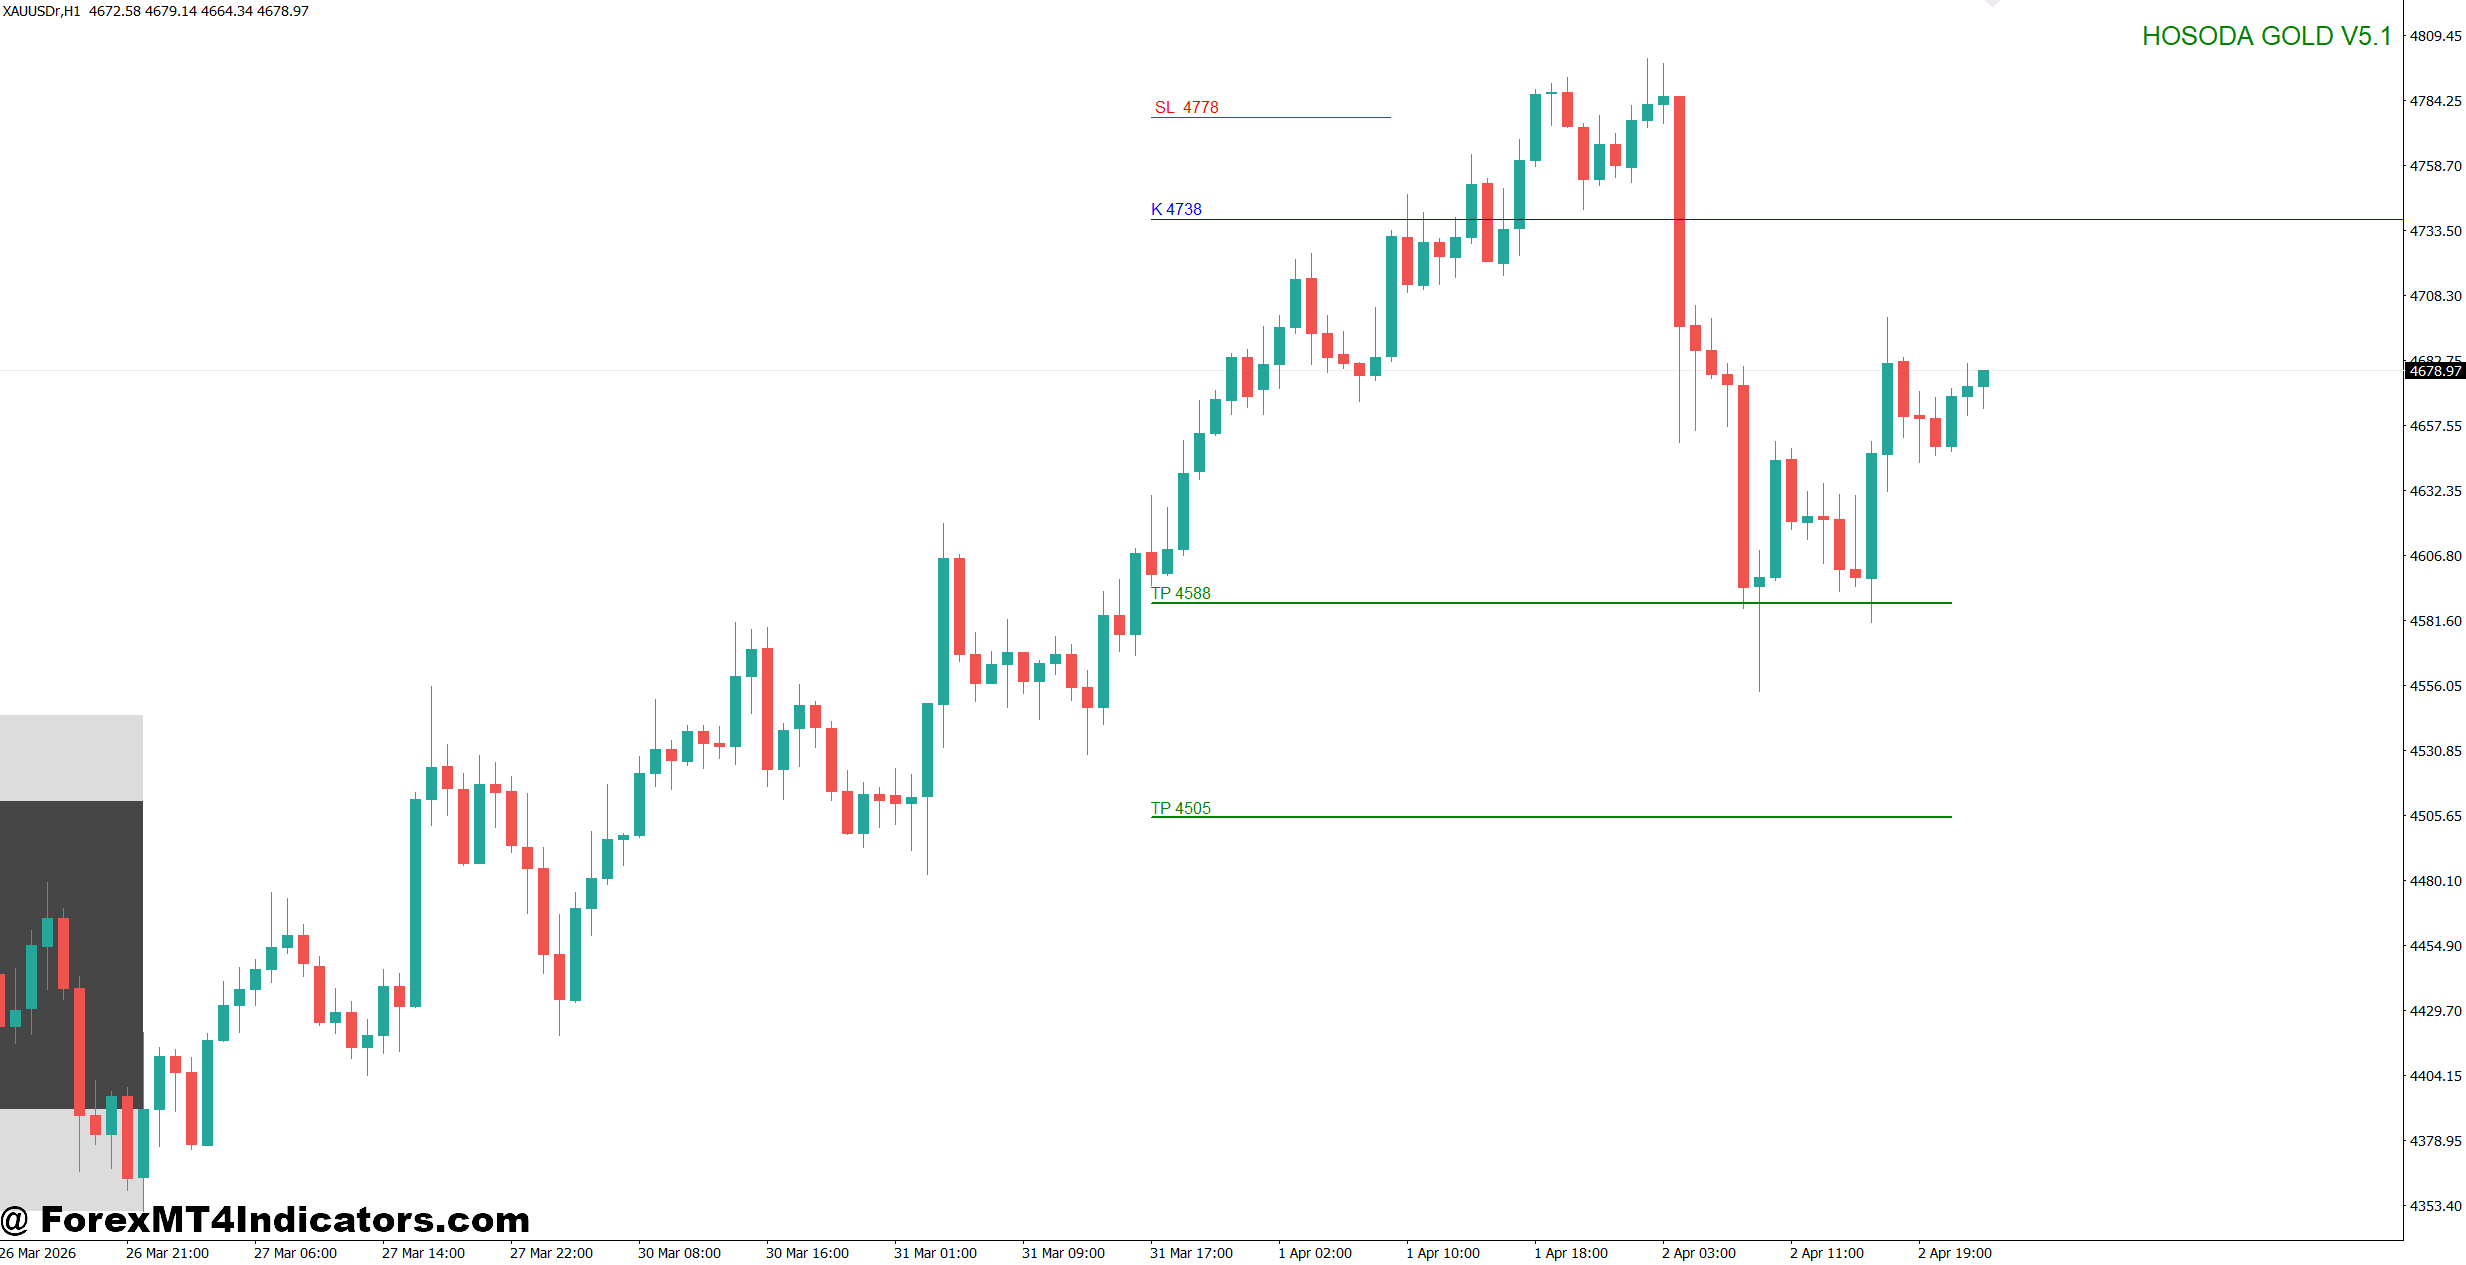
The indicator performs best when traders wait for confirmation instead of entering immediately after every crossover.
Consider EUR/USD on the 1-hour timeframe.
Price spends several hours below the cloud before breaking above it during the London session. Shortly afterward, Tenkan-sen crosses above Kijun-sen while the cloud ahead remains green. Instead of buying instantly, experienced traders often wait for a small pullback toward Kijun-sen.
Suppose the entry occurs at 1.0985 with a stop loss around 25 pips below recent support. The next resistance level sits roughly 65 pips higher, creating a favorable risk-to-reward ratio close to 1:2.5.
That extra confirmation often filters out fake-outs during volatile market conditions.
Another practical example appears on USD/JPY during a Daily trend. The market may remain above the cloud for several weeks. Rather than searching for reversal trades, traders simply wait for pullbacks toward Kijun-sen before looking for new buying opportunities.
When testing this on volatile NFP days, many traders notice that cloud breakouts become less reliable immediately after the news release because sudden price spikes can create temporary signals. Waiting 15 to 30 minutes after major economic announcements often reduces unnecessary entries.
Trading forex carries substantial risk. No indicator guarantees profits.
Best Settings, Customization, and Comparison
Default Settings
Most traders keep the standard 9-26-52 configuration because it has remained effective across many currency pairs.
These settings generally work well for:
- EUR/USD
- GBP/USD
- USD/JPY
- AUD/USD
Faster Trading
Scalpers sometimes experiment with settings like 7-22-44 on the M15 chart. The indicator reacts faster, but false signals increase noticeably during sideways markets.
Swing Trading
For H4 and Daily charts, the standard settings often produce smoother trend signals. Long-term traders usually combine the cloud with major support and resistance zones before entering.
Comparison With Moving Averages
A 50-period moving average identifies trend direction, but it provides limited information about future support or resistance.
The Hosoda Indicator offers:
- Dynamic trend analysis
- Momentum confirmation
- Future cloud projection
- Multiple confirmation signals within one system
Compared with Bollinger Bands, the Hosoda Indicator focuses more on trend continuation than volatility expansion. Against MACD, it provides clearer visual support and resistance while reducing dependence on histogram momentum alone.
That said, no indicator replaces market structure. Strong resistance levels, liquidity zones, and higher-timeframe trends should always remain part of the analysis.
Strengths
- Combines trend, momentum, and support resistance in one indicator.
- Helps traders avoid trading against strong trends.
- Works well during sustained market movement.
- Suitable for swing trading and position trading.
Limitations
- Generates delayed entries after major moves.
- Can produce whipsaw signals during ranging markets.
- Appears complicated for new traders because several lines overlap.
- Performs better when paired with price action instead of being used alone.
How to Trade with Hosoda Indicator MT4
Buy Entry
- Buy Above the Cloud – Enter when EUR/USD closes above the Kumo on the 1-hour chart with a 20-30 pip stop loss.
- Wait for Tenkan-Kijun Cross – Buy after the Tenkan-sen crosses above the Kijun-sen inside a strong uptrend.
- Confirm with Chikou Span – Take the trade only if the Chikou Span is above price from 26 periods ago.
- Trade Cloud Pullbacks – Buy after GBP/USD retraces to the Kijun-sen on the 4-hour chart and forms a bullish candle.
- Target 1:2 Risk-Reward – Risk 1% per trade and aim for at least 40-60 pips profit.
- Follow Higher Timeframe Trend – Use the Daily chart trend to confirm 1-hour buy setups.
- Avoid Thin Markets – Skip buy signals during low-volume Asian sessions or before major news releases.
- Trail Winning Trades – Move the stop loss to breakeven after 25-30 pips in profit.
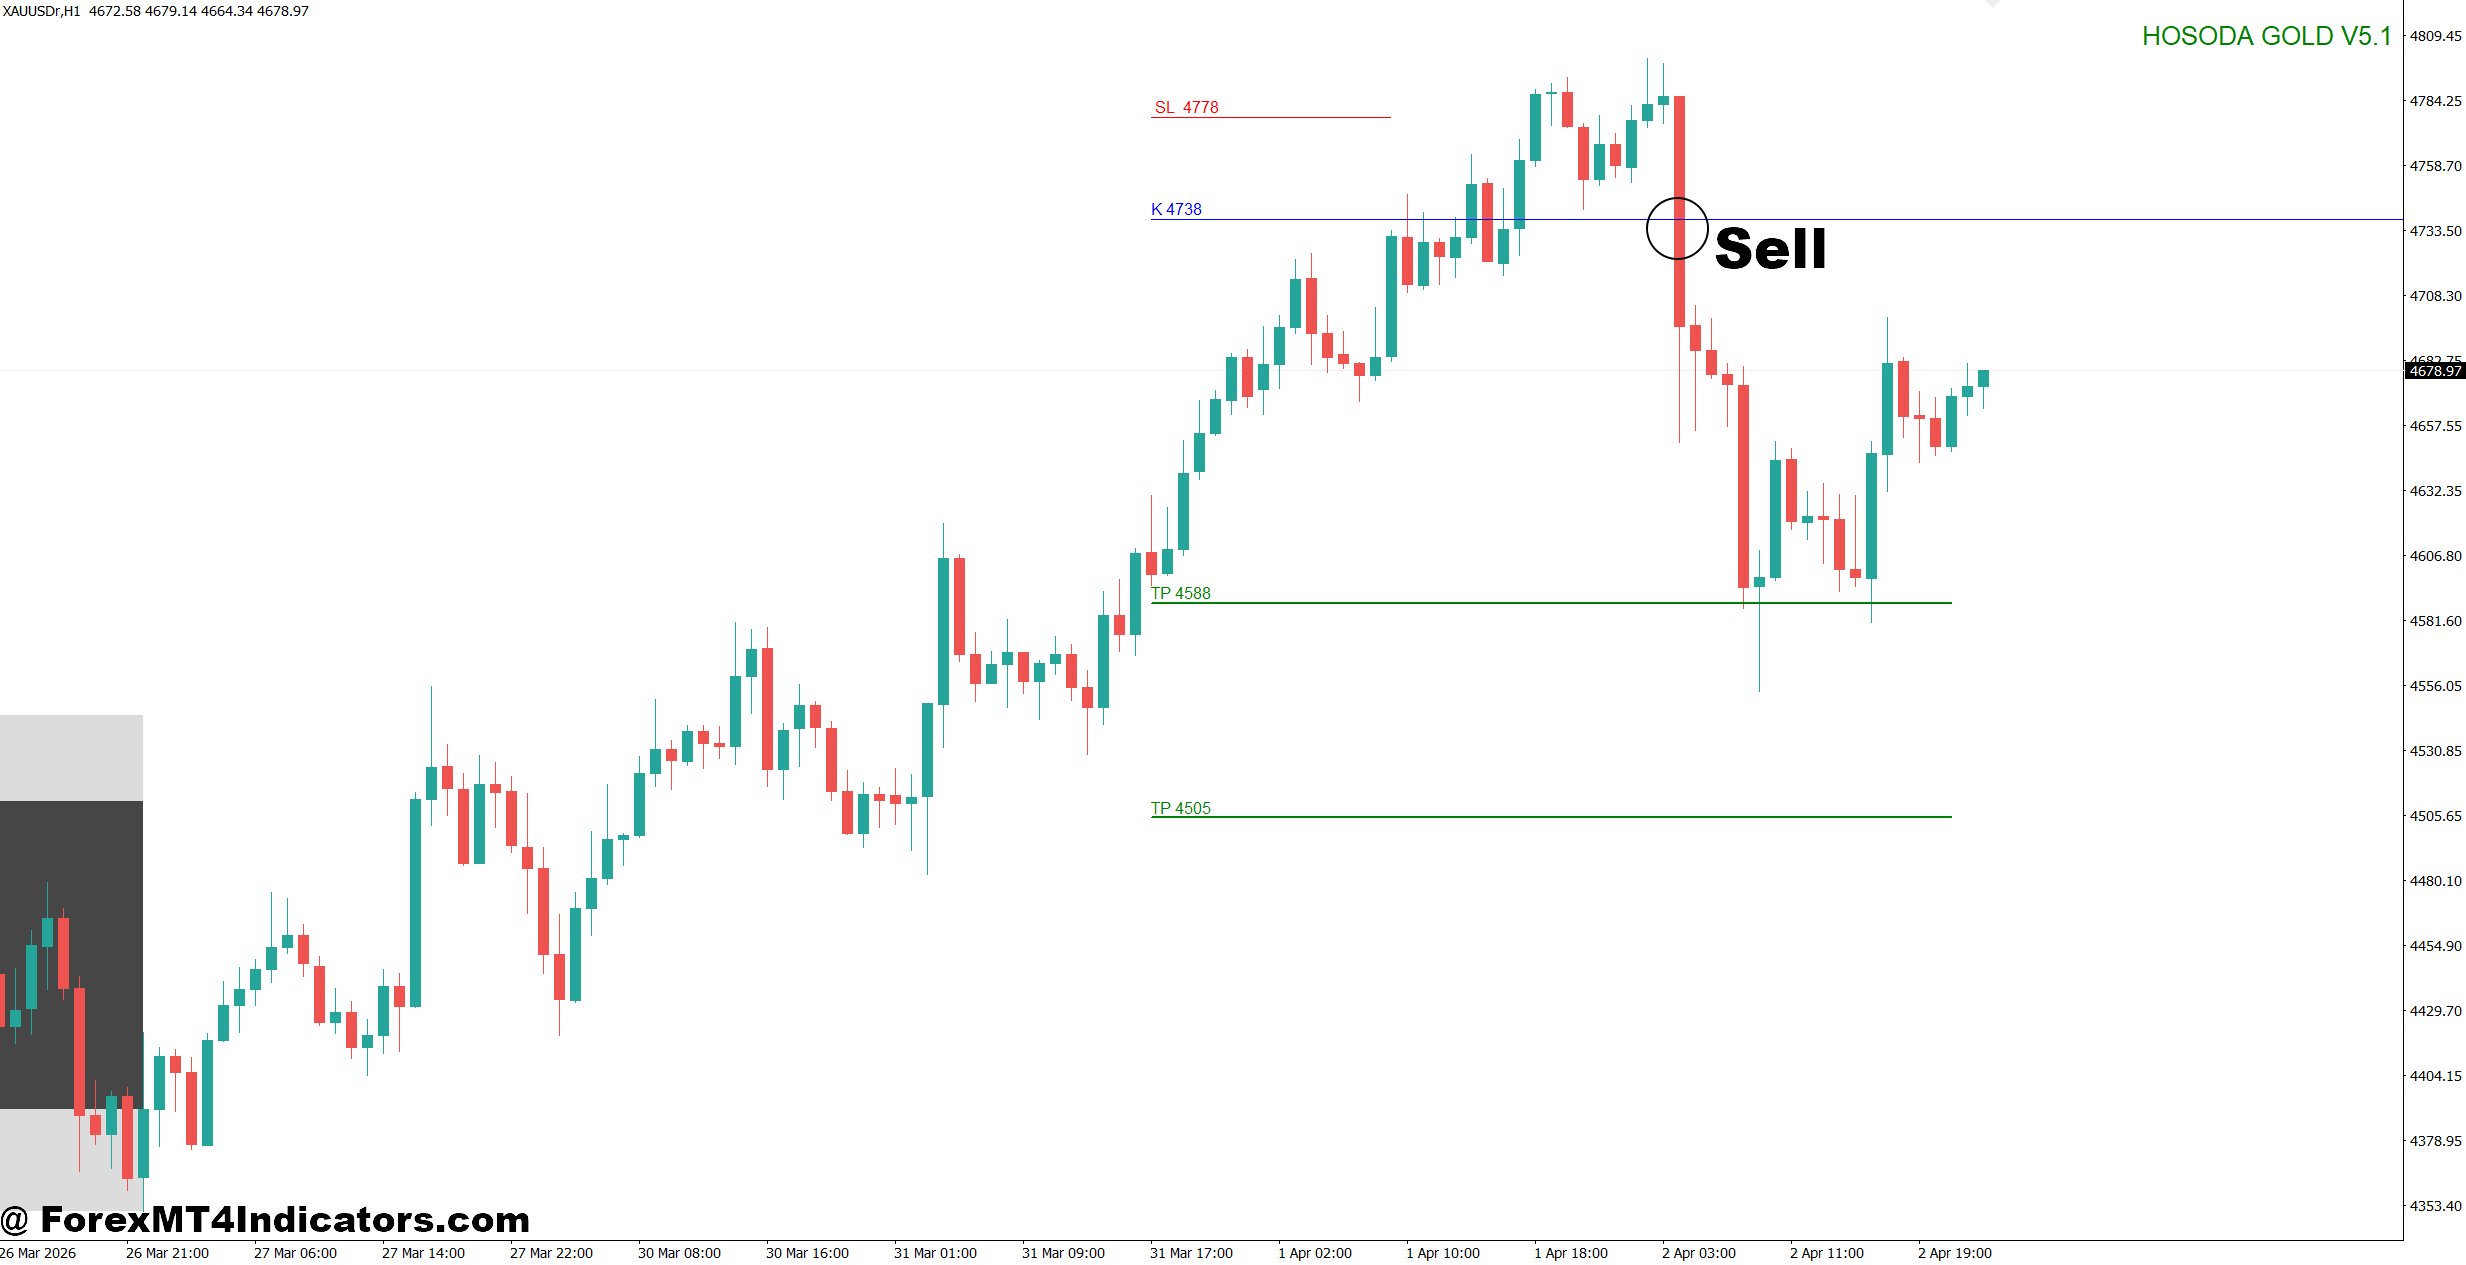
Sell Entry
- Sell Below the Cloud – Enter when GBP/USD closes below the Kumo on the 1-hour chart with a 20-30 pip stop loss.
- Wait for Bearish Cross – Sell after the Tenkan-sen crosses below the Kijun-sen during a downtrend.
- Check Chikou Confirmation – Enter only if the Chikou Span stays below price from 26 periods ago.
- Sell Pullbacks to Kijun – Wait for a pullback to the Kijun-sen on the 4-hour chart before selling.
- Aim for 1:2 Risk-Reward – Risk no more than 1% and target 50-70 pips when momentum is strong.
- Confirm Daily Trend – Take sell trades only when the Daily chart also shows a bearish cloud.
- Avoid Sideways Markets – Skip signals when price moves inside a flat cloud or ranges within 20 pips.
- Protect Open Profits – Lock in gains by trailing the stop after 25-30 pips of favorable movement.
Final Thoughts on the Hosoda Indicator MT4
The Hosoda Indicator MT4 gives traders much more than a simple buy or sell signal. It combines trend direction, momentum, and projected support and resistance into a single trading framework. The biggest strengths are its ability to keep traders aligned with the prevailing trend, filter weaker setups during trending markets, and provide multiple layers of confirmation before entry. At the same time, it struggles during sideways conditions and should never replace disciplined risk management or higher-timeframe analysis. Traders who practice on a demo account, test different currency pairs, and combine the indicator with solid price action often gain the most value from this technical analysis tool.
Level up your trading
Learn to read the chart — not just the indicator
eBook · Instant PDF
Video Course · 12 modules
Recommended MT4/MT5 Brokers
- ✓ *FREE *$50 to start (withdrawable)
- ✓ Deposit bonus up to $5,000
- ✓ Negative balance protection
Trading forex and CFDs carries a significant risk of loss and is not suitable for everyone. Broker links are affiliate links — we may earn a commission at no cost to you.
Free MT4 Indicator Download

Enter Your Email Address below, download link will be sent to you.