

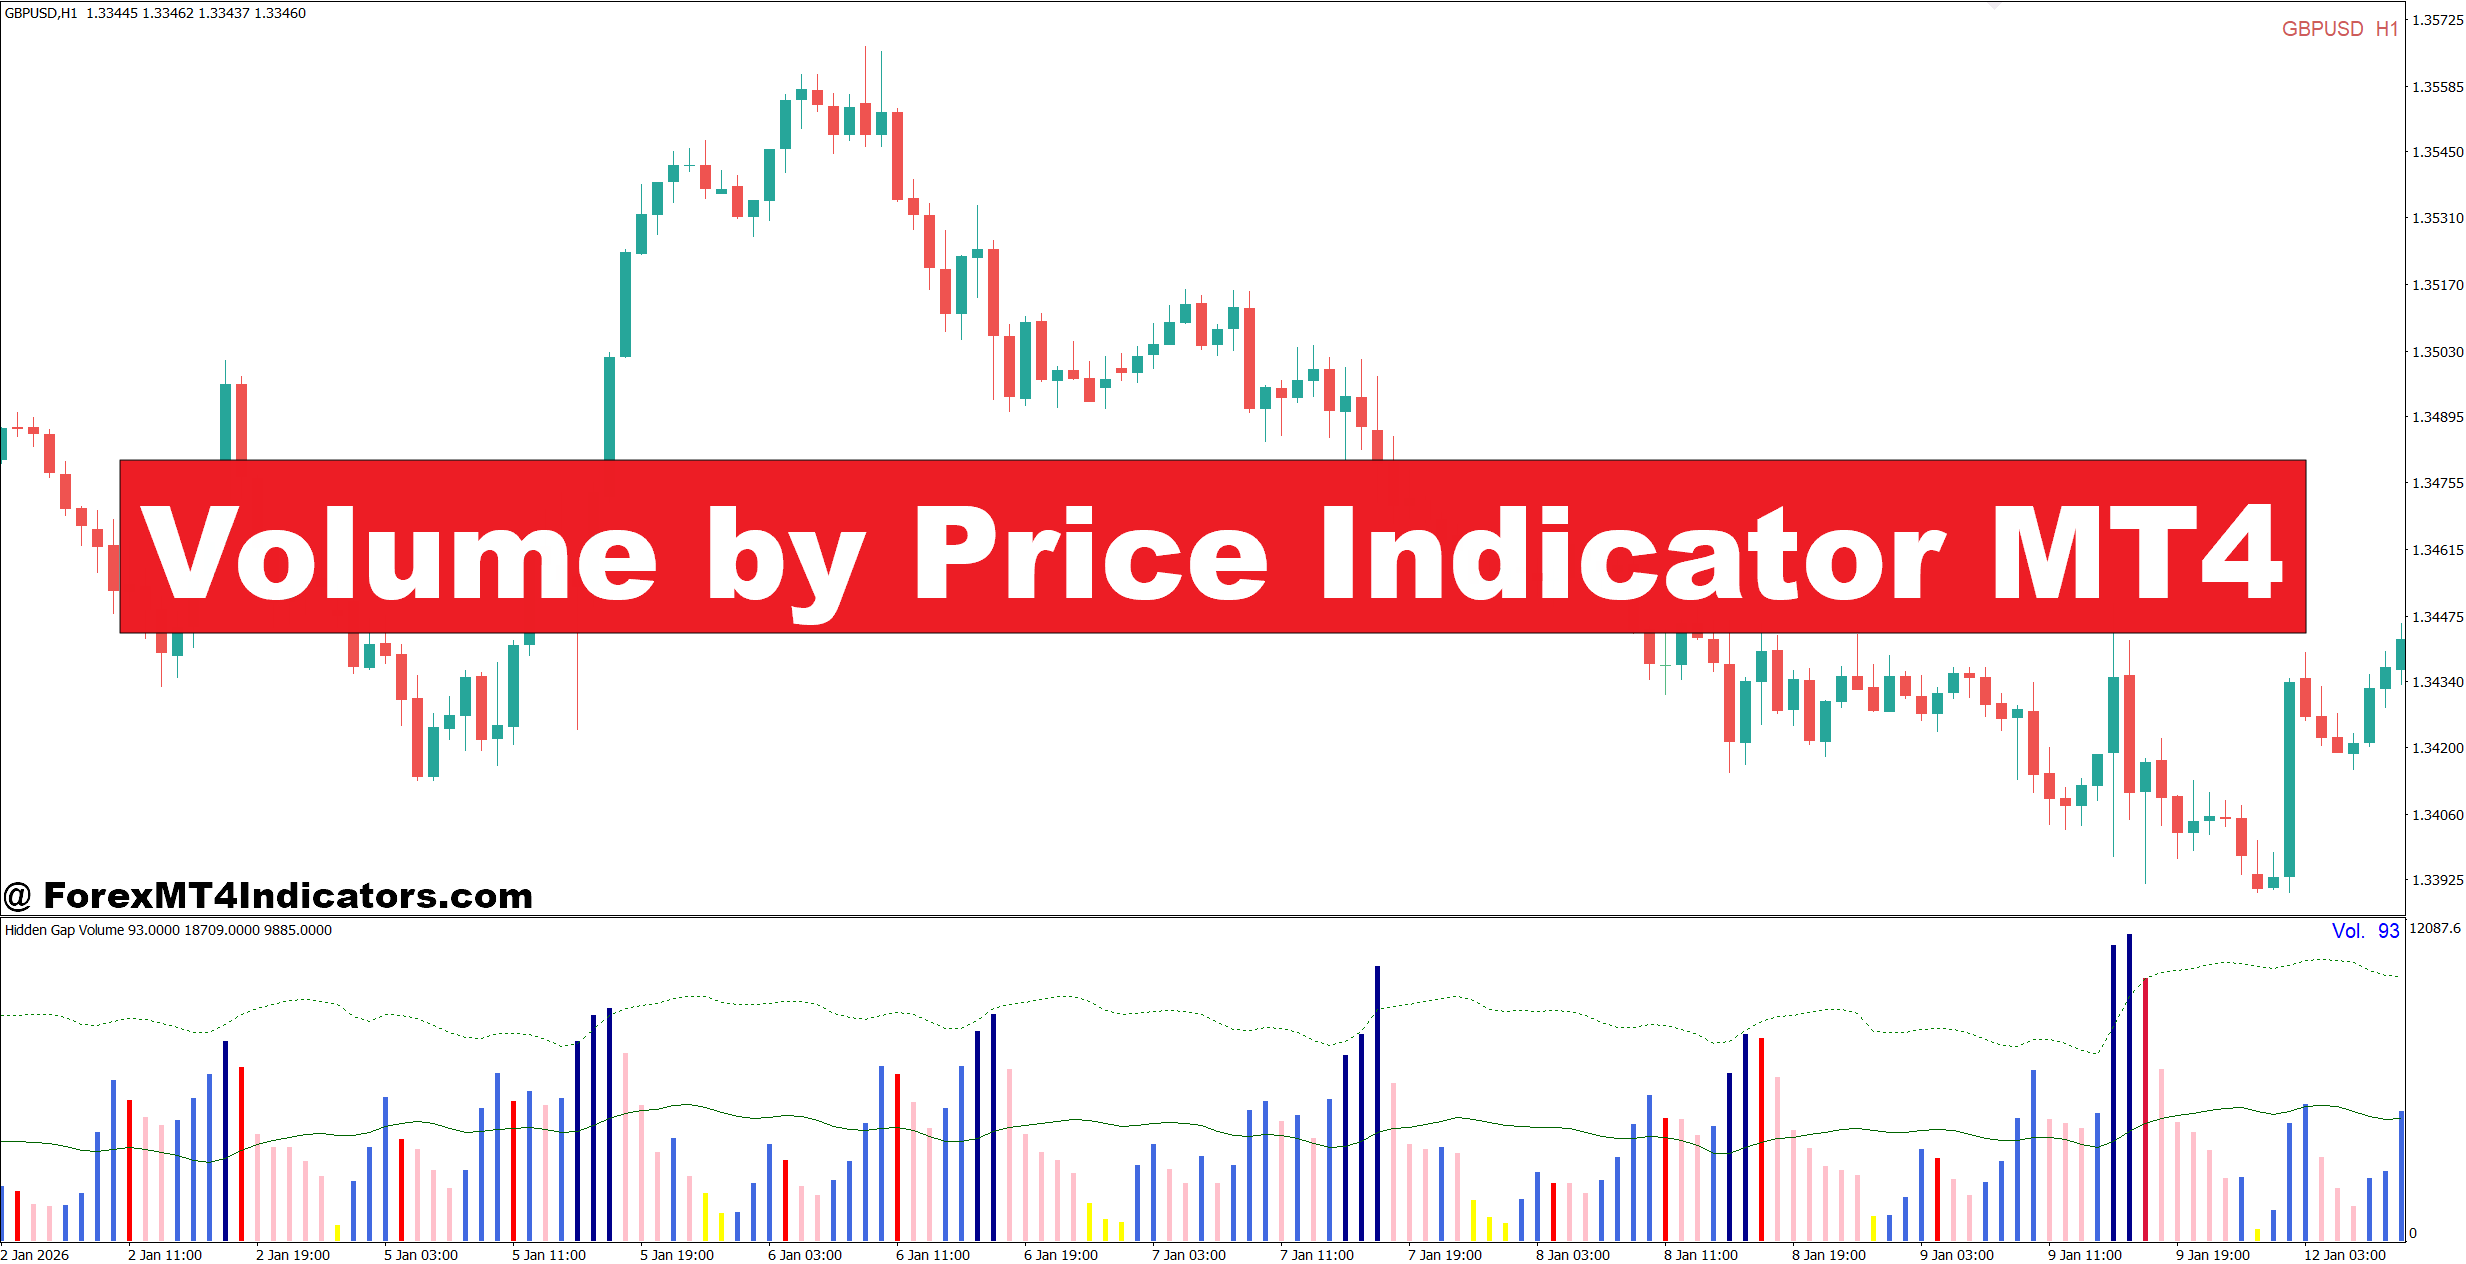
The Volume by Price Indicator MT4 helps traders see which price levels attracted the highest trading activity instead of focusing only on time. Those high-volume zones often act as support, resistance, or areas where large market participants became active. That gives traders another layer of confirmation before entering a position.
No tool can predict the future, but understanding where trading activity has been concentrated can improve decision-making. The sections below explain how the indicator works, where it performs best, and how traders can use it alongside other technical analysis methods.
What Is the Volume by Price Indicator MT4?
The Volume by Price Indicator MT4 is a technical analysis tool that displays trading volume across different price levels instead of plotting volume beneath each candle. Rather than asking, “How much volume happened during this hour?” it asks, “At which prices did the most trading occur?”
The indicator creates horizontal bars along the price axis. Longer bars represent price levels where more trading activity occurred, while shorter bars show areas with relatively little participation.
Although the forex market does not provide centralized exchange volume, MetaTrader 4 uses tick volume, which measures how many price changes occurred during a candle. While tick volume isn’t identical to institutional trading volume, many studies and trader experiences have shown a strong correlation between the two, especially on major currency pairs.
This makes the indicator useful for spotting potential support, resistance, and value areas that may influence future price movement.
How the Indicator Works
The indicator reviews historical price data over a selected lookback period. It divides the price range into multiple levels and counts how much tick volume occurred at each one.
For example, if EUR/USD traded between 1.0950 and 1.1050 during the previous five trading days, the indicator measures how much trading happened throughout that range. Suppose the largest concentration appears around 1.1005. That level becomes a high-volume area where buyers and sellers previously agreed on value.
On the other hand, price zones with very little volume often allow price to move quickly because fewer historical transactions occurred there.
Here’s the thing: high-volume areas usually slow the market down, while low-volume zones often create faster moves.
When testing this indicator during volatile Non-Farm Payroll (NFP) releases, many traders notice that price frequently returns to major high-volume levels after the initial spike. The first reaction can be chaotic, but volume-based support often becomes visible once volatility settles.
Using the Volume by Price Indicator MT4 in Real Trading
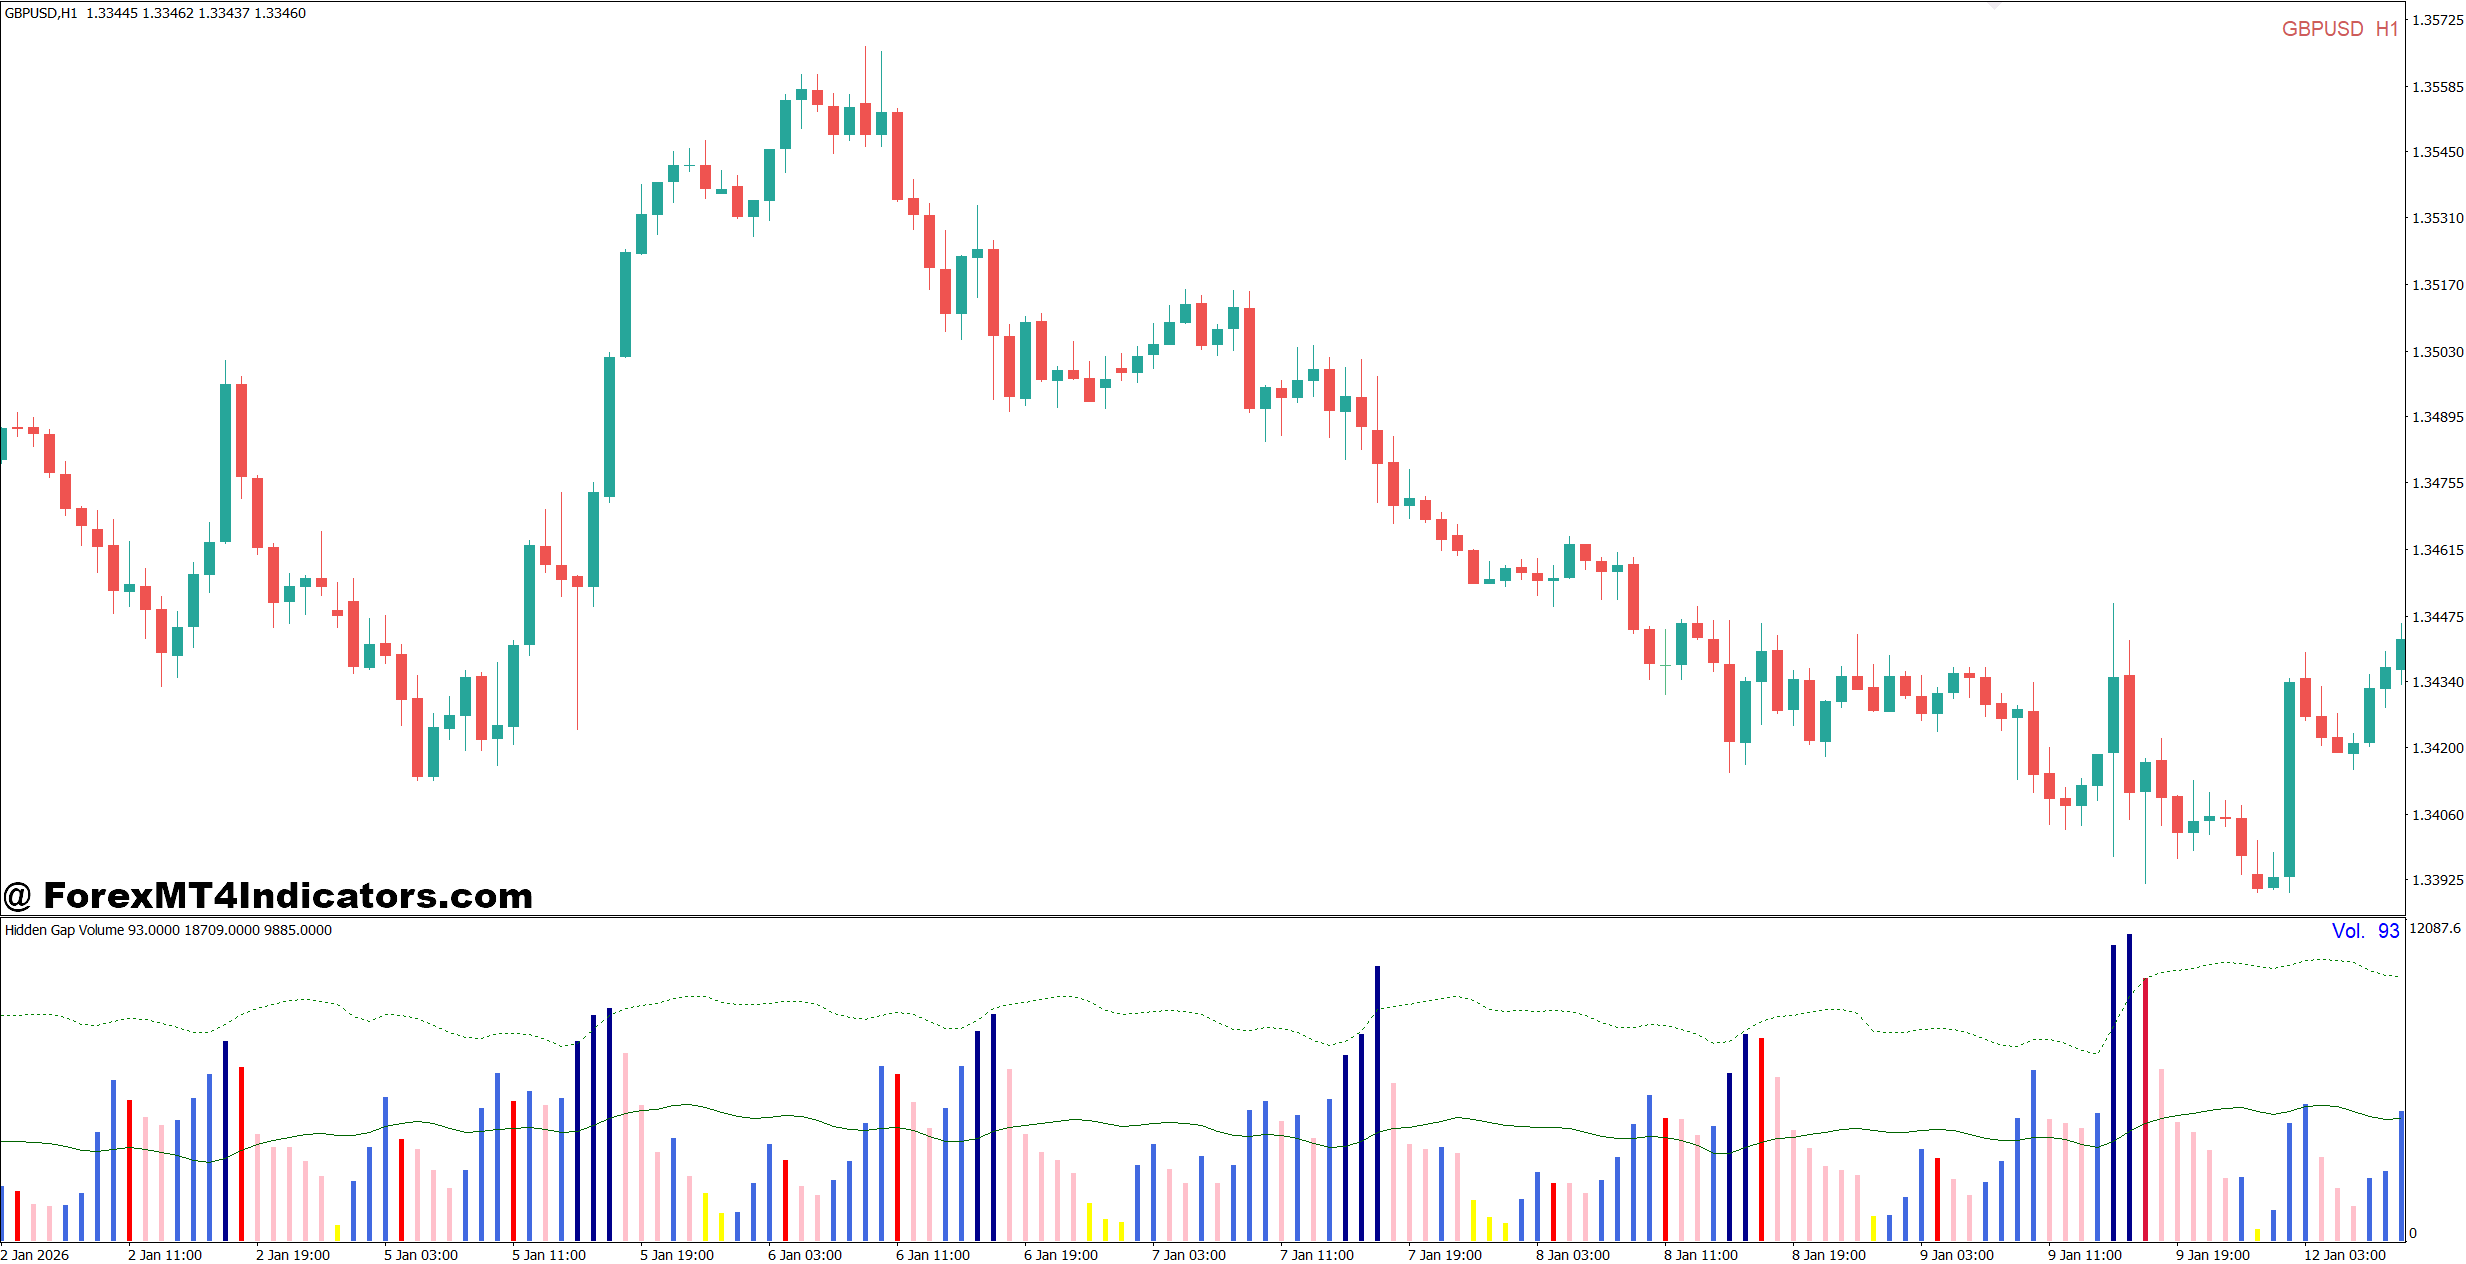
The indicator works best when traders combine it with market structure instead of treating it as a standalone entry signal.
Trading Support and Resistance
Suppose GBP/USD forms a strong bullish trend on the 4-hour chart. After climbing nearly 180 pips, price begins to retrace.
Instead of buying immediately, a trader notices a large volume cluster between 1.2760 and 1.2780. As price reaches that area, bullish rejection candles appear, followed by increasing momentum.
Rather than entering randomly, the trader now has three confirmations:
- An existing uptrend
- A historical high-volume support zone
- Bullish price action confirmation
That combination often produces higher-quality trade setups than relying on a moving average alone.
Confirming Breakouts
Volume by Price also helps filter fake-outs.
Imagine USD/JPY breaks above resistance at 148.40 on the 1-hour chart. If the breakout occurs into a low-volume area, price may continue moving quickly because little historical trading exists overhead.
If a large volume cluster sits immediately above the breakout, price could struggle as previous buyers and sellers become active again.
This simple observation can prevent chasing weak breakouts.
Finding Profit Targets
Some traders also use volume clusters to plan exits.
For example, if a buy trade begins at 1.1020 on EUR/USD, and the next major high-volume area sits near 1.1090, that level becomes a logical place to secure partial profits instead of guessing where the trend might end.
Trading forex carries substantial risk. No indicator guarantees profits, and every setup should include proper stop-loss management.
Best Settings and Customization
The default settings work well for many traders, but small adjustments can improve performance depending on the trading style.
For scalping on the M5 or M15 charts, many traders reduce the lookback period to around 100-150 candles. This keeps the displayed volume zones focused on recent market activity.
Swing traders using the 4-hour or Daily chart often expand the lookback period to 300-500 candles. Larger datasets reveal stronger institutional trading areas that remain relevant over longer periods.
Major currency pairs such as EUR/USD, GBP/USD, USD/JPY, and AUD/USD usually produce cleaner volume profiles because they generate more consistent liquidity than many exotic pairs.
One practical tip from chart testing: avoid making trading decisions when several volume clusters overlap within a narrow range. That usually signals market balance, where price can move sideways before choosing a clear direction.
Strengths, Weaknesses, and Comparison with Other Indicators
One of the biggest advantages of the Volume by Price Indicator MT4 is its ability to show where market participation actually occurred. Many indicators react only to price movement, but this tool highlights areas where buyers and sellers previously agreed on value.
It also works well with trendlines, Fibonacci retracements, moving averages, and candlestick analysis. When multiple forms of confirmation point toward the same level, trade quality often improves.
Still, traders should understand its limitations.
Since forex uses tick volume rather than centralized exchange volume, readings can vary slightly between brokers. The indicator also performs less effectively during extremely quiet market sessions, where limited trading activity produces weaker volume profiles.
Compared with the Volume Indicator, Volume by Price provides much better location analysis because it connects volume directly to price levels instead of individual candles.
Against the Market Profile, Volume by Price is generally simpler to understand. Market Profile includes time-based concepts such as the Point of Control and Value Area, while Volume by Price focuses mainly on where trading activity accumulated.
Compared with moving averages, the indicator does not identify trend direction by itself. Instead, it helps traders determine whether important price levels deserve attention before entering or exiting a trade.
That balanced role makes it an excellent confirmation tool rather than a complete trading system.
How to Trade with Volume by Price Indicator MT4
Buy Entry
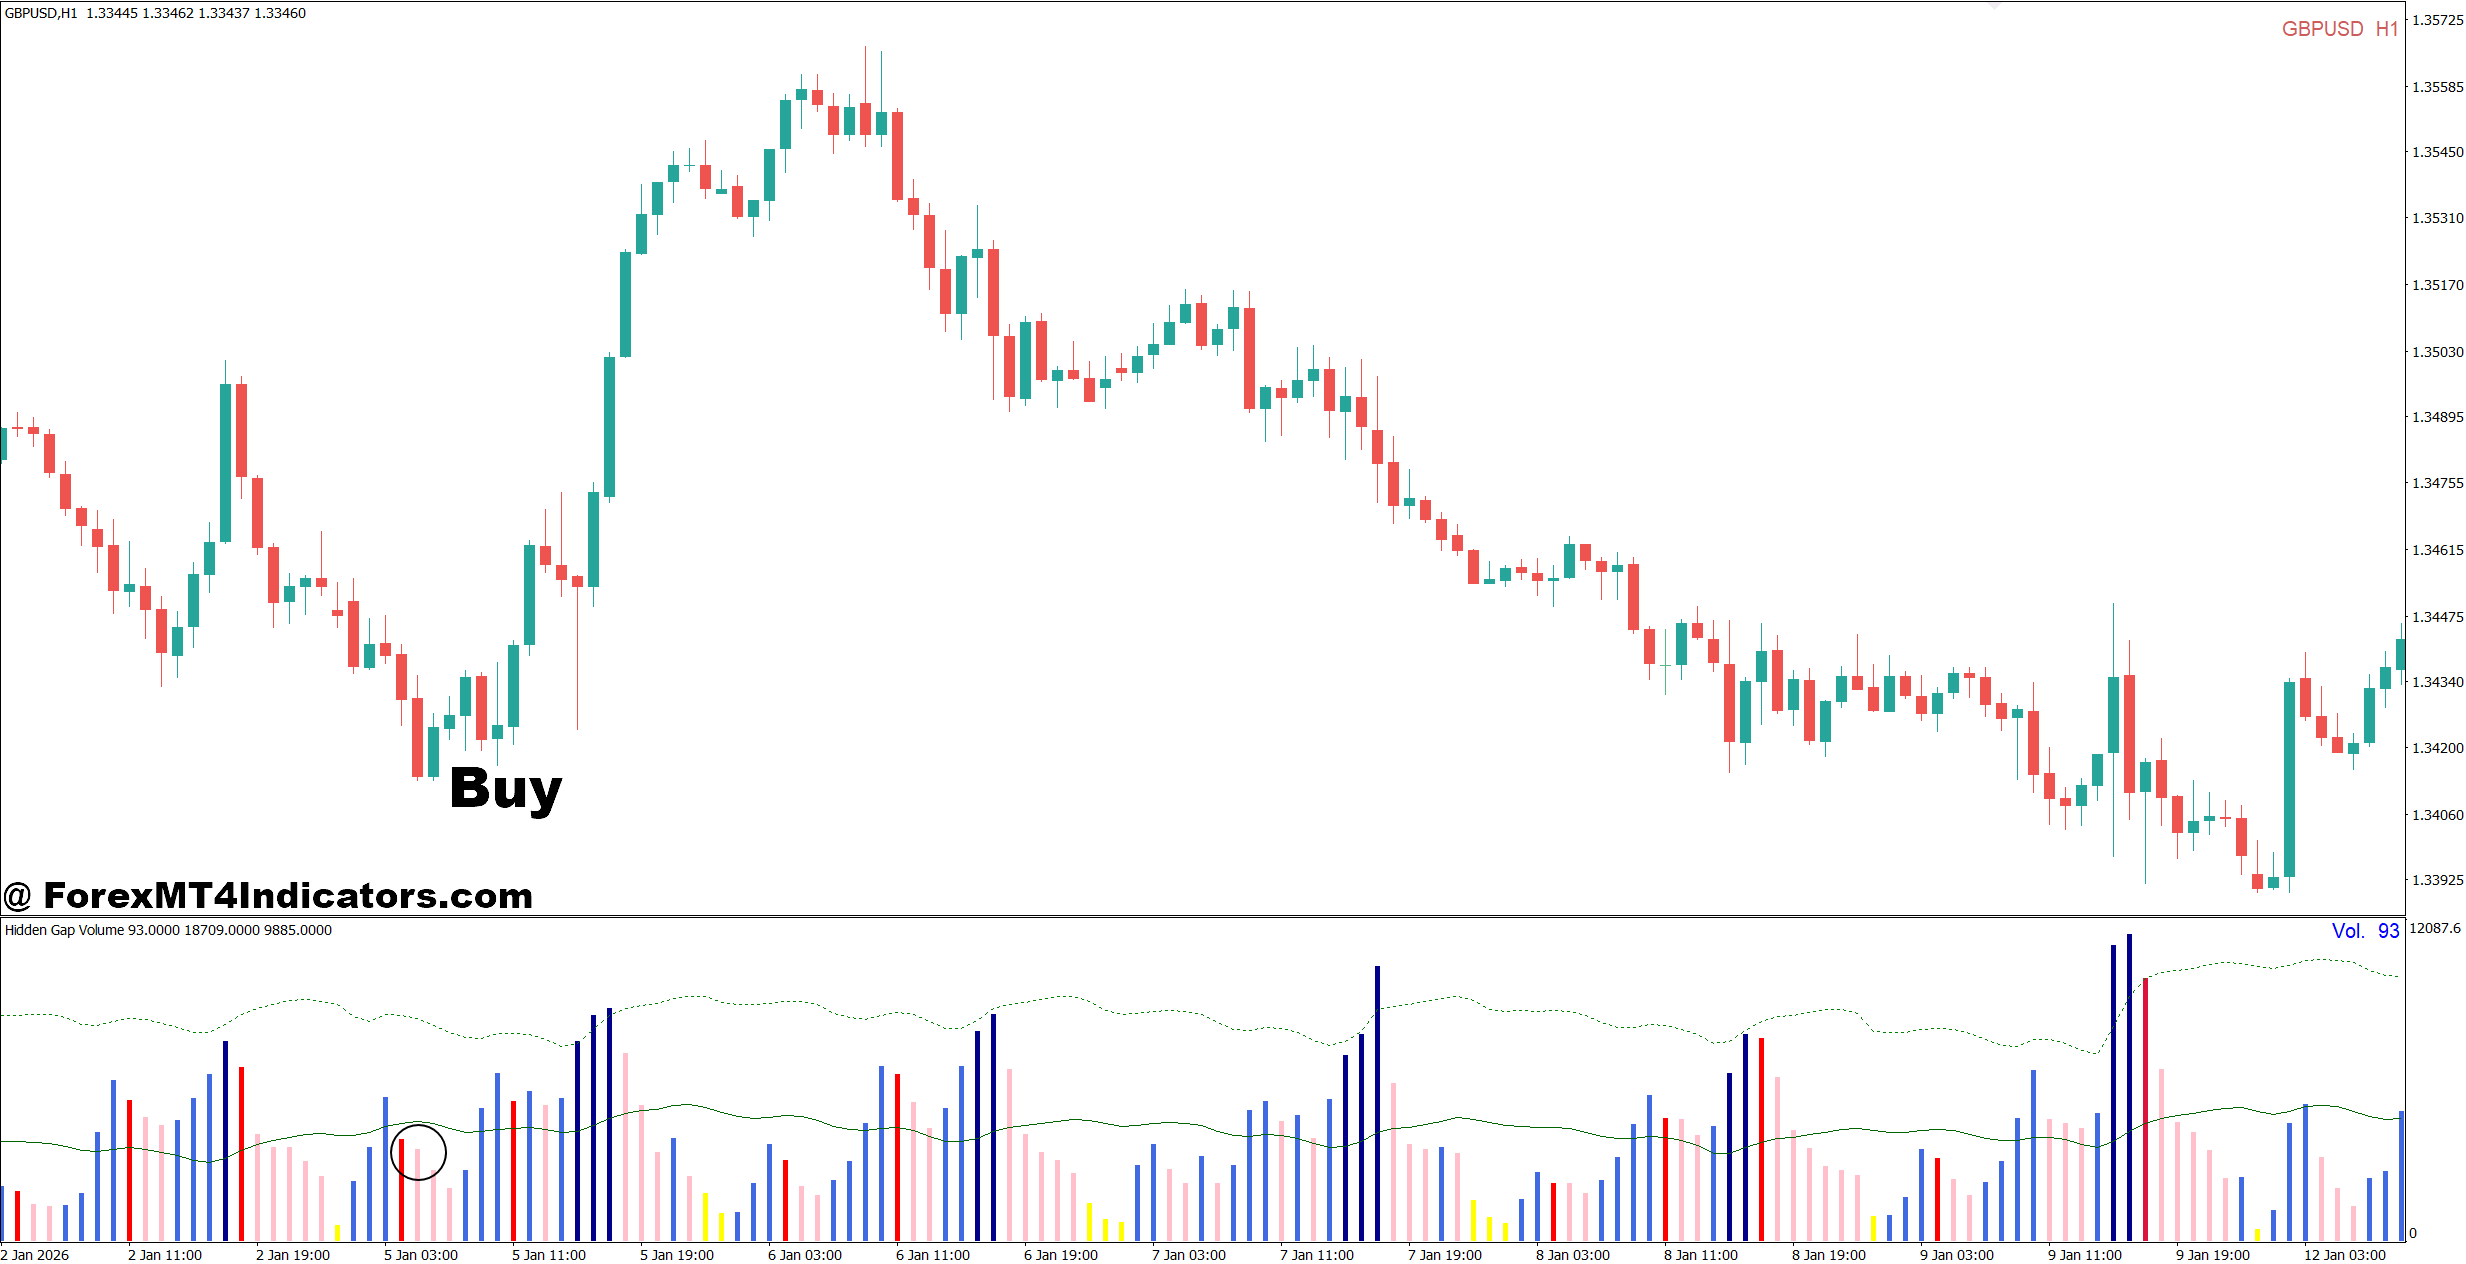
- Buy at High-Volume Support – Enter when EUR/USD bounces from a high-volume zone on the 1-hour chart with a 20-30 pip stop-loss.
- Confirm Bullish Candles – Wait for a bullish engulfing or pin bar before buying to avoid fake-outs.
- Trade with the Trend – Take buy trades only when the 4-hour trend is bullish and price respects a volume support area.
- Target Low-Risk Entries – Aim for a 1:2 risk-to-reward ratio with a 40-60 pip profit target.
- Use Volume with Moving Average – Buy only if price stays above the 50 EMA and reacts to a high-volume level.
- Watch London Session – Look for buy setups during the London session when liquidity is higher.
- Avoid Weak Markets – Skip buy signals if GBP/USD is moving sideways in a 15-pip range.
- Protect Profits – Move the stop-loss to breakeven after 25-30 pips in profit.
Sell Entry
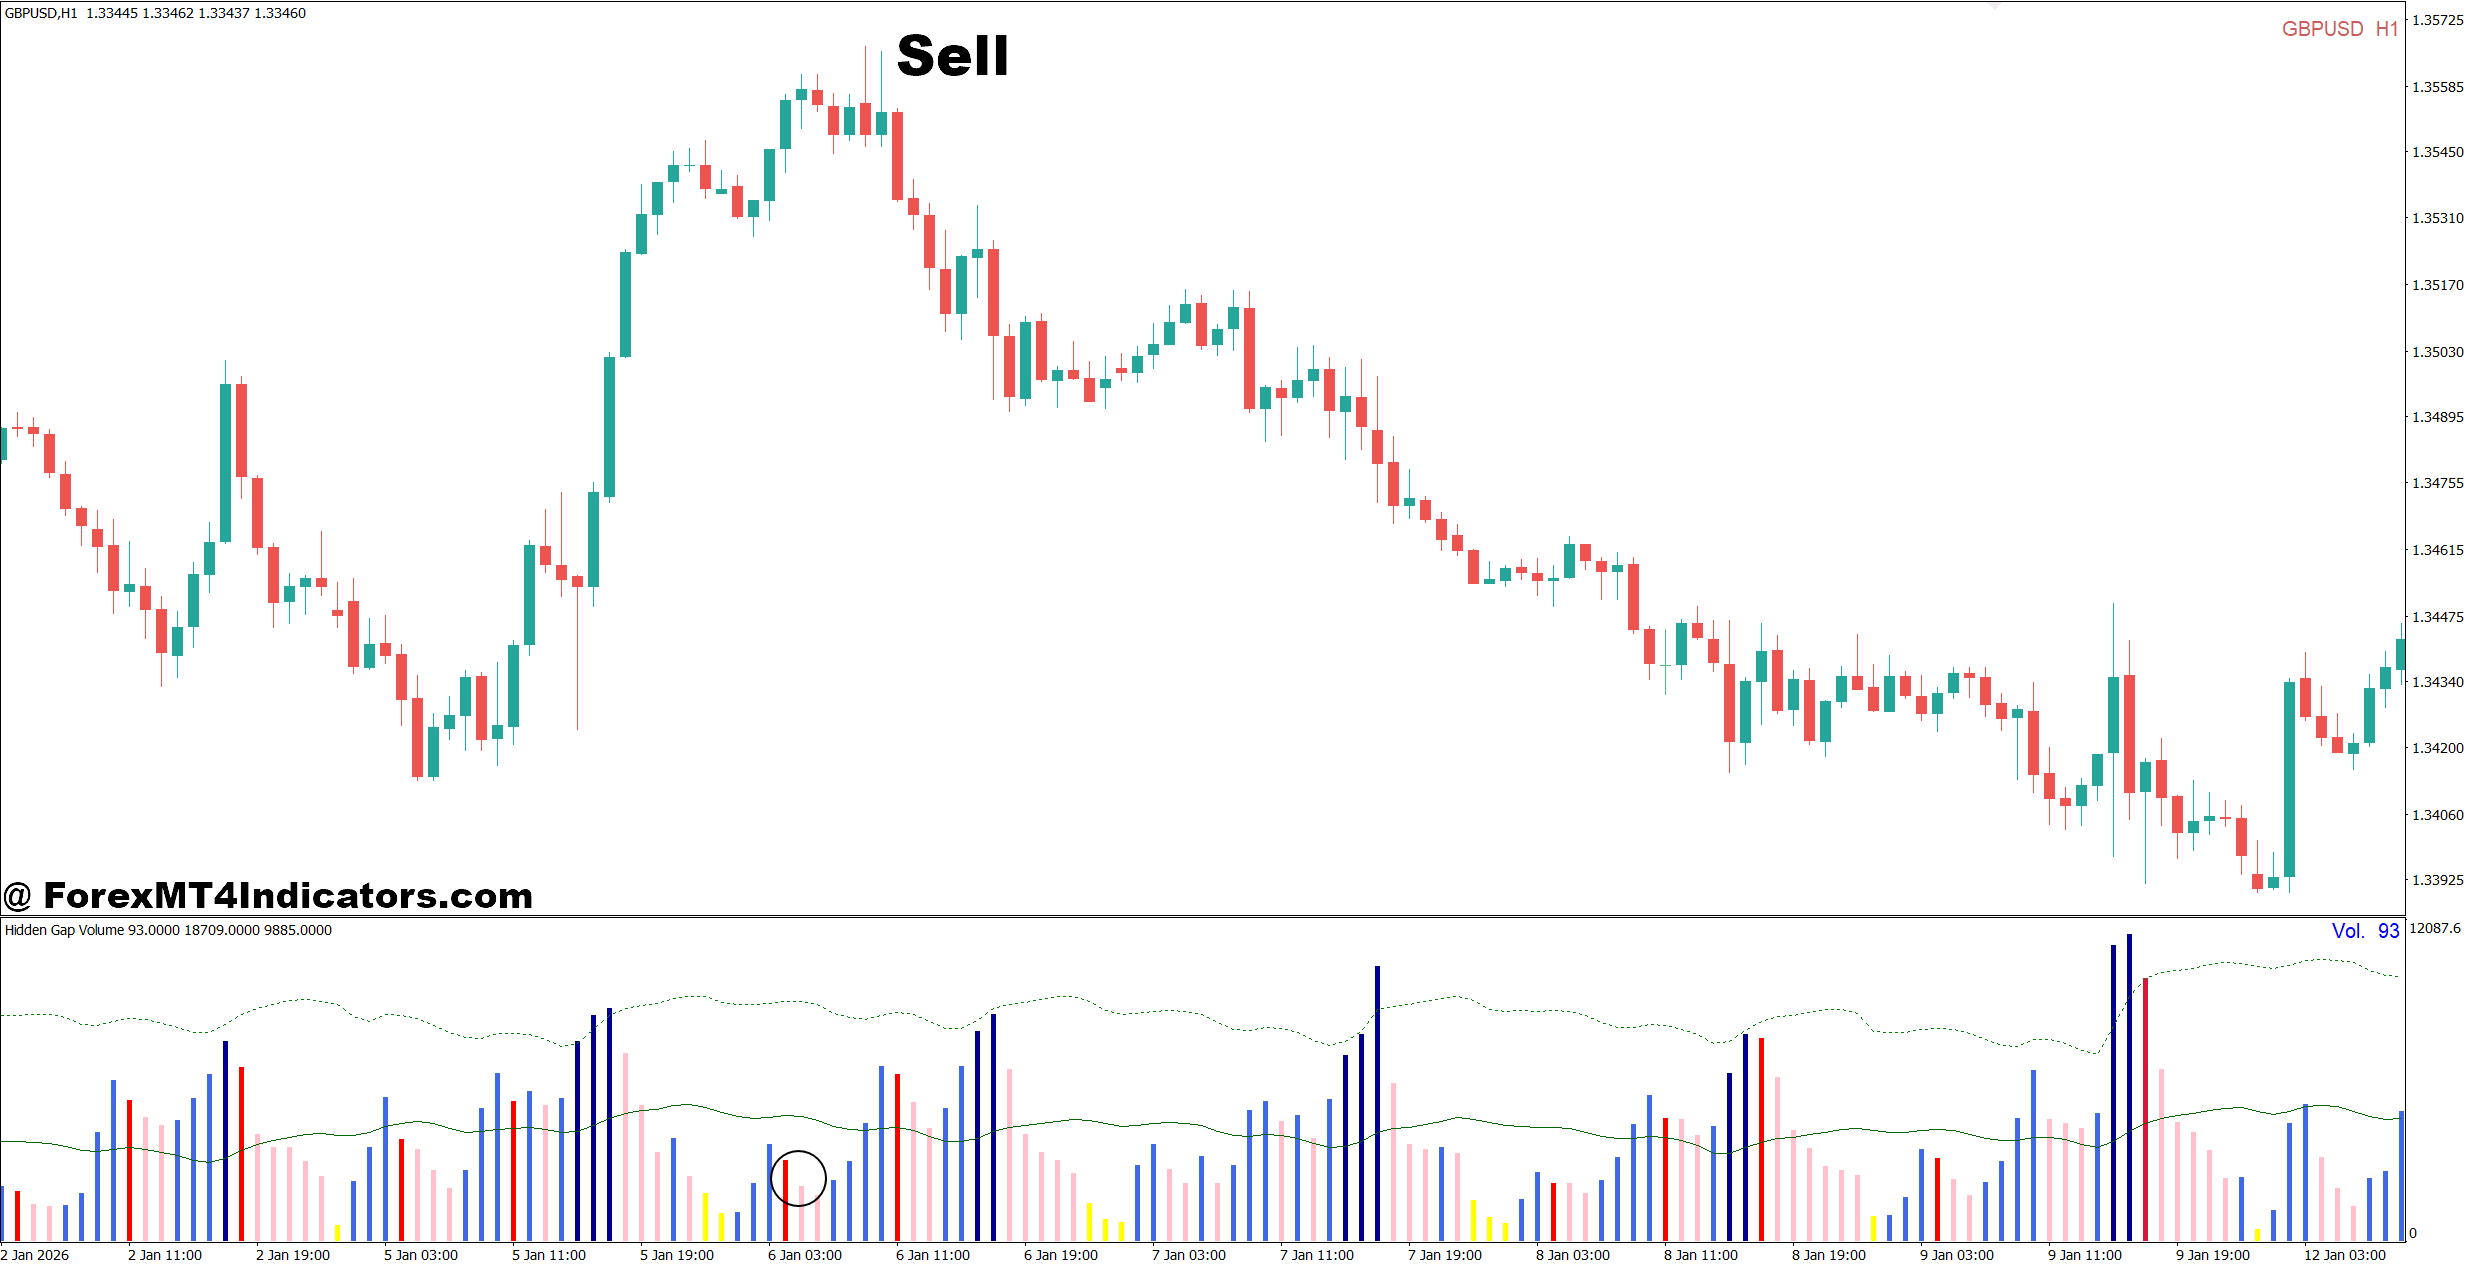
- Sell at High-Volume Resistance – Enter when GBP/USD rejects a high-volume resistance zone on the 1-hour chart with a 20-30 pip stop-loss.
- Wait for Bearish Confirmation – Sell only after a bearish engulfing or shooting star forms at resistance.
- Follow the Downtrend – Take sell trades only when the 4-hour trend remains bearish.
- Use Fixed Risk – Risk no more than 1-2% of account balance on a single trade.
- Confirm with 50 EMA – Sell when price stays below the 50 EMA and rejects a volume resistance area.
- Set Realistic Targets – Aim for 40-80 pips or the next high-volume support zone.
- Avoid High-Impact News – Don’t enter sell trades just before major events like NFP or FOMC announcements.
- Exit on Strong Reversal – Close the trade early if a strong bullish candle forms from a high-volume support level on the daily or 4-hour chart.
The Volume by Price Indicator MT4 gives traders a different way to study the market by showing where the greatest trading activity occurred instead of focusing only on candle patterns. Its biggest strengths include identifying meaningful support and resistance zones, confirming breakout quality, and helping traders choose realistic profit targets. At the same time, it works best when combined with trend analysis, price action, and sound risk management rather than used alone. Since no indicator eliminates risk, careful testing on a demo account remains a smart first step before using real money. Traders who learn how volume interacts with market structure often gain a clearer view of where high-probability opportunities may develop.
Level up your trading
Learn to read the chart — not just the indicator
eBook · Instant PDF
Video Course · 12 modules
Recommended MT4/MT5 Brokers
- ✓ *FREE *$50 to start (withdrawable)
- ✓ Deposit bonus up to $5,000
- ✓ Negative balance protection
Trading forex and CFDs carries a significant risk of loss and is not suitable for everyone. Broker links are affiliate links — we may earn a commission at no cost to you.
Free MT4 Indicator Download

Enter Your Email Address below, download link will be sent to you.