


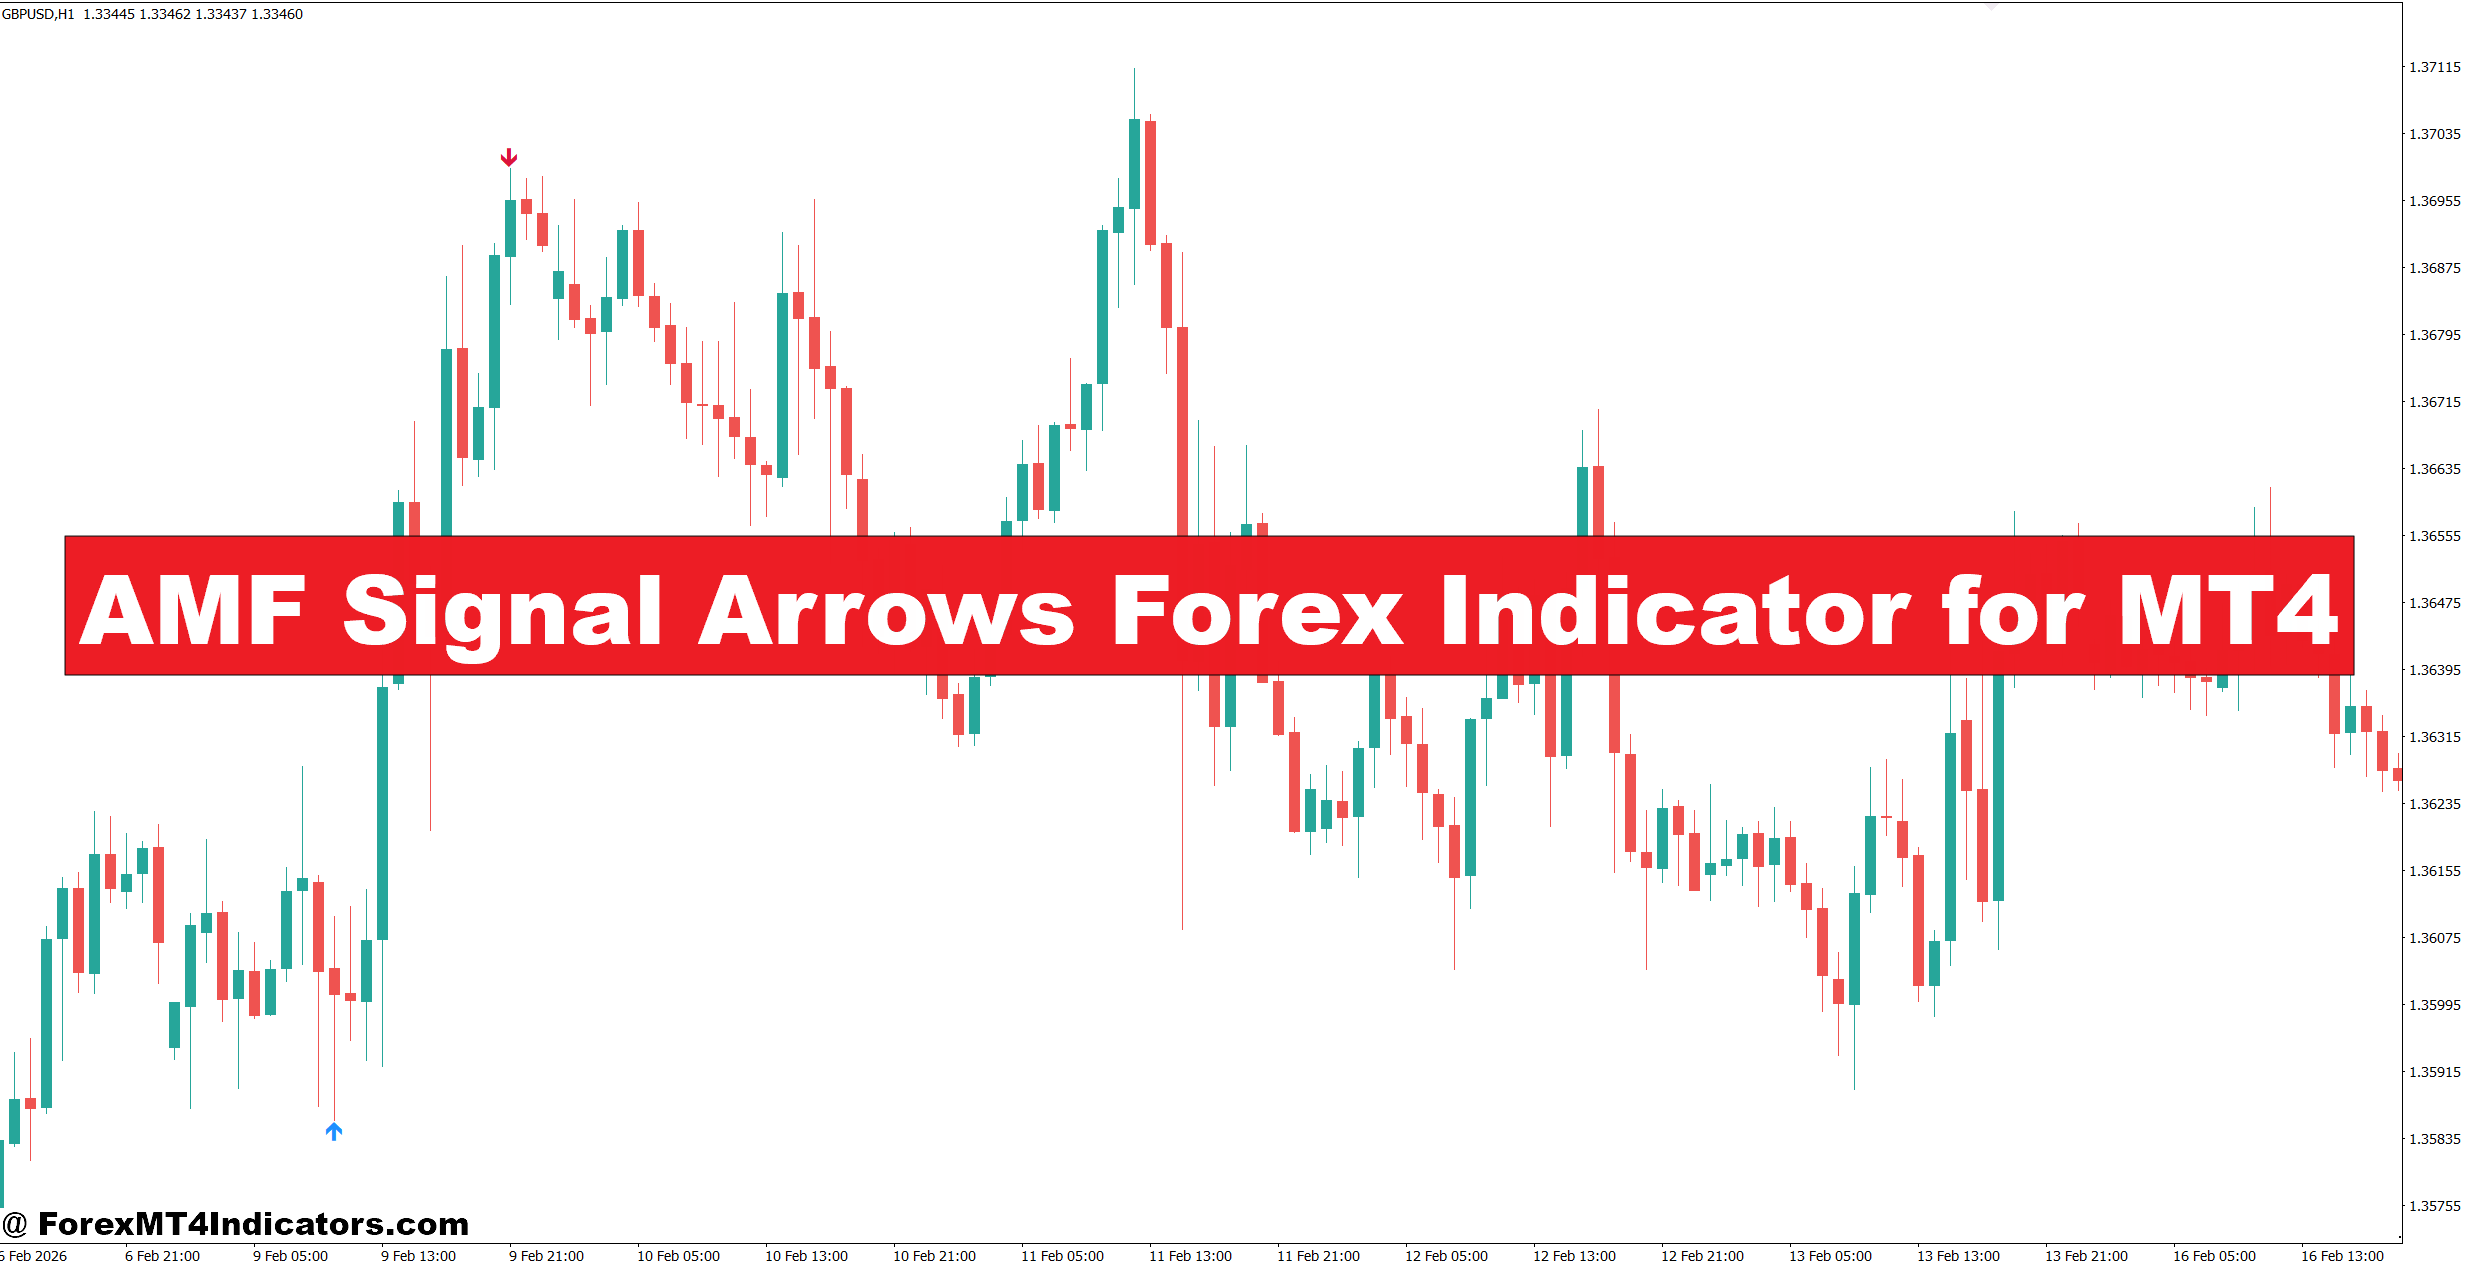
The AMF Signal Arrows Forex Indicator for MT4 aims to make that timing problem easier. Instead of asking traders to judge every candle from scratch, it places directional arrows on the chart when its internal conditions point toward a possible bullish or bearish move. That can reduce hesitation, but it doesn’t remove false signals. A few bad entries during a choppy session can still create a painful drawdown.
The useful part comes from combining the arrows with price structure, support and resistance, and a sensible stop-loss. Here’s how the indicator works, where it fits best, and how traders can use it without treating every arrow as a trade command.
What Is the AMF Signal Arrows Forex Indicator?
The AMF Signal Arrows Forex Indicator is an MT4 technical analysis tool designed to highlight potential buy and sell opportunities directly on the price chart. It normally displays an upward arrow for a possible bullish setup and a downward arrow for a possible bearish setup.
The exact calculation can vary between AMF Signal Arrows versions because many MT4 indicators are distributed as customized EX4 files. Traders should therefore check the specific version’s inputs before assuming it uses a fixed formula.
In practical terms, arrow-based indicators generally process price data such as open, high, low, and close values and apply trend, momentum, volatility, or smoothing conditions before producing a signal. Some versions may also use moving-average relationships or price filters to reduce minor market noise.
That distinction matters. An arrow is a calculated condition, not proof that price will continue moving in the same direction.
How the Signals Fit Market Structure
Suppose EUR/USD is trading around 1.0850 on the 1-hour chart. Price has already broken above resistance near 1.0835 and then returns to test that area. If a bullish arrow appears around 1.0840 while the previous resistance now acts as support, the signal has more context.
The same arrow would deserve less attention if EUR/USD were moving sideways between 1.0820 and 1.0860. In that situation, repeated arrows can appear during short-term swings. That’s classic whipsaw behavior.
How Traders Can Use the Indicator in Real Markets
The strongest approach is to treat the AMF arrows as an entry-timing tool rather than a complete trading system.
For example, a trader watching GBP/USD on the 1-hour chart may first mark resistance at 1.2740. Price closes above that level and reaches 1.2765. Instead of buying the breakout immediately, the trader waits for a pullback. If price holds around 1.2740 and a bullish arrow appears, an entry near 1.2750 could offer a cleaner setup.
A 20-pip stop below the recent swing low would put the risk around 1.2730. If the next resistance zone sits near 1.2790, the potential reward would be about 40 pips. That creates roughly a 1:2 risk-to-reward ratio.
Another useful test involves trend alignment. On a strong EUR/USD 4-hour uptrend, a bullish arrow on the 15-minute chart after a pullback may have more value than a bearish arrow against the larger trend. The lower timeframe can help with timing, while the higher timeframe supplies direction.
When testing arrow indicators during volatile NFP sessions, traders should be more cautious. A 30-pip candle can trigger a signal and reverse within minutes. Waiting for the candle to close and checking the spread can prevent some poor entries.
Settings and Timeframe Adjustments
There is no single setting that works equally well for every pair. Traders should test the available parameters on historical data and then forward-test them on a demo account.
On the 5-minute and 15-minute charts, faster settings can produce more signals, but they may also create more noise. This can be useful for scalpers, although transaction costs and spreads become much more significant.
For the 1-hour chart, moderate settings often provide a better balance between signal frequency and market noise. A trader might focus on EUR/USD, GBP/USD, or USD/JPY and require at least 15–25 pips of room before the next major support or resistance zone.
On the 4-hour chart, fewer signals may appear, but each setup can capture a larger price move. Stops may need to be wider, such as 40–80 pips, depending on the pair’s recent volatility.
The key is not to keep changing settings after every losing trade. That creates overfitting. A configuration that performs well over 100 historical examples deserves more attention than one that looks perfect over the last 15 trades.
Strengths, Limitations, and Comparison With Other Indicators
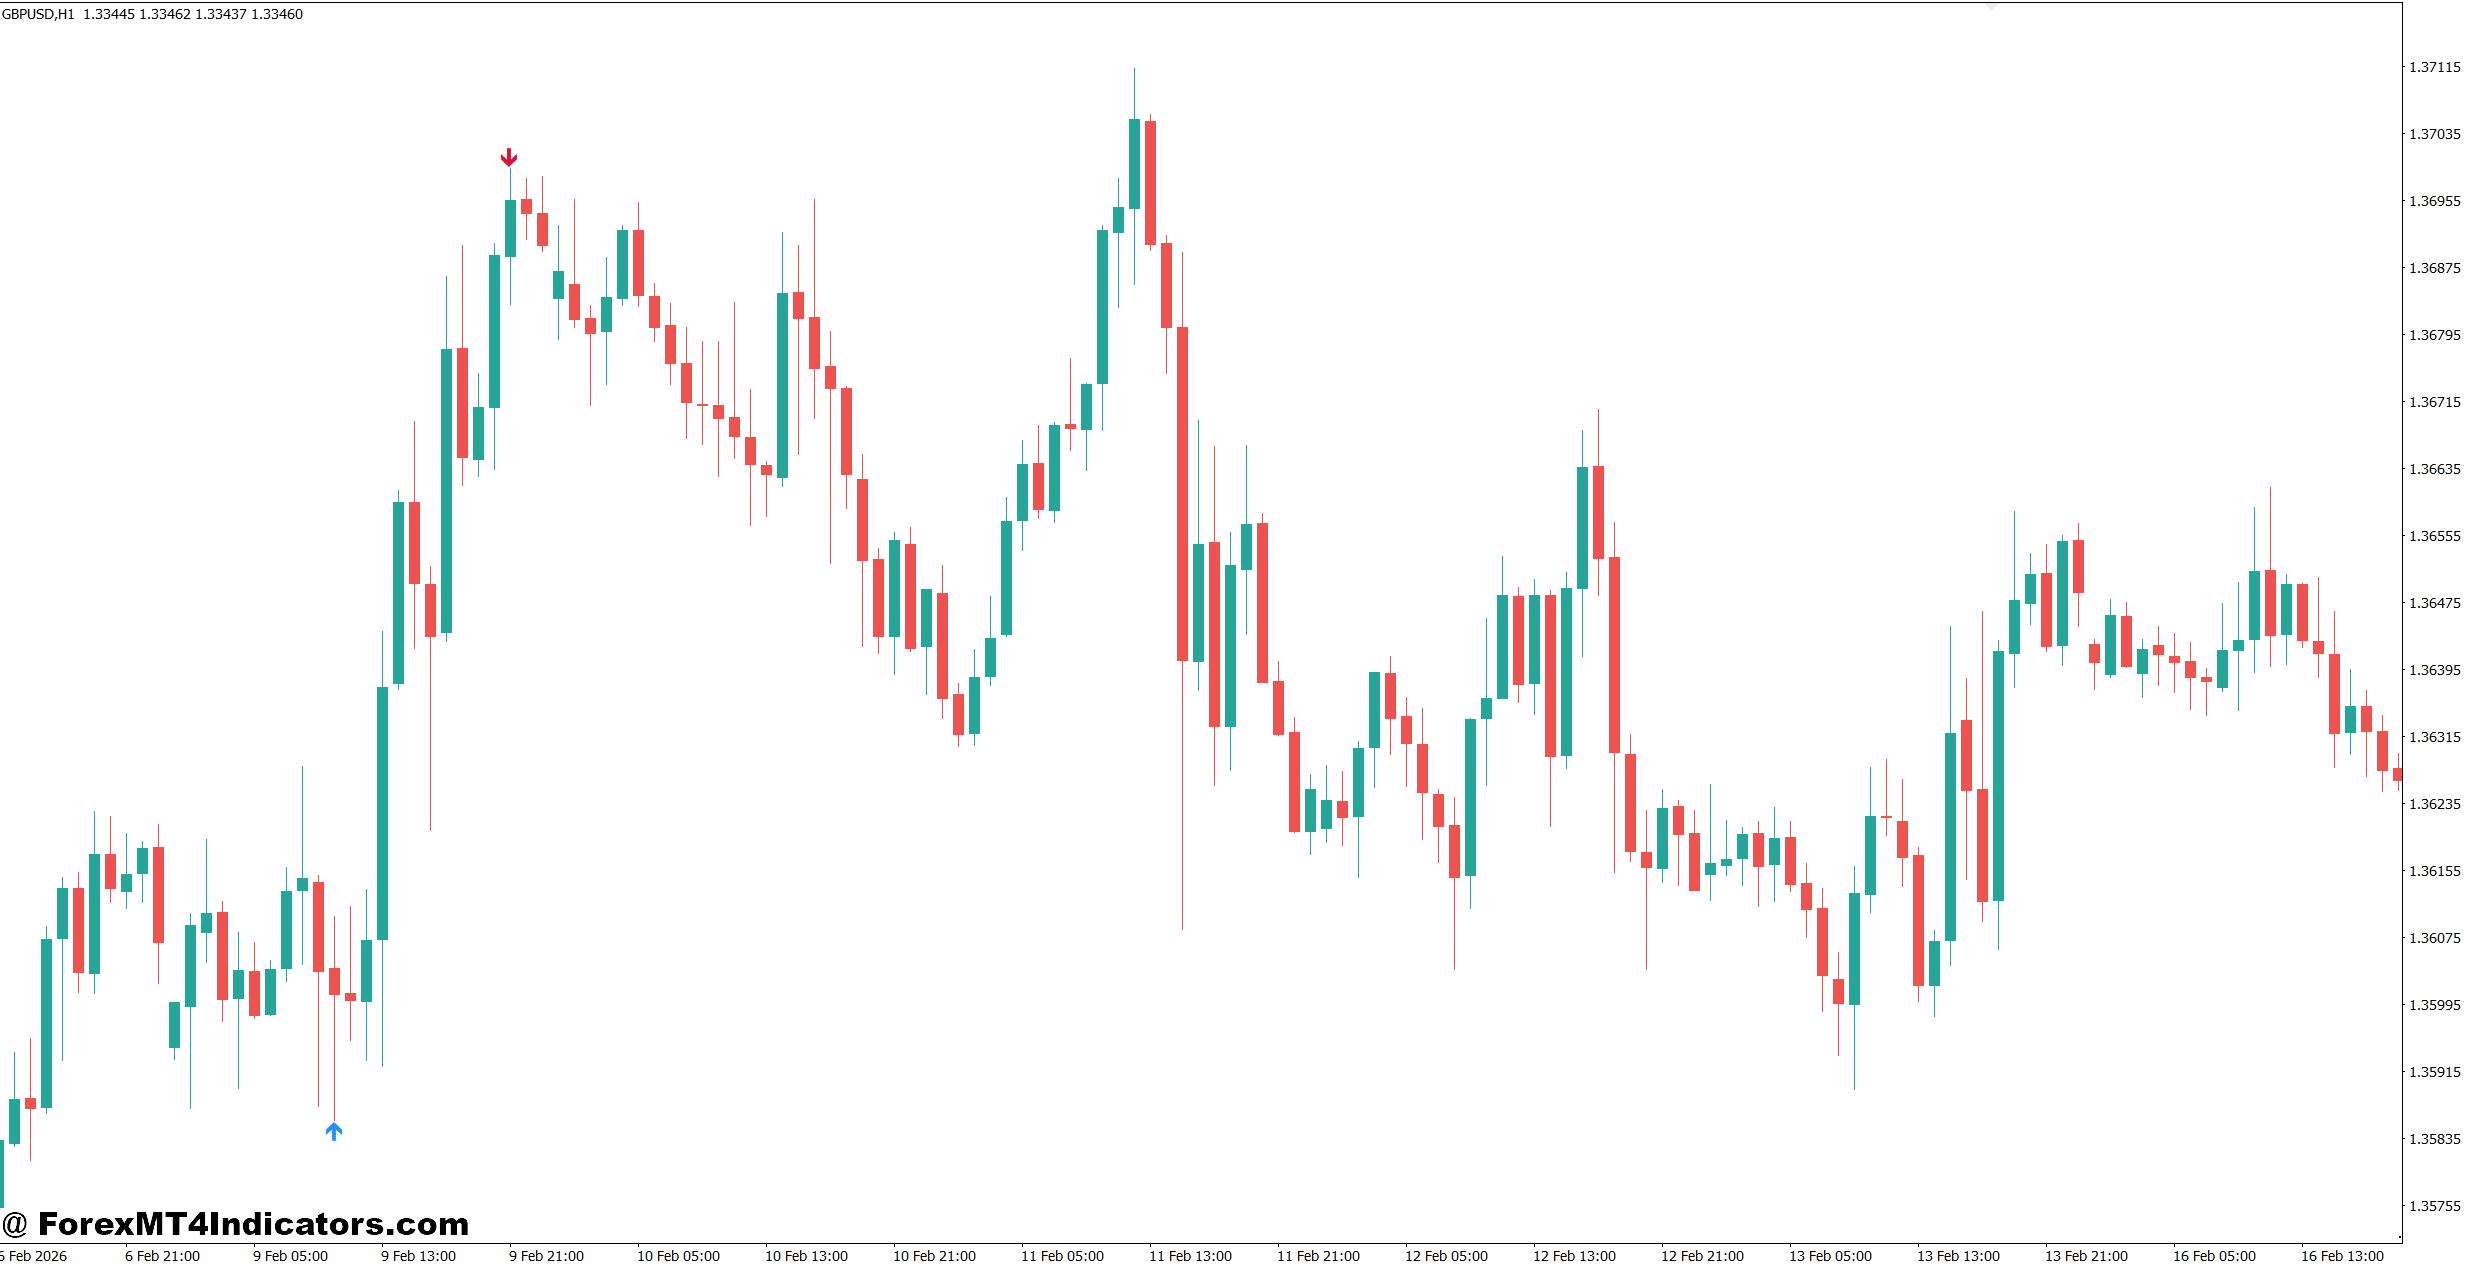
One clear advantage of the AMF Signal Arrows indicator is visual simplicity. Traders can quickly see where its conditions have produced potential directional signals without adding several separate indicators to the chart.
It can also work well as a confirmation layer. For instance, a trader may combine a bullish arrow with a 14-period RSI holding above 50 and price trading above a 50-period moving average. That combination gives trend and momentum context rather than relying on the arrow alone.
But there are weaknesses.
The indicator can lag if its calculation relies heavily on smoothing. It can also produce losing signals when price enters a tight range. Some arrow indicators may change or disappear before a candle closes, depending on how their code handles current-bar calculations. Traders should test the specific version carefully for repainting or signal changes.
Compared with a standard moving average, the AMF tool gives more direct entry markers. A moving average, however, provides a clearer view of the underlying trend and does not pretend to pinpoint every entry.
Compared with RSI, the arrow indicator is more focused on directional signals, while RSI helps identify momentum and potential overbought or oversold conditions. Neither tool replaces price action.
A practical setup could therefore use the AMF arrow for timing, a 50-period moving average for trend direction, and support/resistance for the trade location.
A Simple Risk Framework for Arrow-Based Trades
Risk management should come before signal frequency. If an account has $5,000 and the trader risks 1% per trade, the maximum planned loss is $50. The position size should then be calculated from the stop distance rather than choosing a lot size first.
For example, a EUR/USD setup with a 25-pip stop should have a smaller position than one using a 15-pip stop if both trades carry the same dollar risk.
Traders should also avoid entering simply because several arrows appear close together. Three bullish arrows inside a 20-pip range don’t automatically mean three separate buy opportunities.
A better rule is to wait for a fresh signal at a meaningful market location. If the arrow appears directly under major resistance, the trader may skip it. If it appears after a pullback into previous support with a clear invalidation level, the setup becomes easier to manage.
Trading forex carries substantial risk. No indicator guarantees profits. Traders should test the AMF Signal Arrows Forex Indicator on historical charts and a demo account before risking real capital.
How to Trade with AMF Signal Arrows Forex Indicator for MT4
Buy Entry
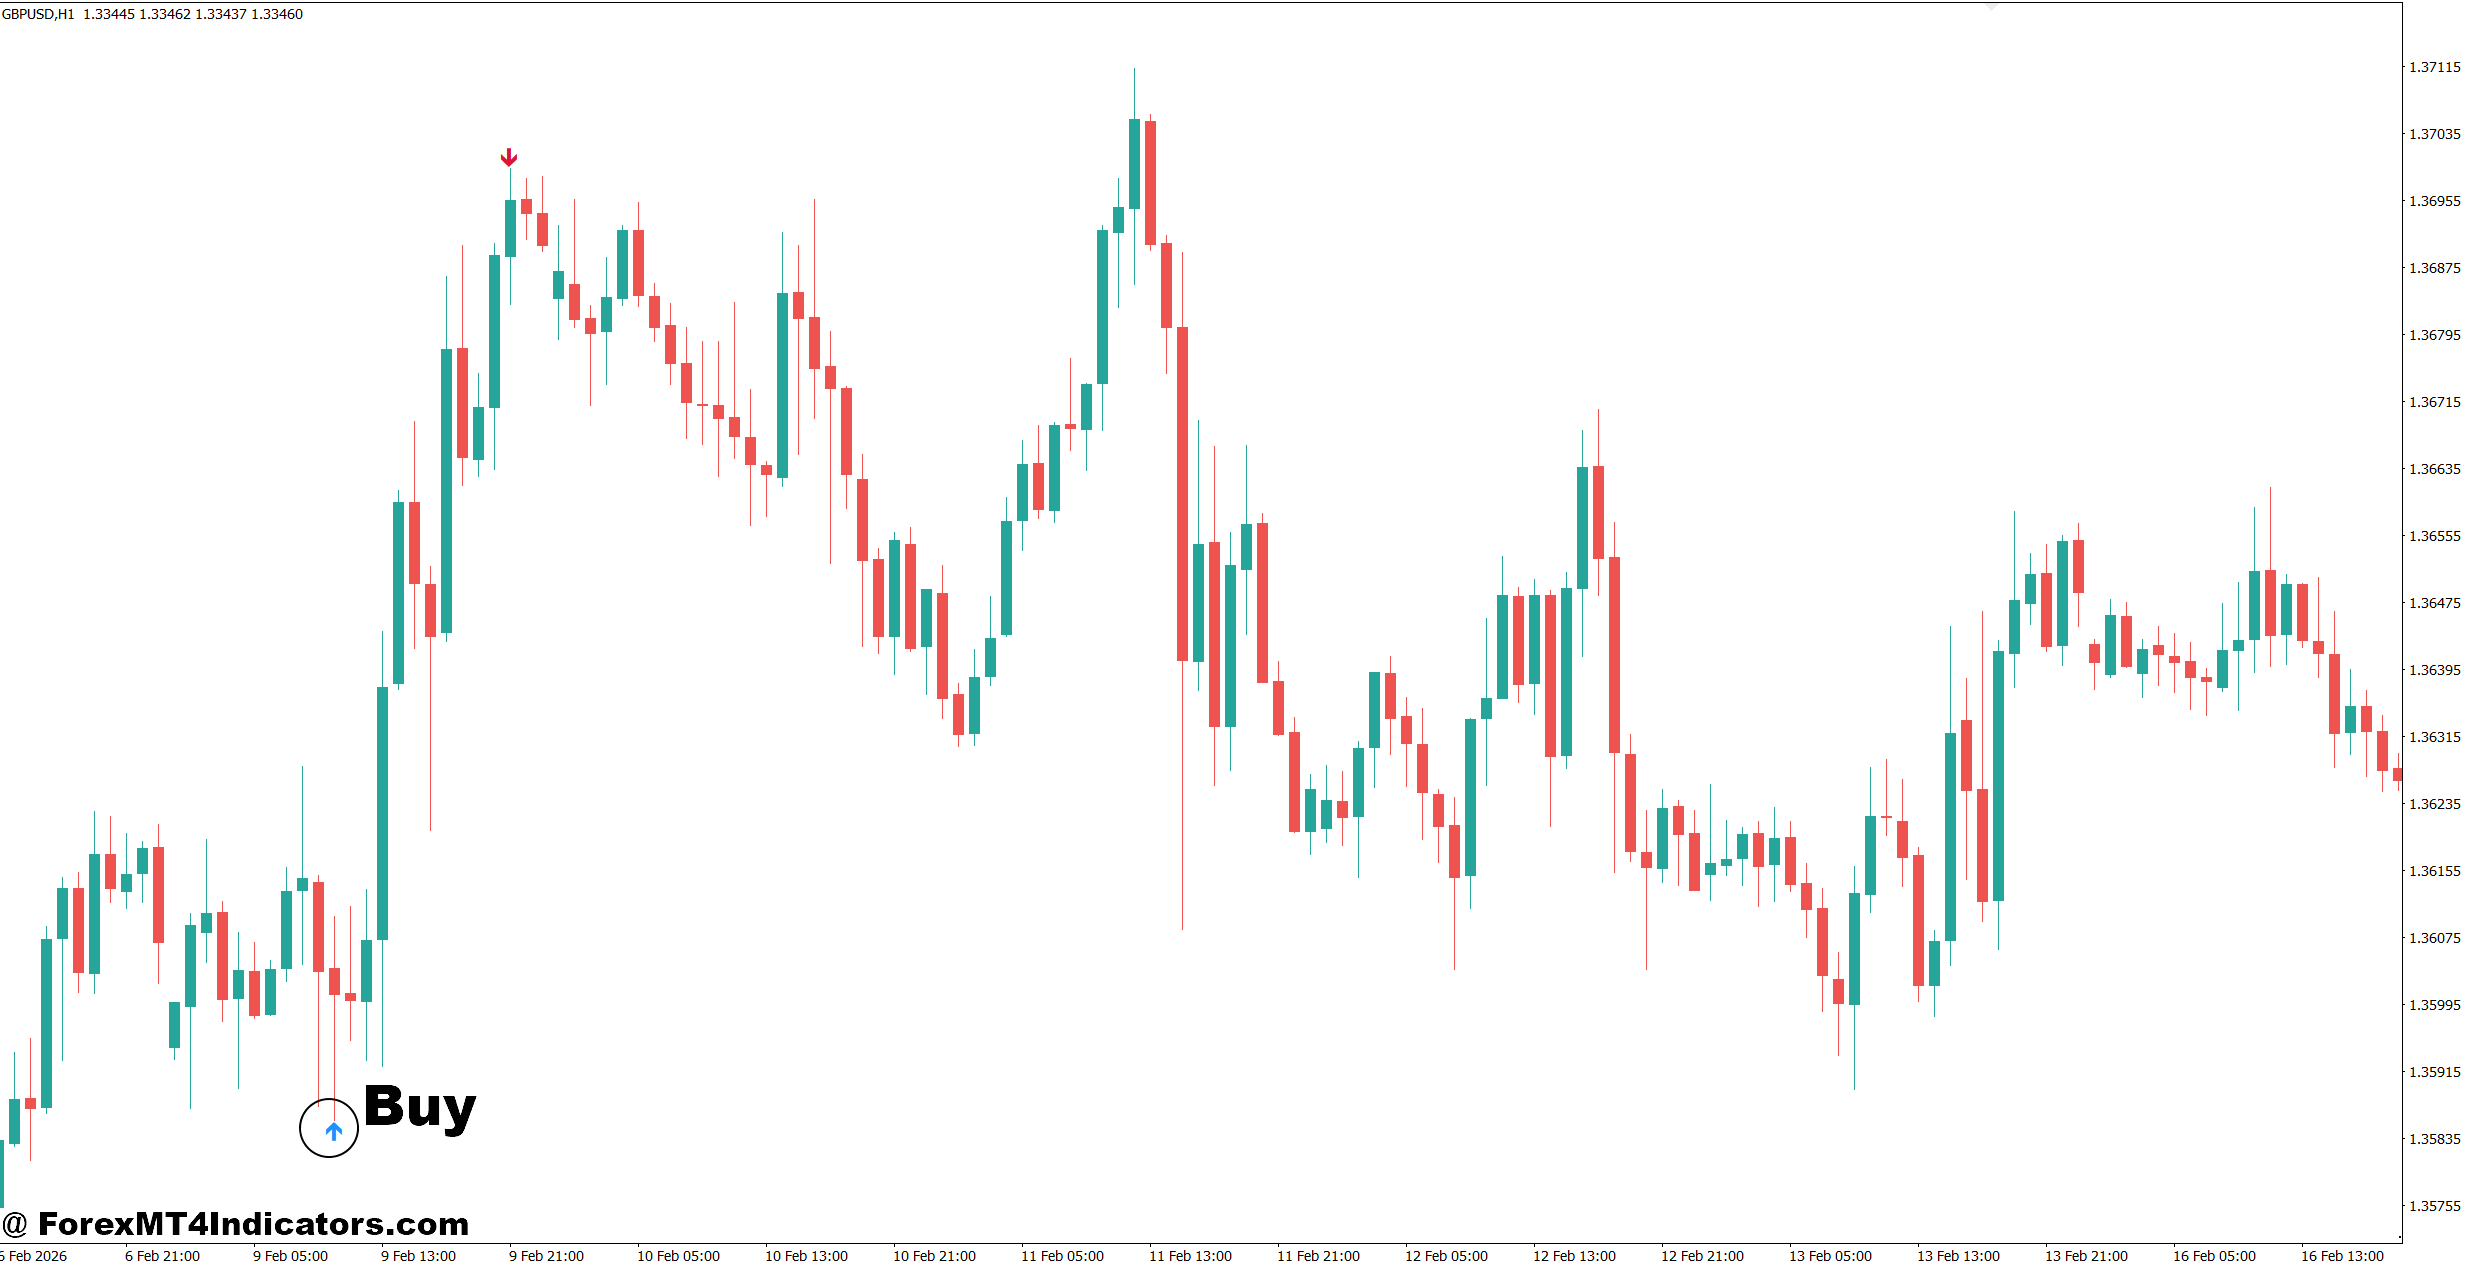
- Wait for a bullish arrow – Enter only after a confirmed upward arrow appears on the 15-minute or 1-hour chart, preferably after candle close.
- Confirm the higher trend – On EUR/USD, favor buy arrows when the 1-hour price is above the 50-period moving average and the 4-hour trend is bullish.
- Buy near support – Look for a bullish arrow within 10–20 pips of a proven support zone to improve the entry location.
- Check breakout strength – On GBP/USD, consider a buy after price breaks resistance by at least 5–10 pips and the AMF arrow confirms the move.
- Set a defined stop – Place the stop 15–30 pips below the recent swing low on major pairs, depending on volatility.
- Target at least 1:2 RR – If risking 20 pips, aim for roughly 40 pips or more instead of taking small profits.
- Risk only 1% – Keep each AMF buy trade near 0.5–1% account risk, especially when trading lower timeframes.
- Skip weak signals – Don’t buy an arrow directly below major resistance or during tight 5–10 pip sideways chop.
Sell Entry
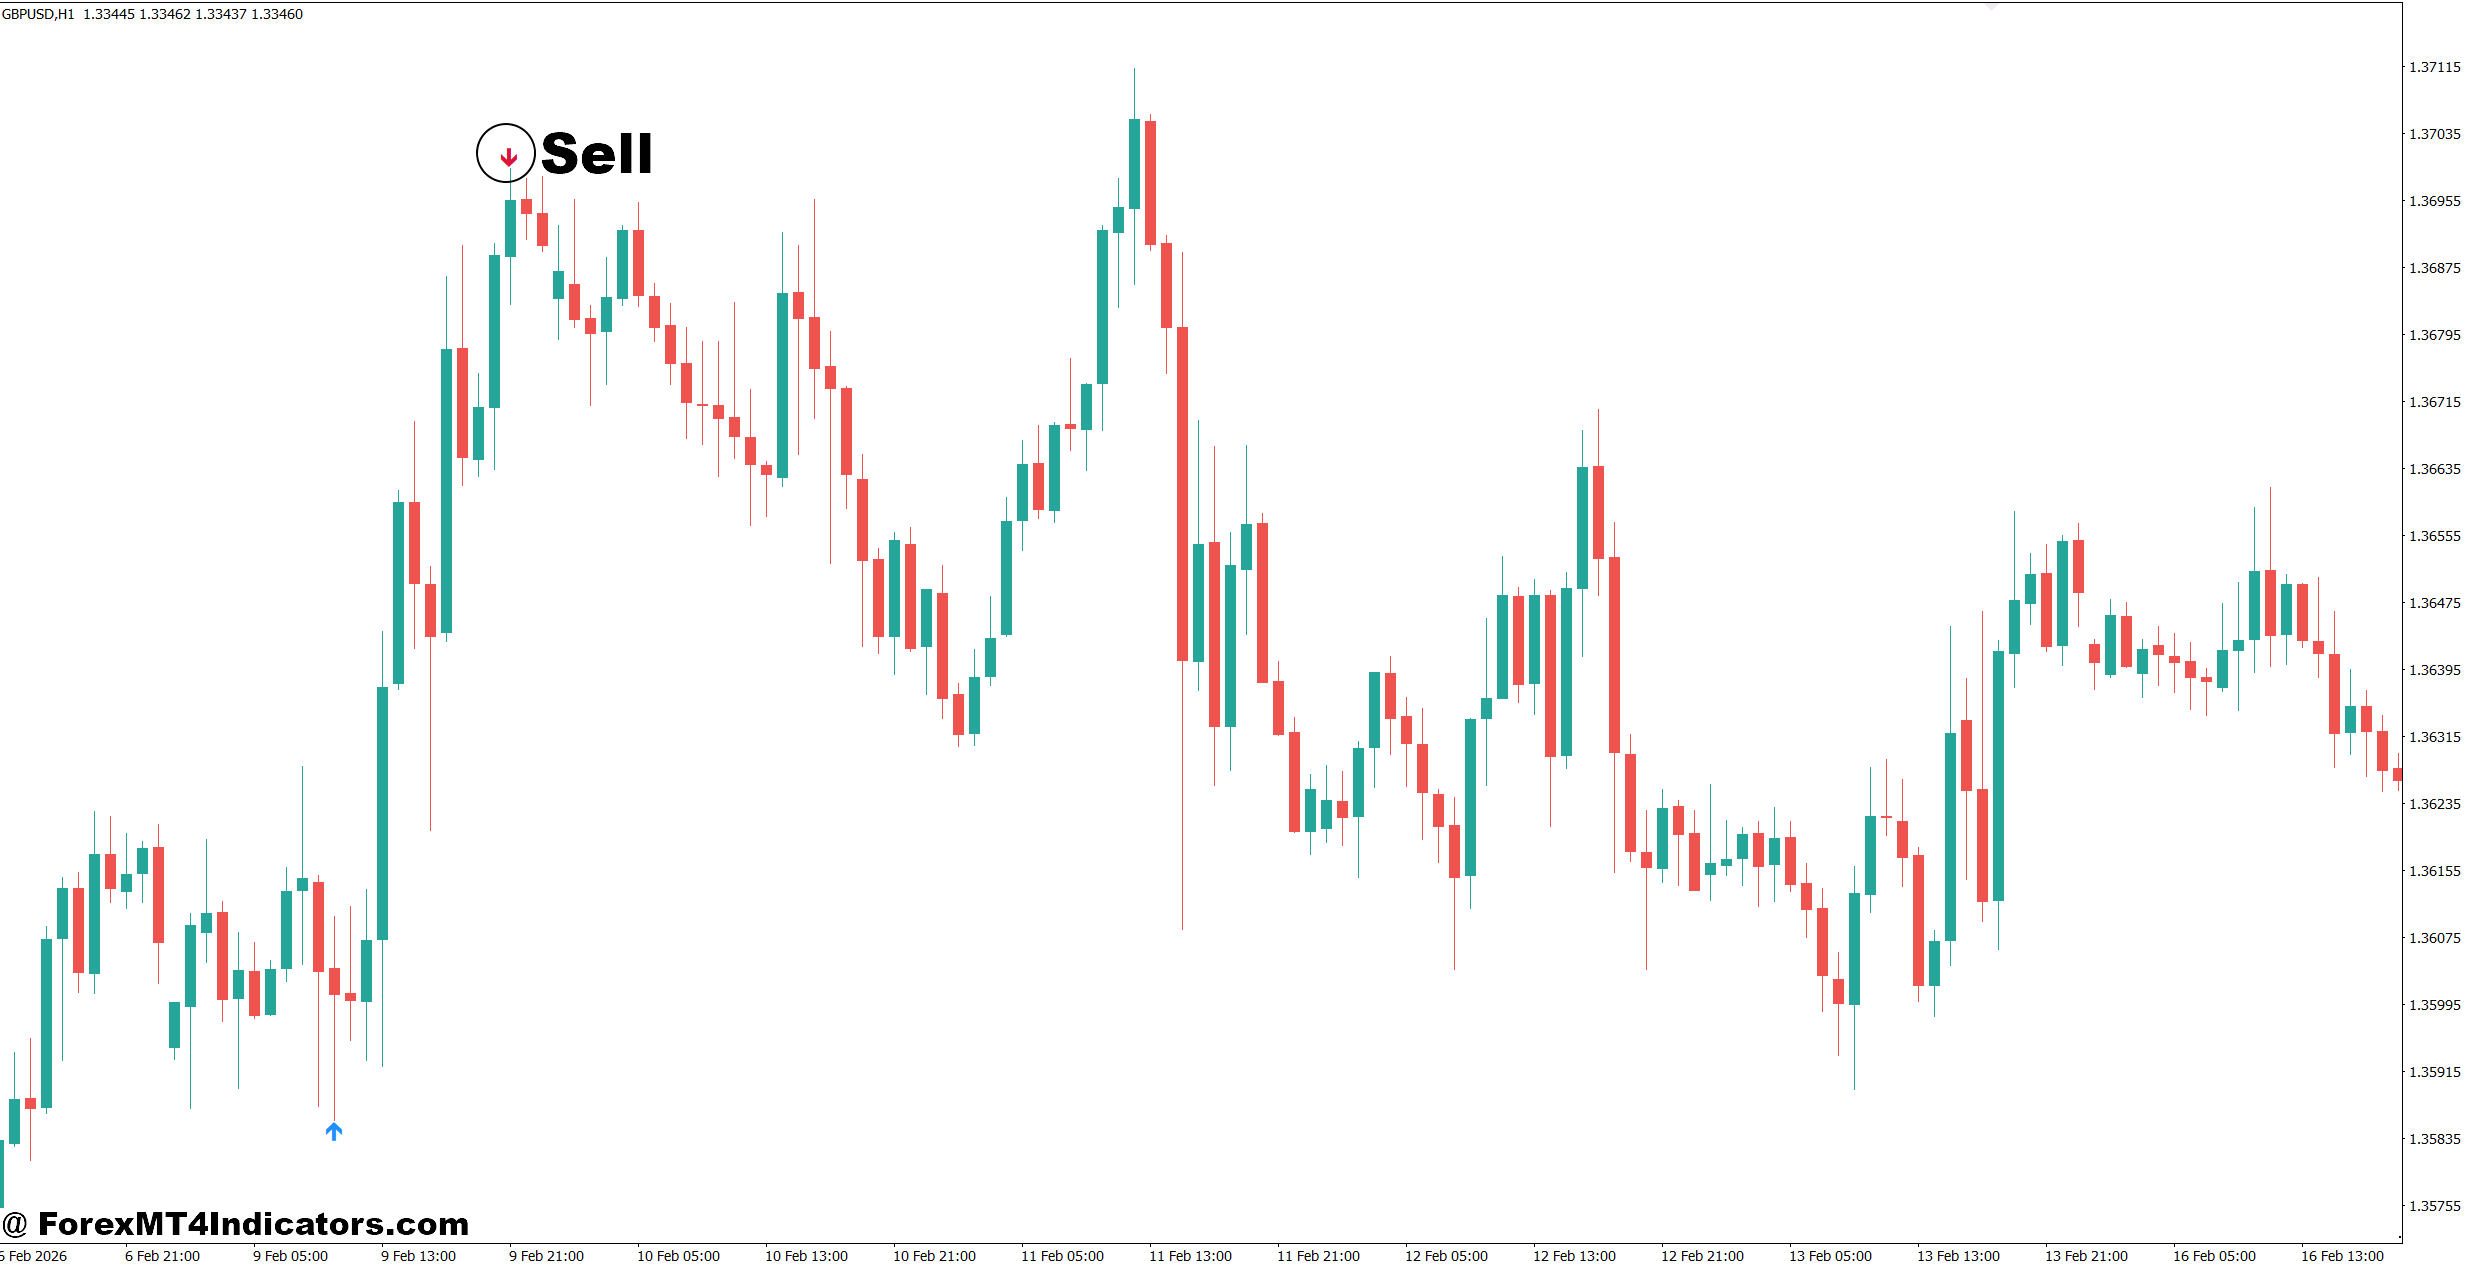
- Wait for a bearish arrow – Enter after a confirmed downward arrow closes on the 15-minute or 1-hour chart rather than reacting mid-candle.
- Confirm the larger trend – On EUR/USD, favor sell signals when the 4-hour structure is bearish and price remains below the 50-period moving average.
- Sell near resistance – Look for a bearish arrow within 10–20 pips of a strong resistance zone for better trade location.
- Confirm the breakdown – On GBP/USD, consider selling when support breaks by 5–10 pips and the AMF arrow confirms bearish momentum.
- Protect above the swing – Place the stop around 15–30 pips above the recent swing high, adjusting for current volatility.
- Use a 1:2 target – With a 25-pip stop, look for approximately 50 pips of potential downside before entering.
- Limit account exposure – Keep individual sell trades around 0.5–1% risk and avoid stacking several correlated USD positions.
- Avoid late entries – Don’t sell after price has already fallen 40–60 pips from the arrow if the next daily support zone is close.
Final Takeaway
The AMF Signal Arrows Forex Indicator can make chart reading quicker by highlighting possible bullish and bearish entries. Its real value comes from context, not from the arrow itself.
- Use arrows with structure – Support, resistance, trend direction, and candle closes can help filter weak signals.
- Match settings to the chart – A 15-minute setup behaves very differently from a 4-hour setup.
- Control the downside – A 1% account risk limit and predefined stop can keep one bad signal from becoming a major loss.
- Test before trusting – Traders should check historical behavior, repainting characteristics, spreads, and performance across different market conditions.
Used this way, the AMF Signal Arrows Forex Indicator becomes a practical timing aid rather than a standalone trading system. The better question isn’t how many arrows it produces, but how well its signals fit the trader’s overall method.
Level up your trading
Learn to read the chart — not just the indicator
eBook · Instant PDF
Video Course · 12 modules
Recommended MT4/MT5 Brokers
- ✓ *FREE *$50 to start (withdrawable)
- ✓ Deposit bonus up to $5,000
- ✓ Negative balance protection
Trading forex and CFDs carries a significant risk of loss and is not suitable for everyone. Broker links are affiliate links — we may earn a commission at no cost to you.
Free MT4 Indicator Download

Enter Your Email Address below, download link will be sent to you.
