


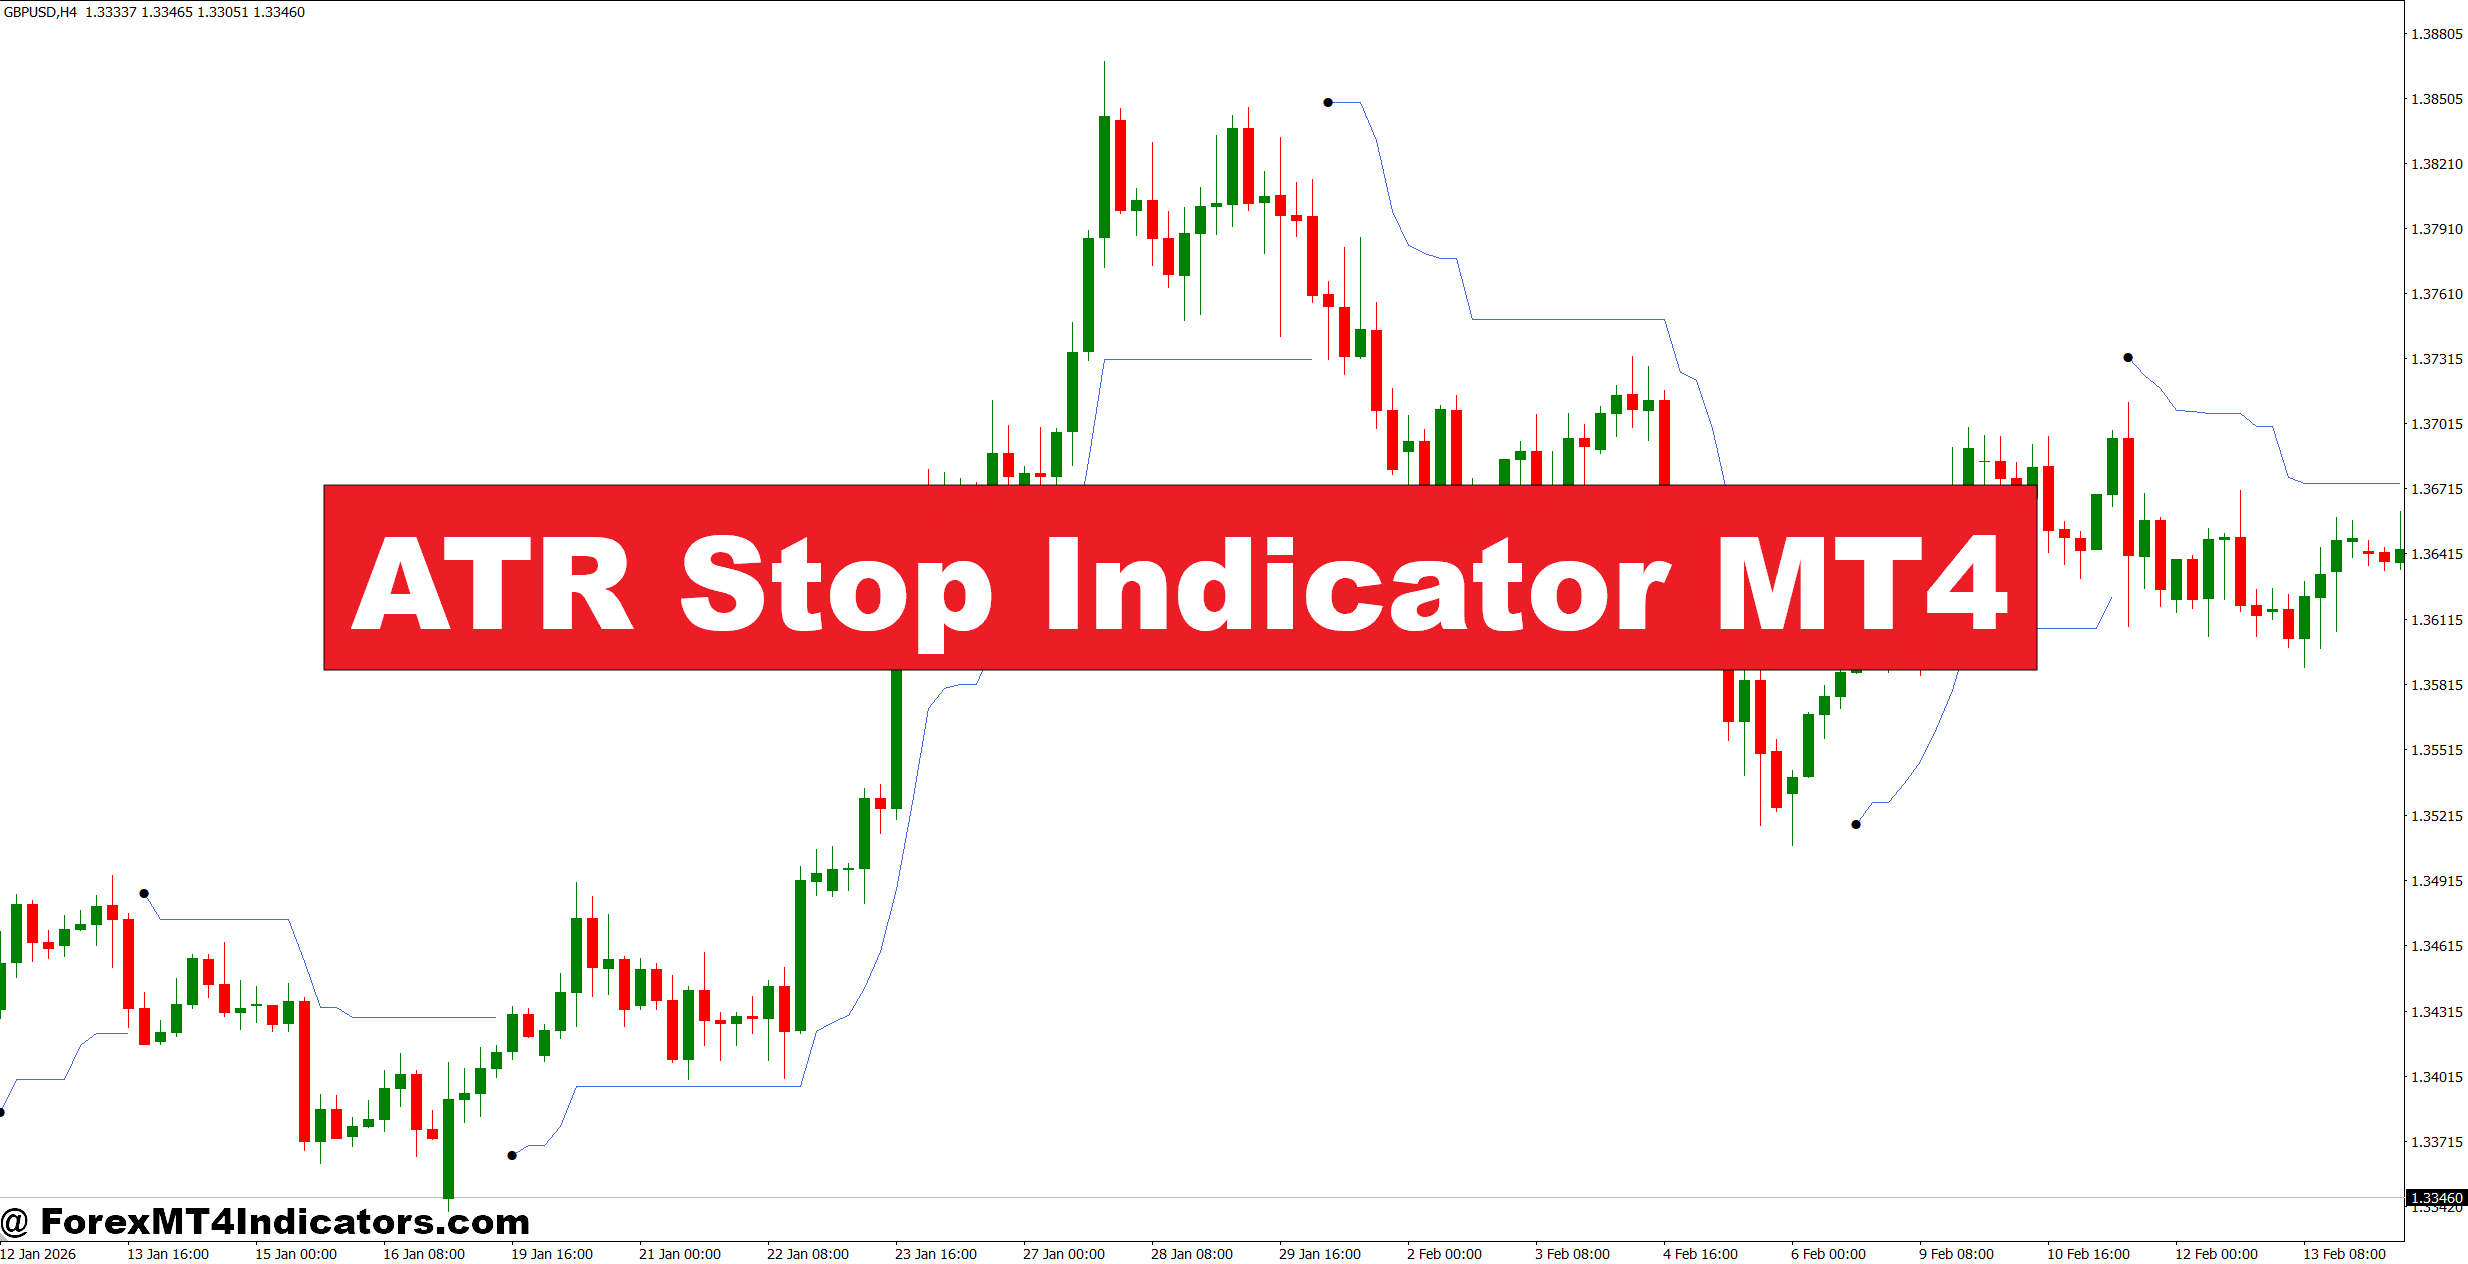
The underlying idea comes from the Average True Range developed by J. Welles Wilder. ATR measures the average size of recent price ranges, including gaps where applicable. A common setting is 14 periods, although traders can adjust it.
True Range for each candle is generally calculated as the largest of:
- Current high minus current low
- Absolute current high minus previous close
- Absolute current low minus previous close
The indicator then calculates an average of these True Range values. Depending on the specific MT4 version, the ATR Stop Indicator may multiply that volatility reading by a user-selected factor and plot the resulting stop level above or below price.
For example, suppose EUR/USD has a 14-period ATR of 0.0012, or 12 pips. With a 2.0 ATR multiplier, the volatility distance becomes approximately 24 pips. A bullish setup could therefore use a stop around 24 pips below the relevant price, subject to market structure.
This approach has a major advantage over a fixed 10-pip or 20-pip stop. The distance changes with volatility.
When testing ATR-based stops during volatile NFP sessions, traders may see the calculated distance expand sharply. That’s useful because a stop that works during the Asian session can be far too tight during New York news.
Using ATR Stops With Price Action
The best results usually come when volatility and market structure agree.
Imagine GBP/USD on the 1-hour chart. Price breaks above resistance at 1.2750, then pulls back toward 1.2760 while the ATR reads around 18 pips. If the trader uses a 1.5 ATR multiplier, the volatility allowance is roughly 27 pips.
Instead of placing the stop directly under the breakout candle, the trader could look for a logical structural level around 1.2730–1.2735. The ATR reading helps determine whether that distance gives the position enough room to breathe.
Another example is EUR/USD during a strong 4-hour uptrend. Suppose the pair is trading near 1.0860, while the recent swing low sits at 1.0828. A 30-pip structural stop may be reasonable if the 14-period ATR is around 20 pips. But if ATR suddenly rises to 35 pips, a 30-pip stop deserves more caution because normal volatility has increased.
The same principle works for short positions. If USD/JPY rejects resistance and begins making lower highs, an ATR-based stop can sit above the recent swing high rather than at an arbitrary fixed number.
A useful rule is simple: ATR should support the stop location, not replace market structure.
Settings for Different Forex Conditions
There isn’t one perfect ATR setting for every pair and timeframe. Traders should test the indicator rather than copying a setting from another chart.
For M5 and M15 scalping, a 7- or 10-period ATR can react faster to changing volatility. A multiplier between 1.2 and 1.8 may provide a starting point for testing, but tight stops can still suffer from spread and short-term noise.
On the 1-hour chart, the classic 14-period ATR with a 1.5–2.5 multiplier is a more practical starting range. Traders can then compare historical results across EUR/USD, GBP/USD, and USD/JPY.
For 4-hour and daily trading, a 14- or 20-period ATR can smooth out short-term fluctuations. Multipliers around 2.0–3.0 may give swing trades more room, although wider stops require smaller position sizes.
The calculation should always match the trader’s risk. If a setup allows a 50-pip stop while the account rules permit only $50 of risk, position size needs to fall accordingly. A wider stop should never become an excuse to risk more money.
Strengths, Weaknesses, and Comparison With Other Stop Methods
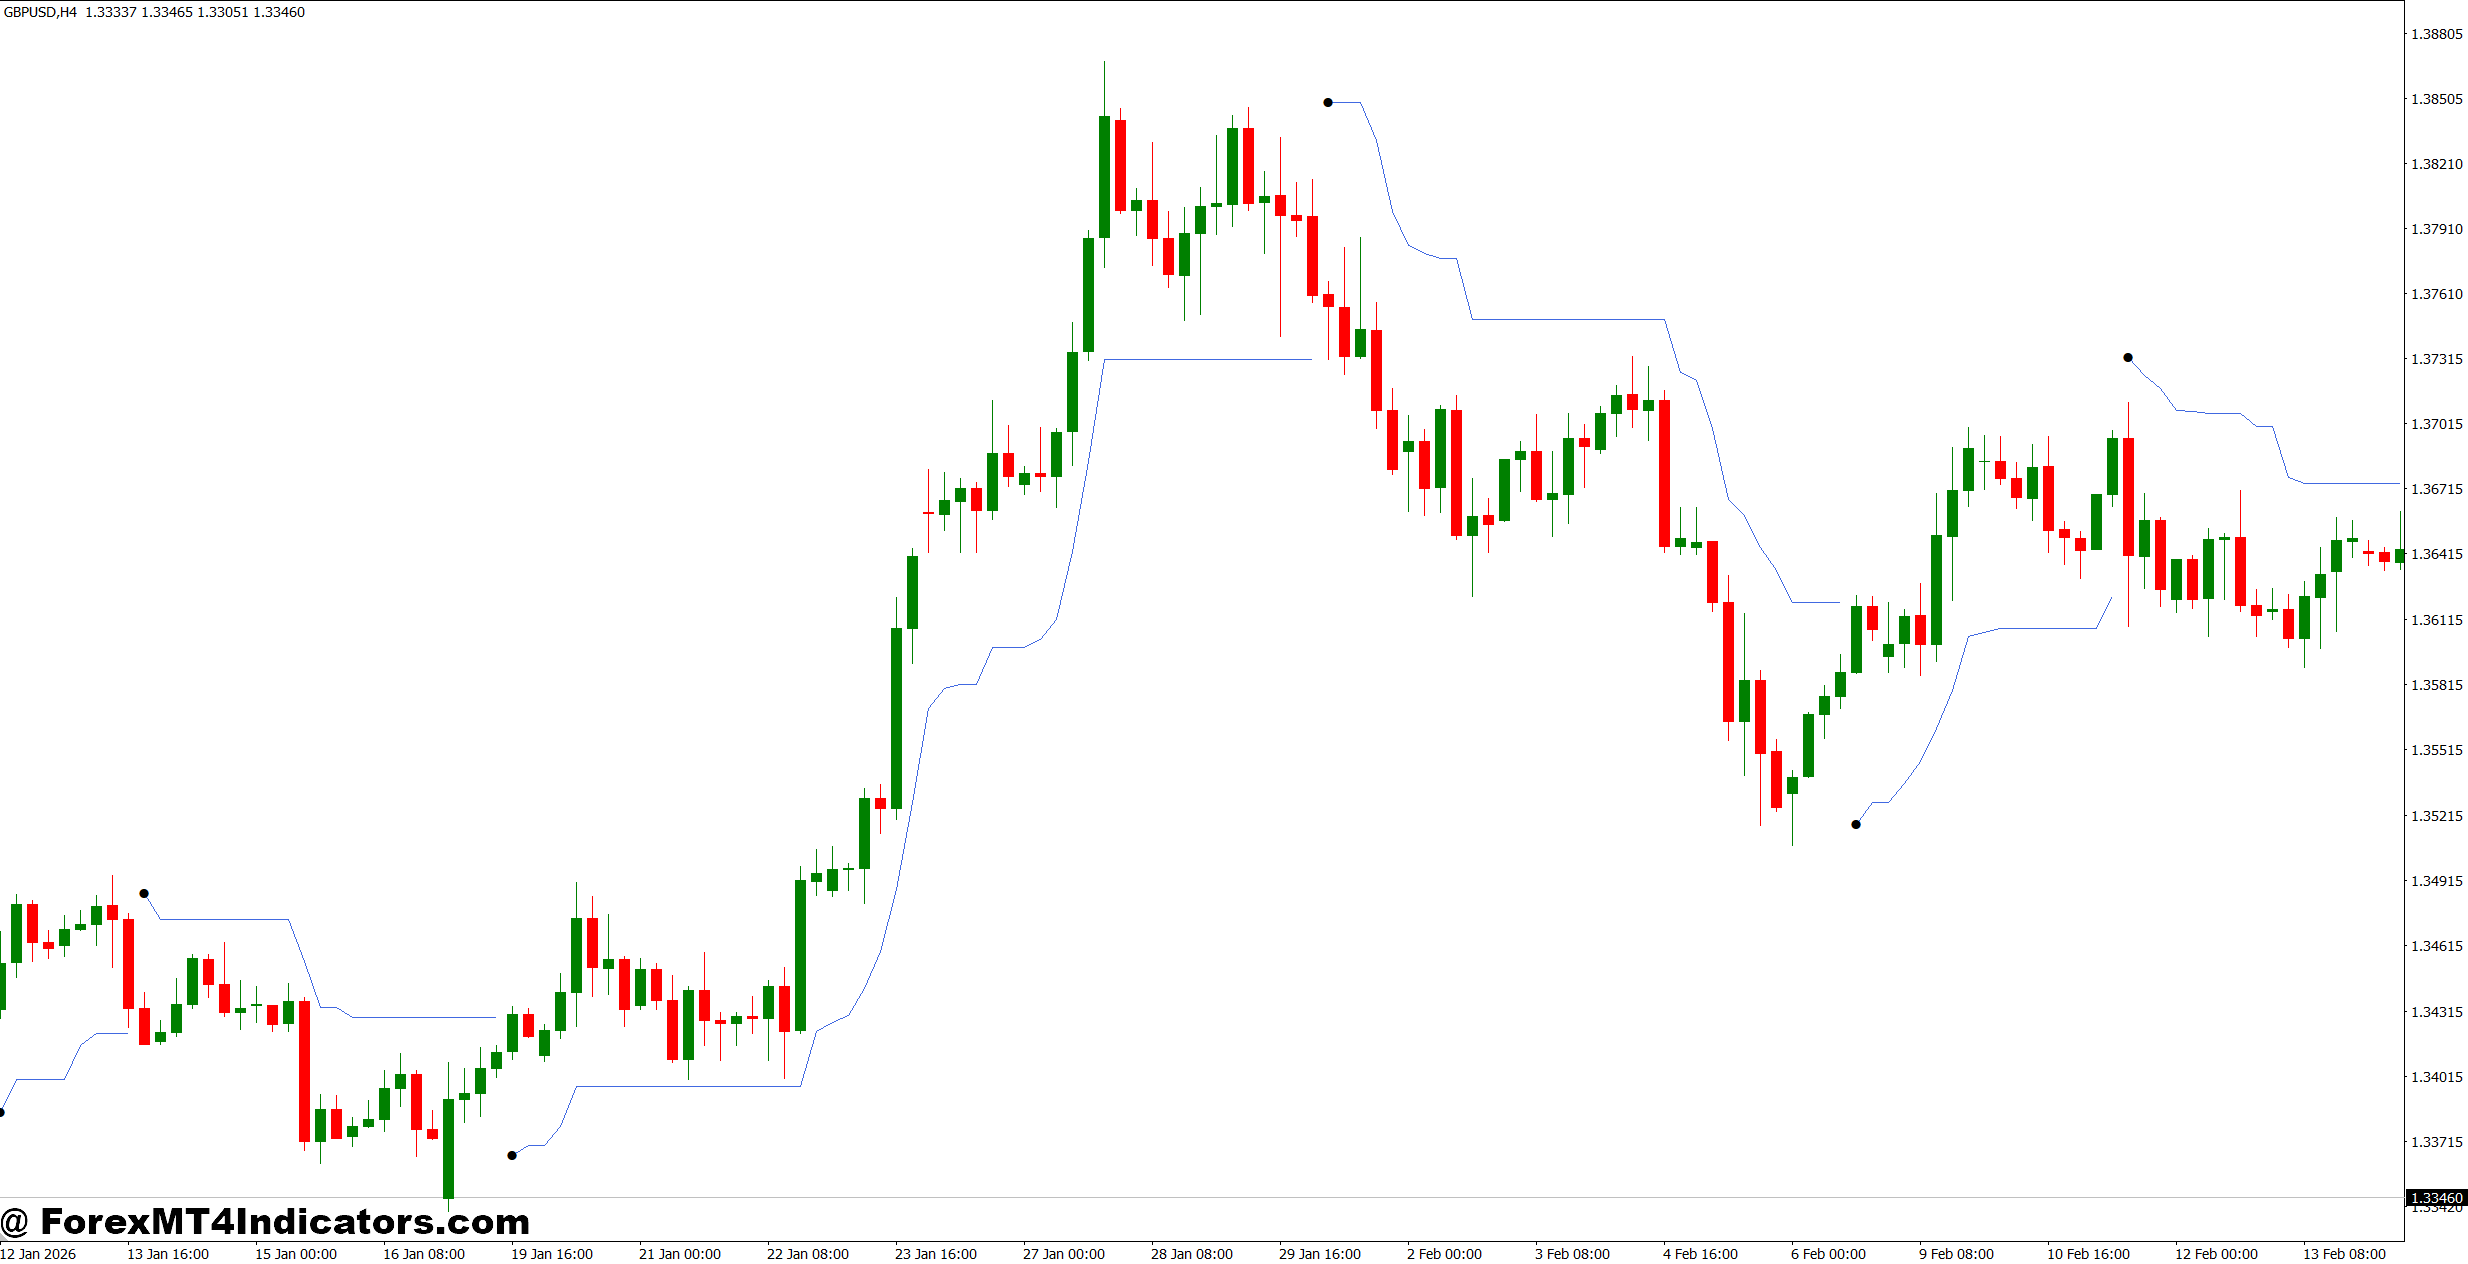
One strong feature of ATR stops is their ability to respond to volatility. Fixed-pip stops don’t make that adjustment. A 20-pip stop on EUR/USD can behave very differently during a quiet Tuesday compared with a major US inflation release.
Compared with a moving average trailing stop, an ATR stop focuses more directly on volatility. A moving average may remain relatively close to price during a strong trend, while an ATR multiplier can provide a wider buffer when price ranges expand.
A Parabolic SAR works differently again. It accelerates its trailing level as a trend develops and can perform well in directional markets. But it can also flip repeatedly during sideways conditions. ATR-based stops generally give traders more control over the distance.
The main weakness is that ATR doesn’t understand support or resistance. A stop can have a statistically reasonable distance and still sit directly behind an obvious swing level where liquidity gets tested.
Choppy markets are another problem. If EUR/USD repeatedly moves 15–25 pips in both directions, an ATR stop may not prevent whipsaws. The indicator measures volatility; it doesn’t predict direction.
That’s why experienced traders often combine it with market structure, trend direction, breakout confirmation, and support/resistance rather than treating the line as an automatic trading signal.
Practical ATR Stop Trading Example
Consider USD/JPY on the 4-hour chart. Price has formed higher highs and higher lows, then pulls back toward previous support at 147.80. The current price is 148.20, and the 14-period ATR is approximately 45 pips.
With a 1.5 multiplier, the volatility allowance is about 67.5 pips. Instead of blindly placing a 67-pip stop, the trader checks the structure. If the important swing low sits at 147.70, a stop around 147.60–147.65 might make more technical sense, provided the resulting risk fits the account.
Now consider the opposite situation. If the calculated ATR stop sits below a major support level by 100 pips, the trade may simply be too expensive for the planned risk. The answer isn’t necessarily to tighten the stop. Reducing position size or skipping the setup can be the better choice.
This is where the indicator becomes a risk-management tool rather than a magic entry signal.
Trading forex carries substantial risk. No indicator guarantees profits. ATR readings can change quickly during news events, and historical testing doesn’t guarantee future results. Traders should backtest settings, account for spreads and slippage, and avoid risking money they cannot afford to lose.
How to Trade with ATR Stop Indicator MT4
Buy Entry
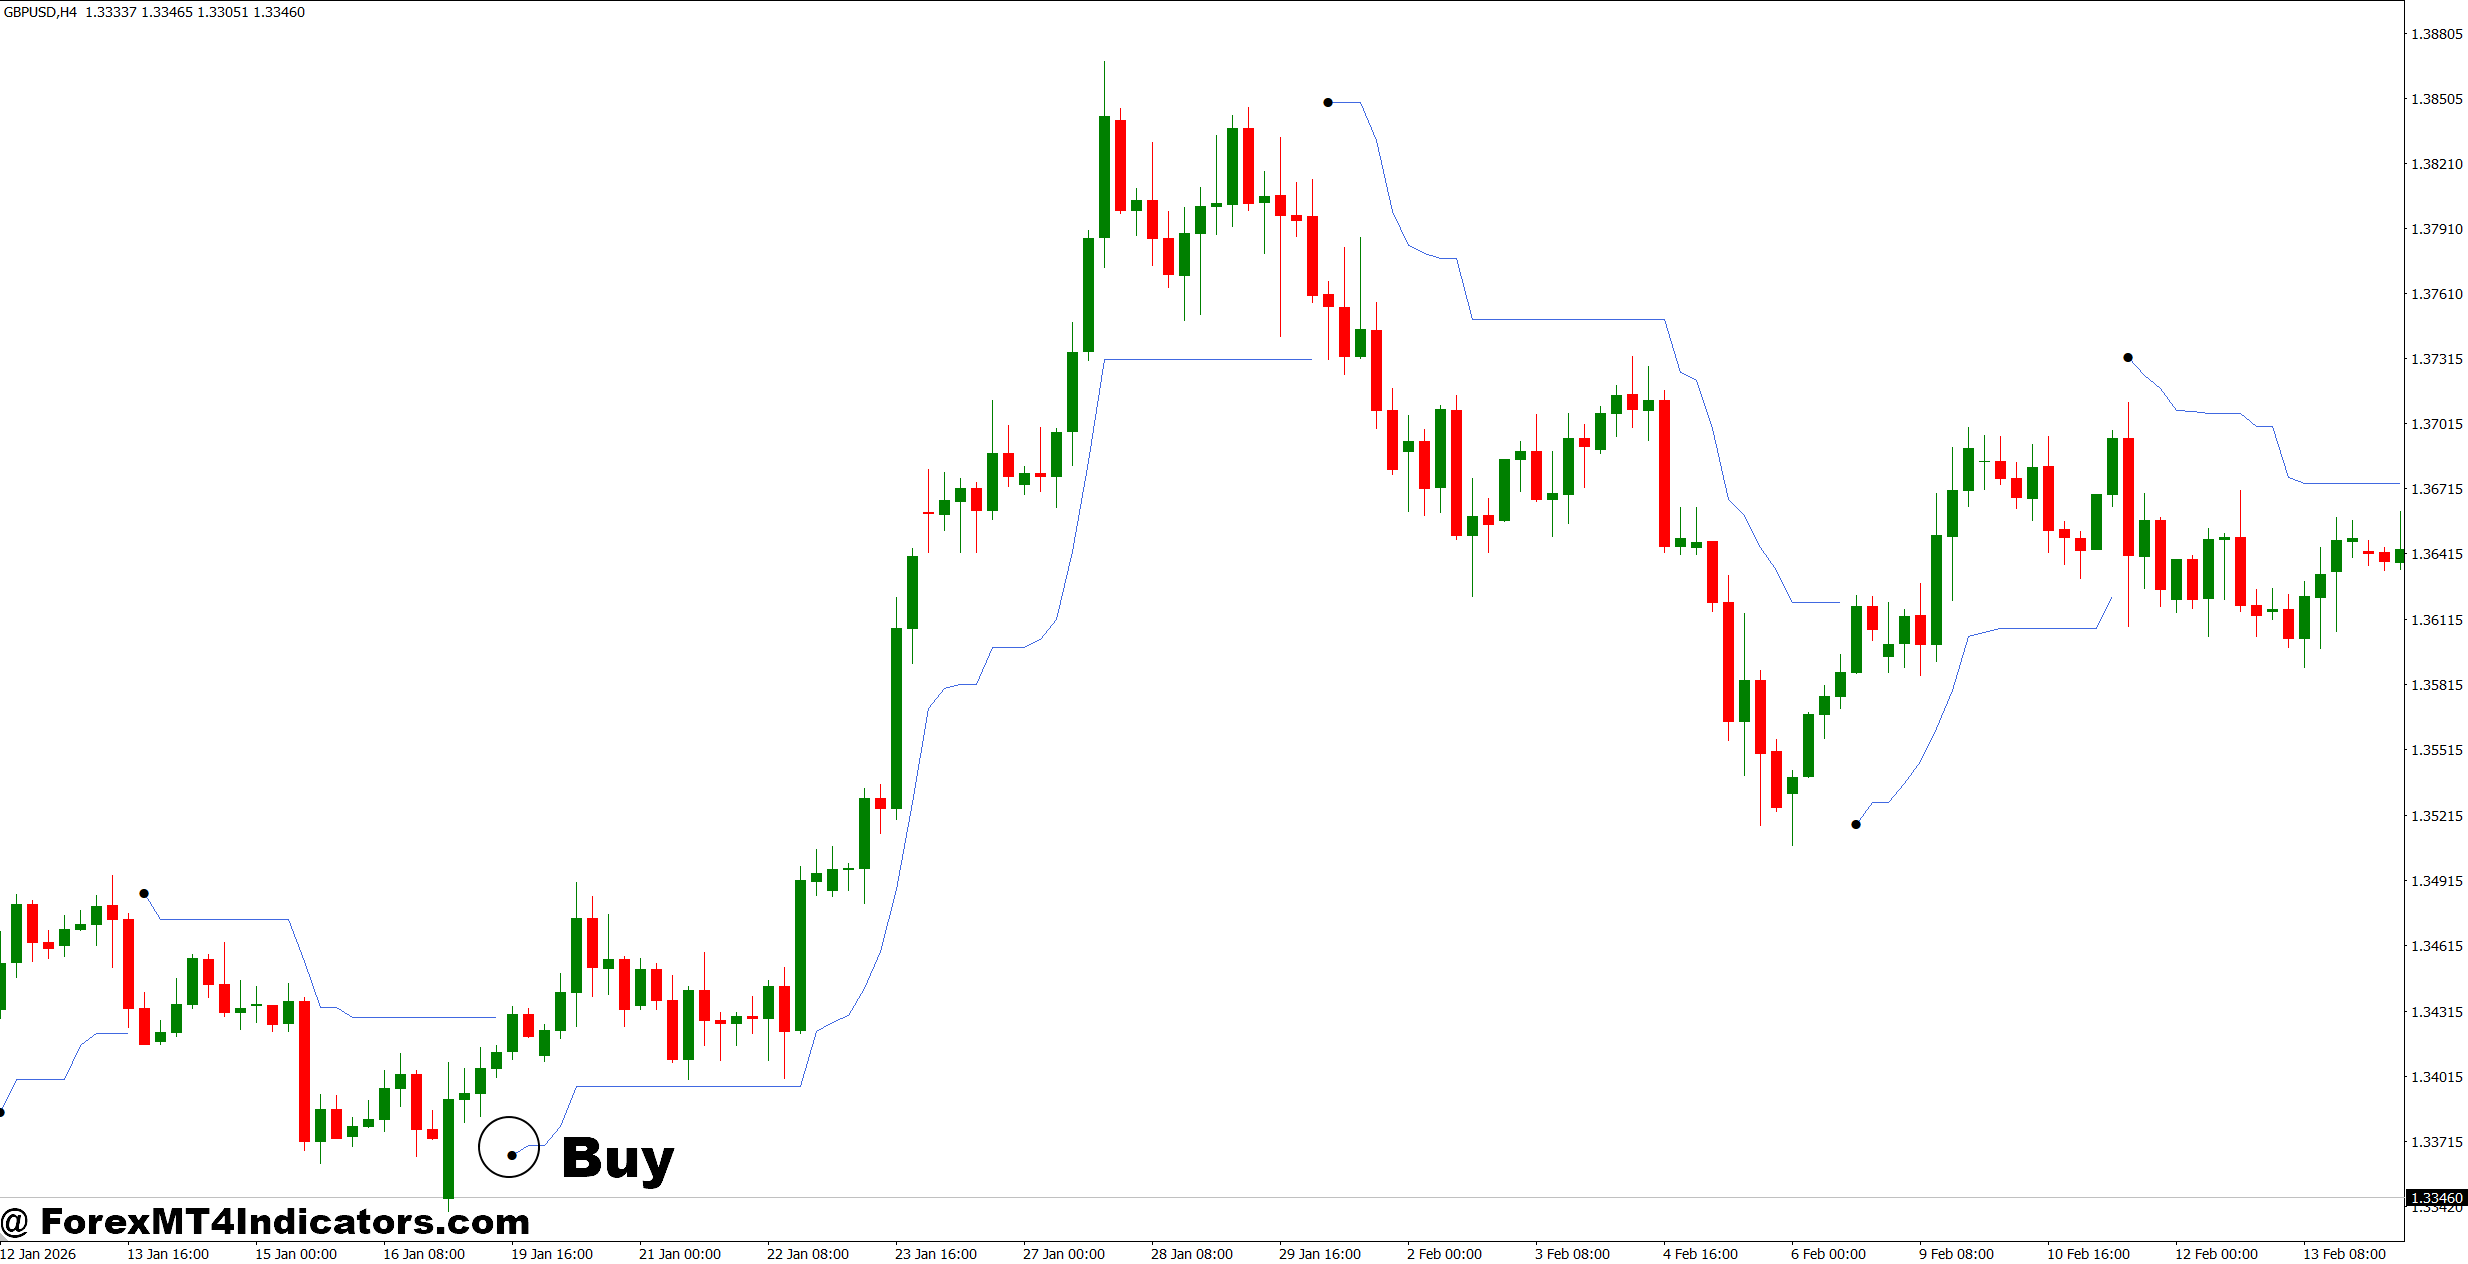
- Wait for a bullish ATR stop – Enter long when the indicator moves below price and EUR/USD closes above it on the 1-hour chart.
- Confirm the breakout – Buy GBP/USD after a candle closes at least 10 pips above resistance, with the ATR stop remaining below price.
- Check higher-timeframe trend – Prefer BUY signals when the 4-hour chart shows higher highs and higher lows.
- Use ATR for stop placement – Keep the stop about 1.5–2.0× ATR below entry instead of using an arbitrary distance.
- Target at least 1:2 risk-reward – If the stop is 25 pips, aim for roughly 50 pips or more.
- Reduce risk during high volatility – Risk only 0.5–1% per trade when ATR expands sharply around major news.
- Avoid weak breakouts – Don’t buy if EUR/USD spikes above resistance but closes back below it within the same 1-hour candle.
- Trail after strong movement – Once price gains around 30–40 pips, consider moving the stop toward breakeven if structure supports it.
Sell Entry
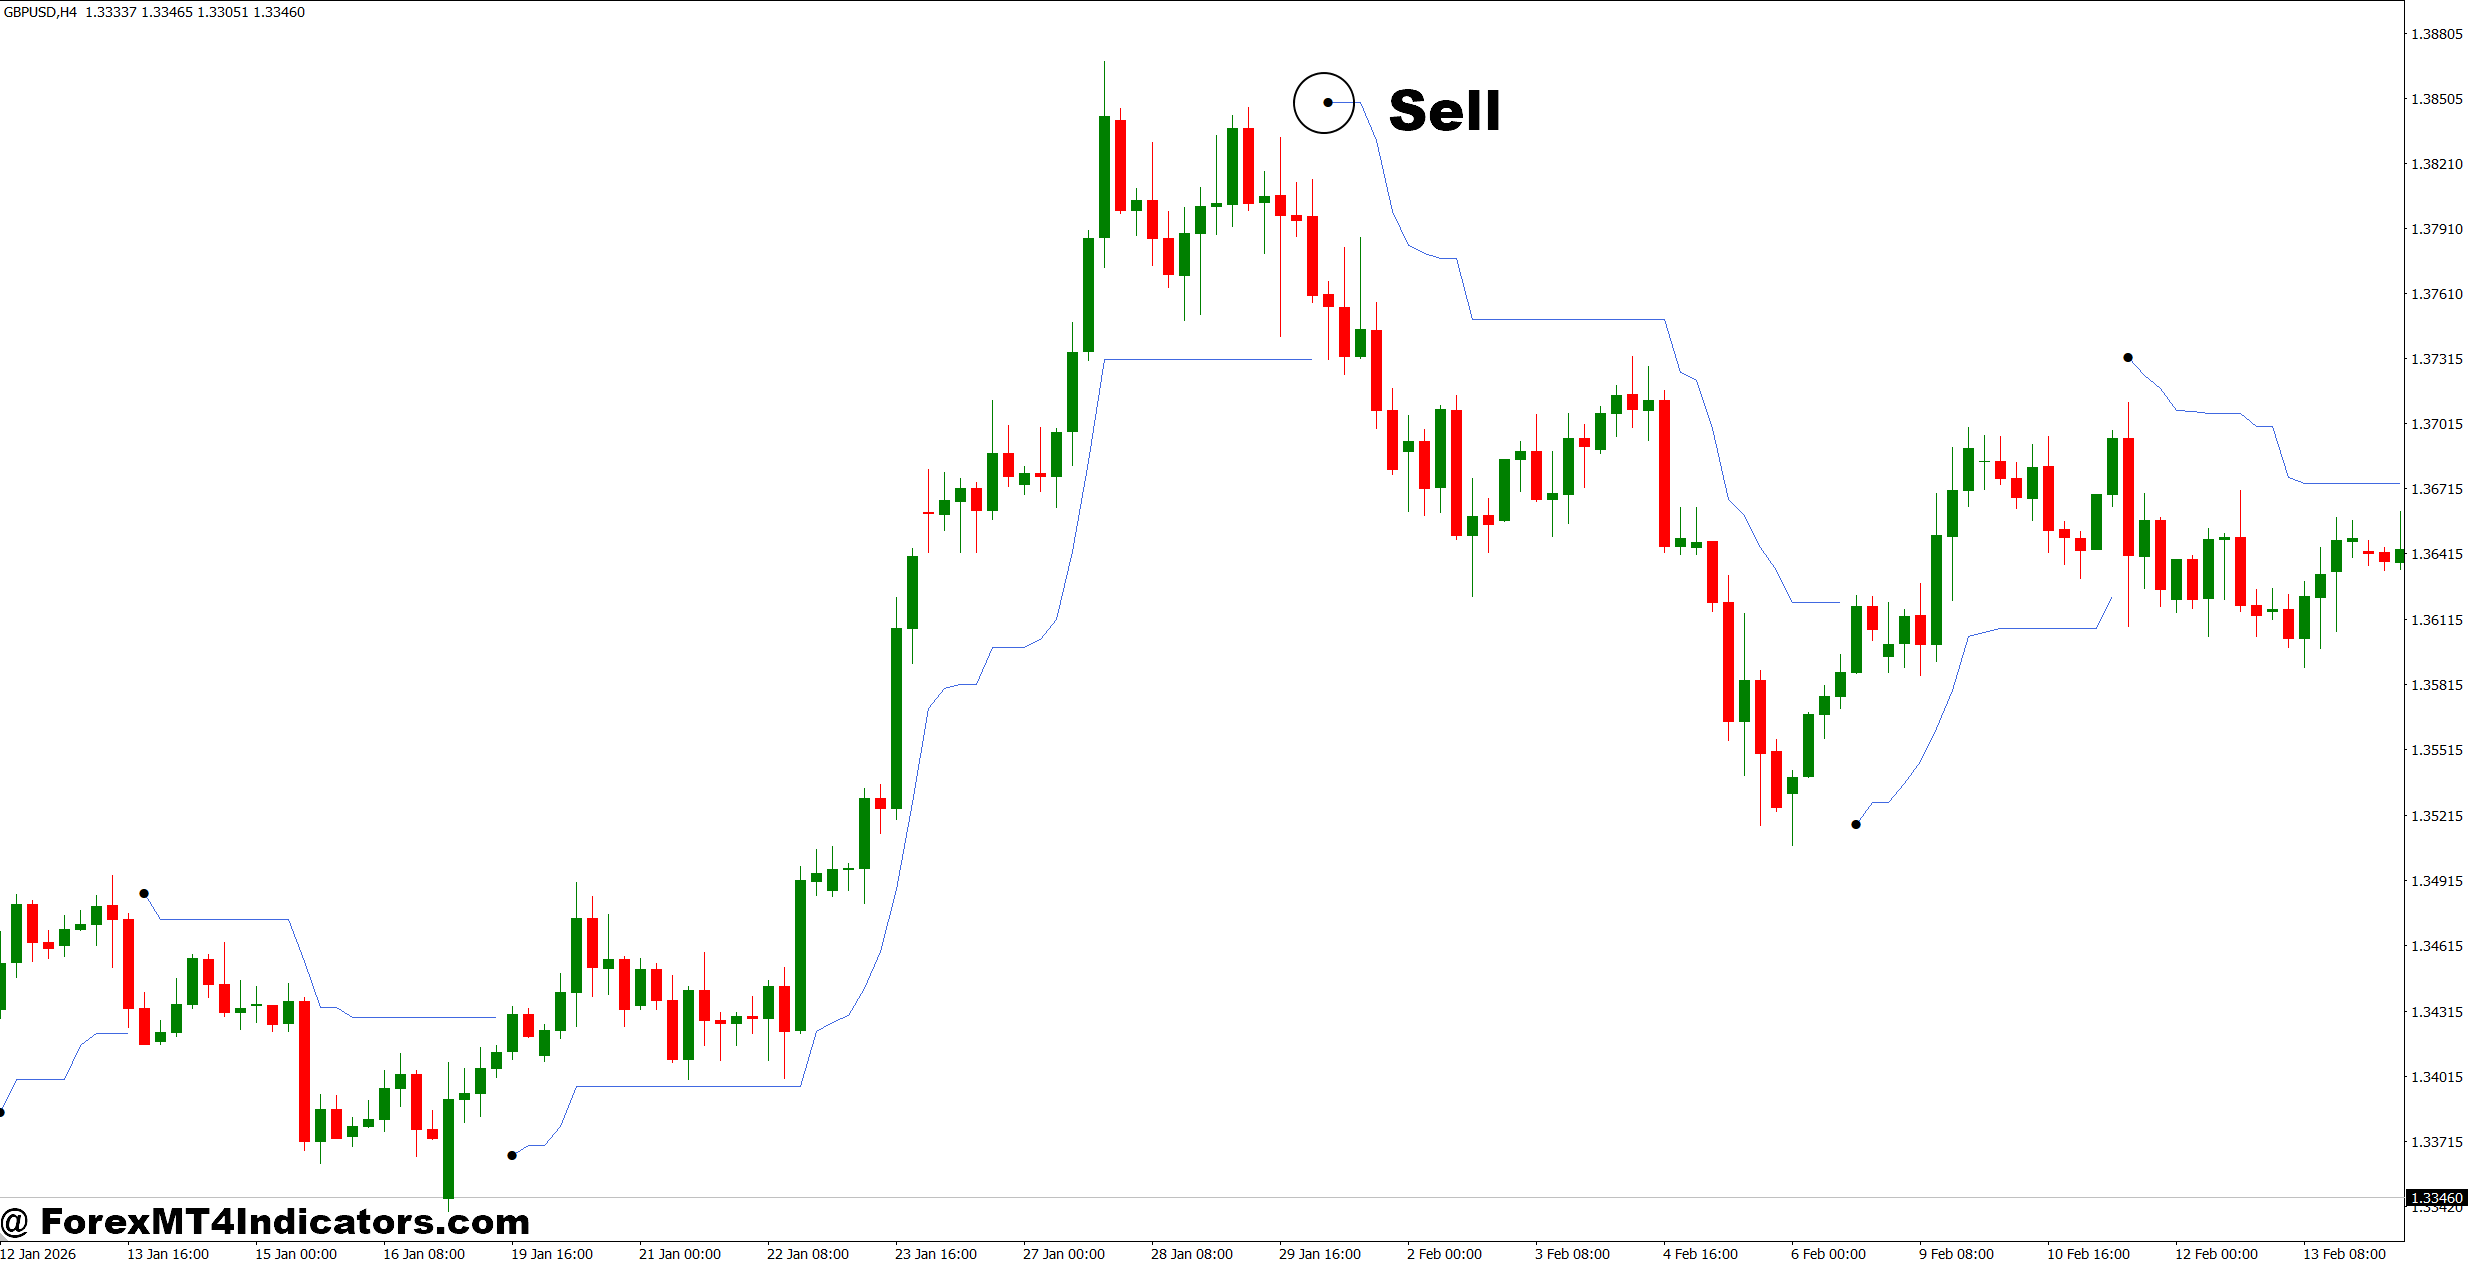
- Wait for a bearish ATR stop – Enter short when the indicator moves above price and GBP/USD closes below it on the 1-hour chart.
- Confirm support failure – Sell EUR/USD after a clean break of support by at least 10 pips with the ATR stop above price.
- Check the 4-hour direction – Favor SELL setups when the higher timeframe produces lower highs and lower lows.
- Place stops using volatility – Consider a stop around 1.5–2.0× ATR above the entry while respecting the latest swing high.
- Demand 1:2 risk-reward – With a 30-pip stop, look for approximately 60 pips of downside potential.
- Keep exposure controlled – Limit risk to around 1% of account equity, especially on volatile GBP pairs.
- Avoid late entries – Don’t sell after price has already fallen 50–70 pips without a fresh pullback or confirmation.
- Check the daily trend – Avoid aggressive SELL trades when the daily chart remains strongly bullish against the short setup.
Final Takeaways
The ATR Stop Indicator MT4 gives traders a practical way to adjust stop placement according to current market volatility. Its biggest value comes from combining a volatility measurement with actual price structure.
- Use ATR to estimate breathing room rather than choosing an arbitrary fixed stop.
- Check swing highs, swing lows, and support/resistance before accepting the indicator’s suggested distance.
- Adjust position size when stops become wider, especially during high-volatility sessions.
- Test settings by pair and timeframe, because an ATR multiplier that works on EUR/USD H1 may behave poorly on GBP/JPY M15.
The indicator won’t tell traders where the market is guaranteed to go. What it can do is make stop placement more systematic. The next useful step is to test several ATR periods and multipliers across at least 50–100 historical trades before relying on one setting in a live account.
Level up your trading
Learn to read the chart — not just the indicator
eBook · Instant PDF
Video Course · 12 modules
Recommended MT4/MT5 Brokers
- ✓ *FREE *$50 to start (withdrawable)
- ✓ Deposit bonus up to $5,000
- ✓ Negative balance protection
Trading forex and CFDs carries a significant risk of loss and is not suitable for everyone. Broker links are affiliate links — we may earn a commission at no cost to you.
Free MT4 Indicator Download

Enter Your Email Address below, download link will be sent to you.
