

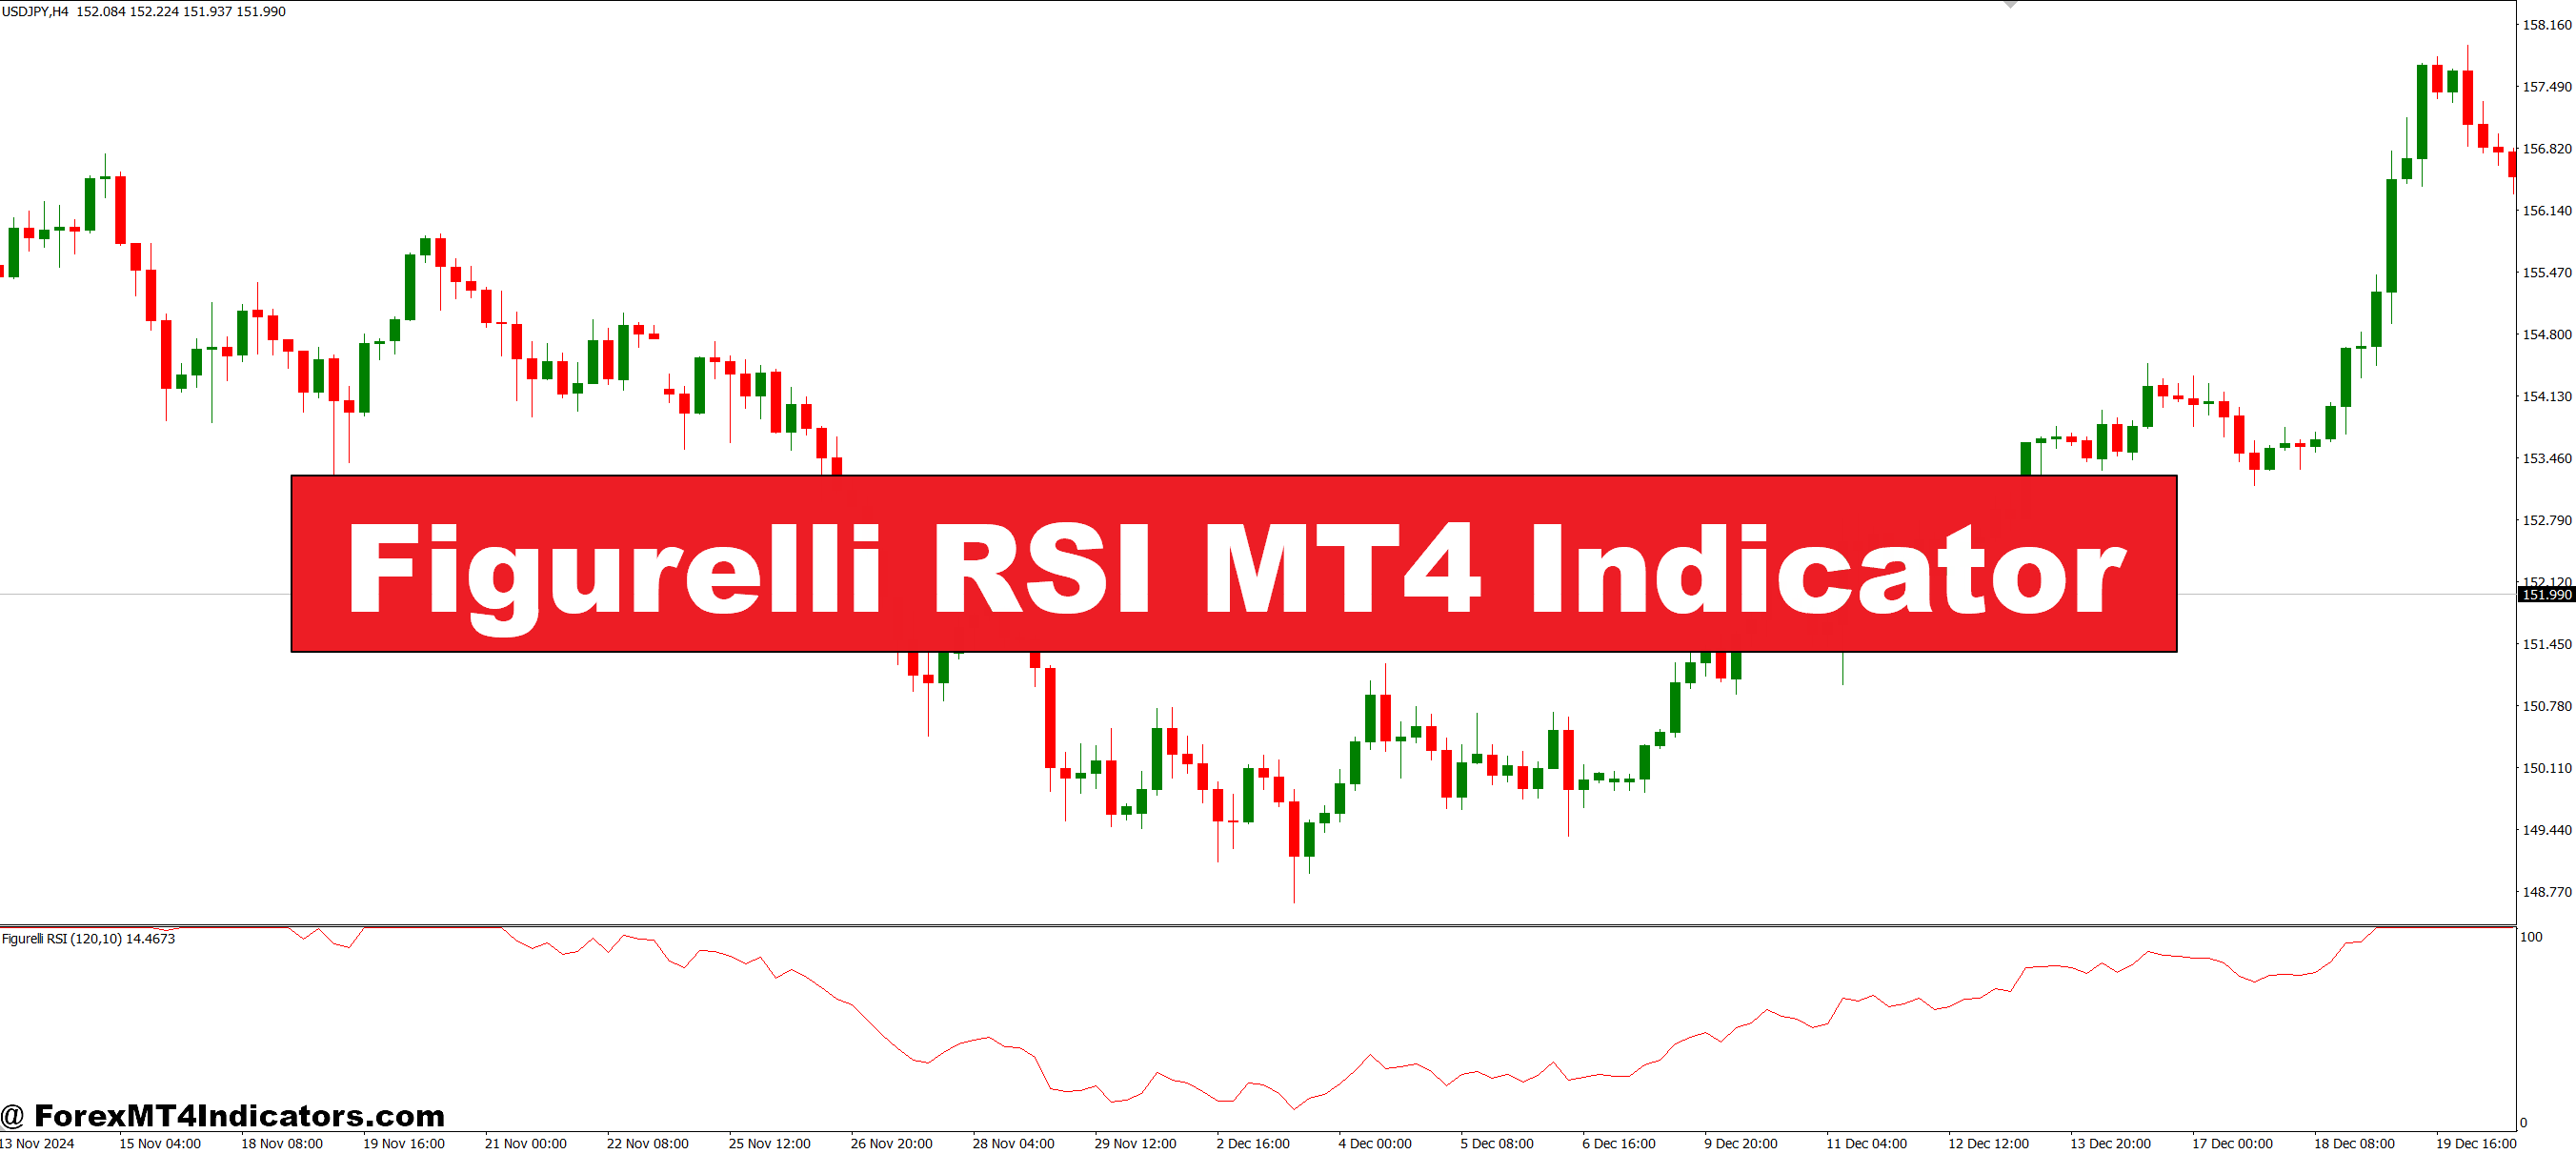
The Figurelli RSI is an advanced version of the classic Relative Strength Index. While the standard RSI often reacts too quickly to short-term market movements, this indicator reduces false signals by applying a smoother calculation. This makes it easier for traders to spot true overbought and oversold levels without second-guessing. By using it, they can filter out noise and focus only on strong trading opportunities.
Why Traders Prefer It Over Standard RSI
Most traders know the frustration of taking trades based on RSI only to see the market reverse immediately. The Figurelli RSI solves this by delivering more stable signals. Its strength lies in identifying real momentum shifts rather than short-lived spikes. This stability is especially helpful for swing traders and day traders who rely on precision. Instead of reacting to every small fluctuation, they get signals that align more closely with bigger market trends.
How It Improves Trading Strategies
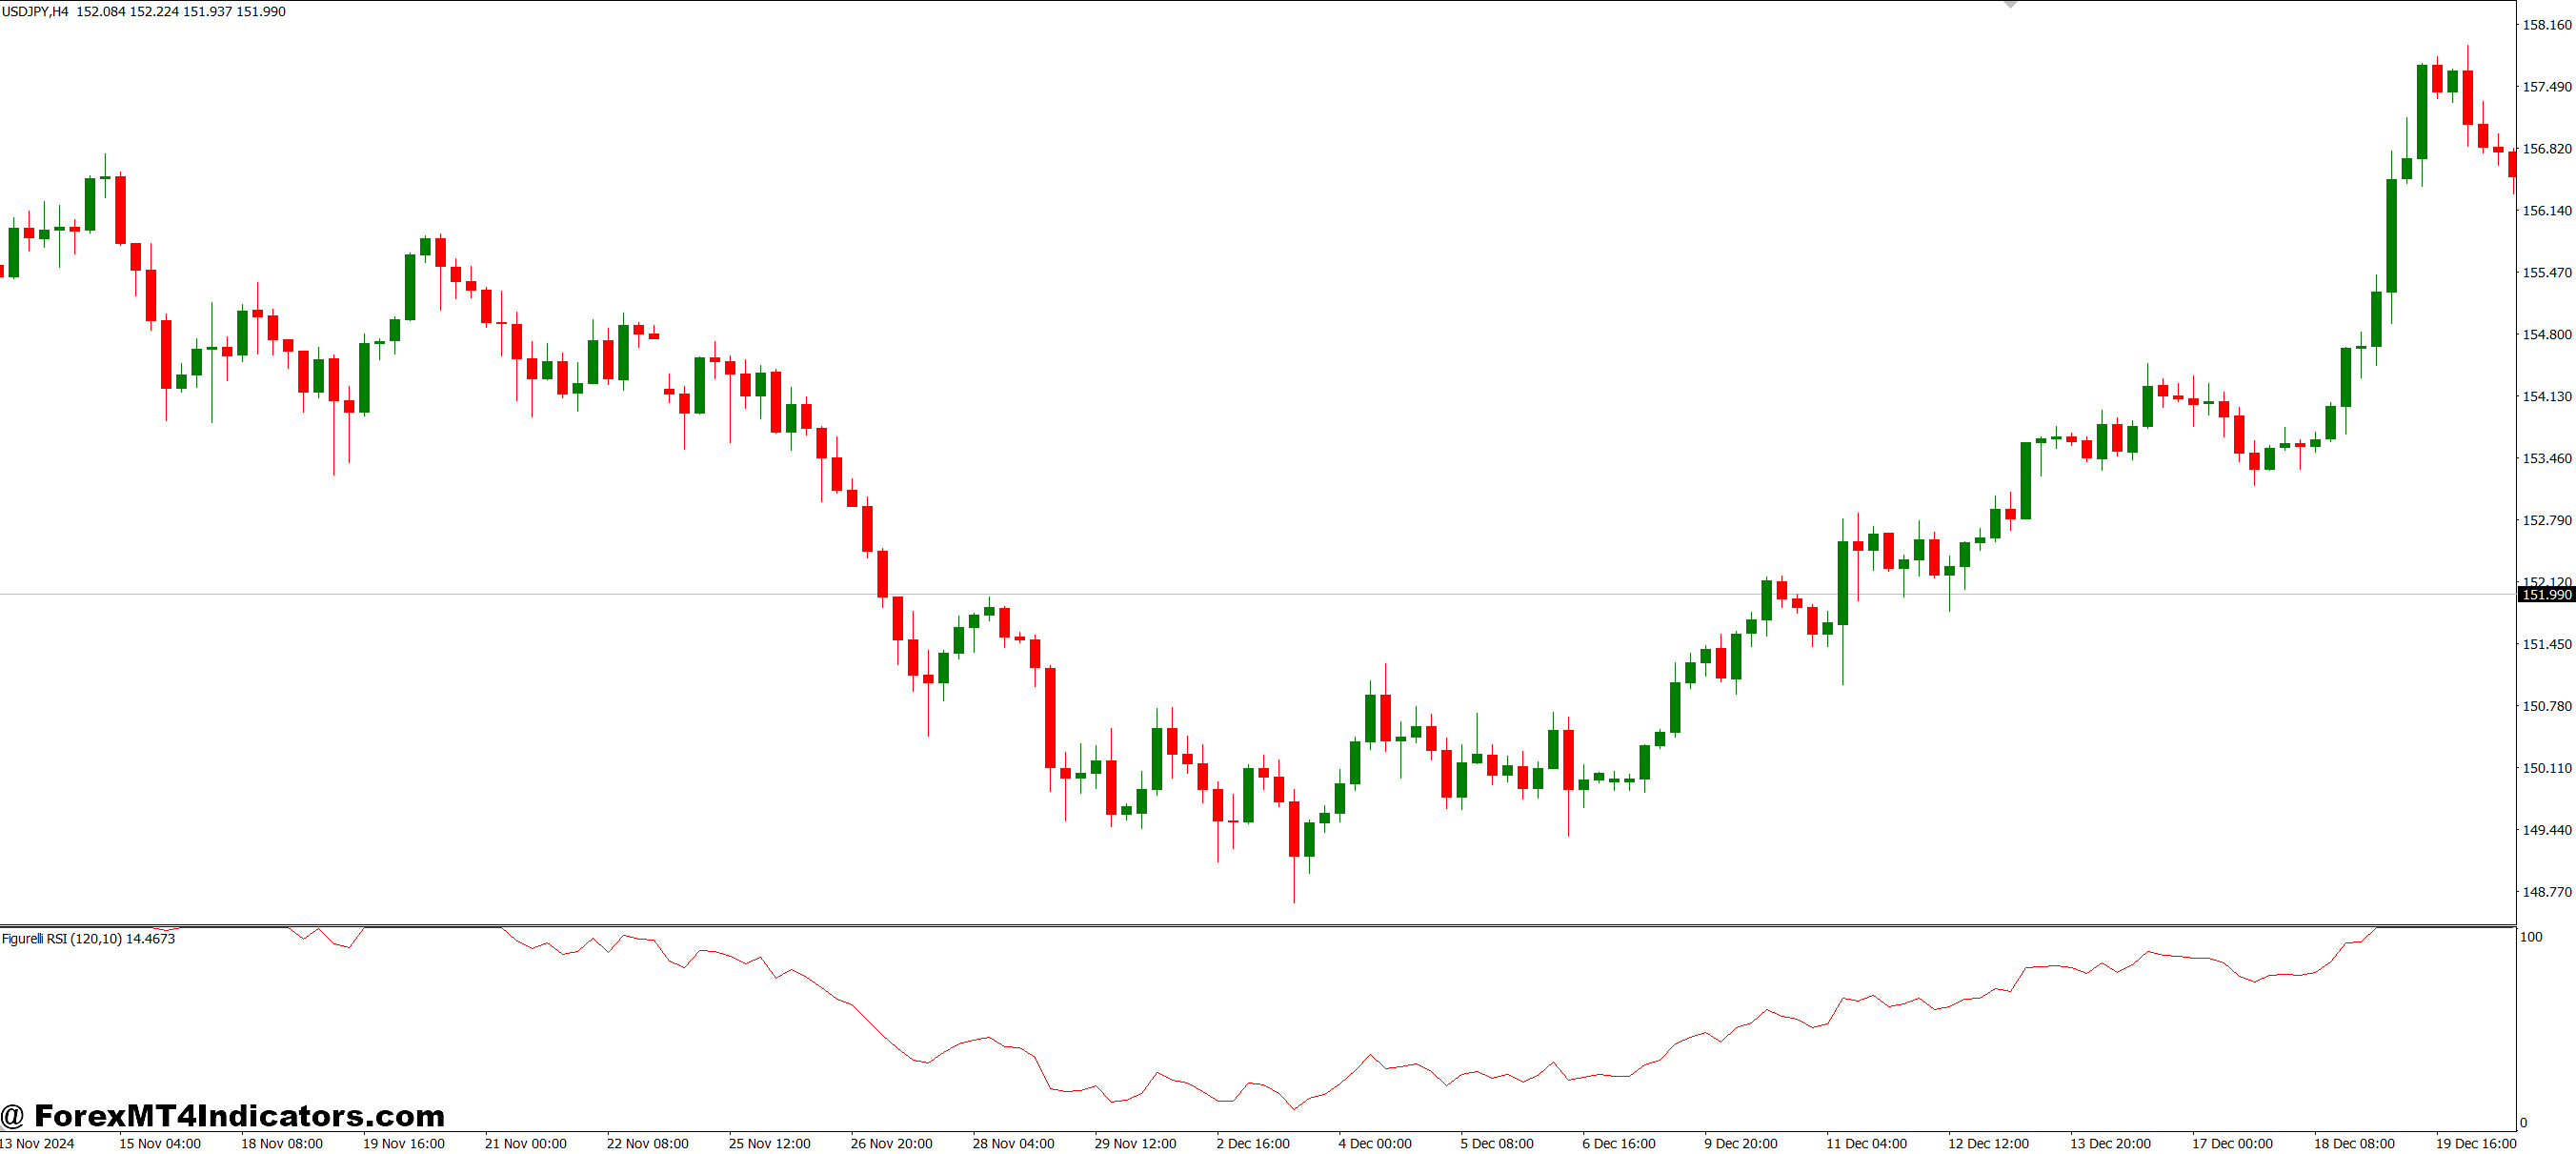
The Figurelli RSI MT4 Indicator can be applied across different timeframes and markets, from forex to commodities. Traders often combine it with moving averages, support and resistance zones, or candlestick patterns to confirm entries. When used correctly, it becomes a powerful tool for timing trades with less guesswork. It helps traders stick to a disciplined plan, reducing emotional decisions and improving overall consistency in their results.
How to Trade with Figurelli RSI MT4 Indicator
Buy Entry
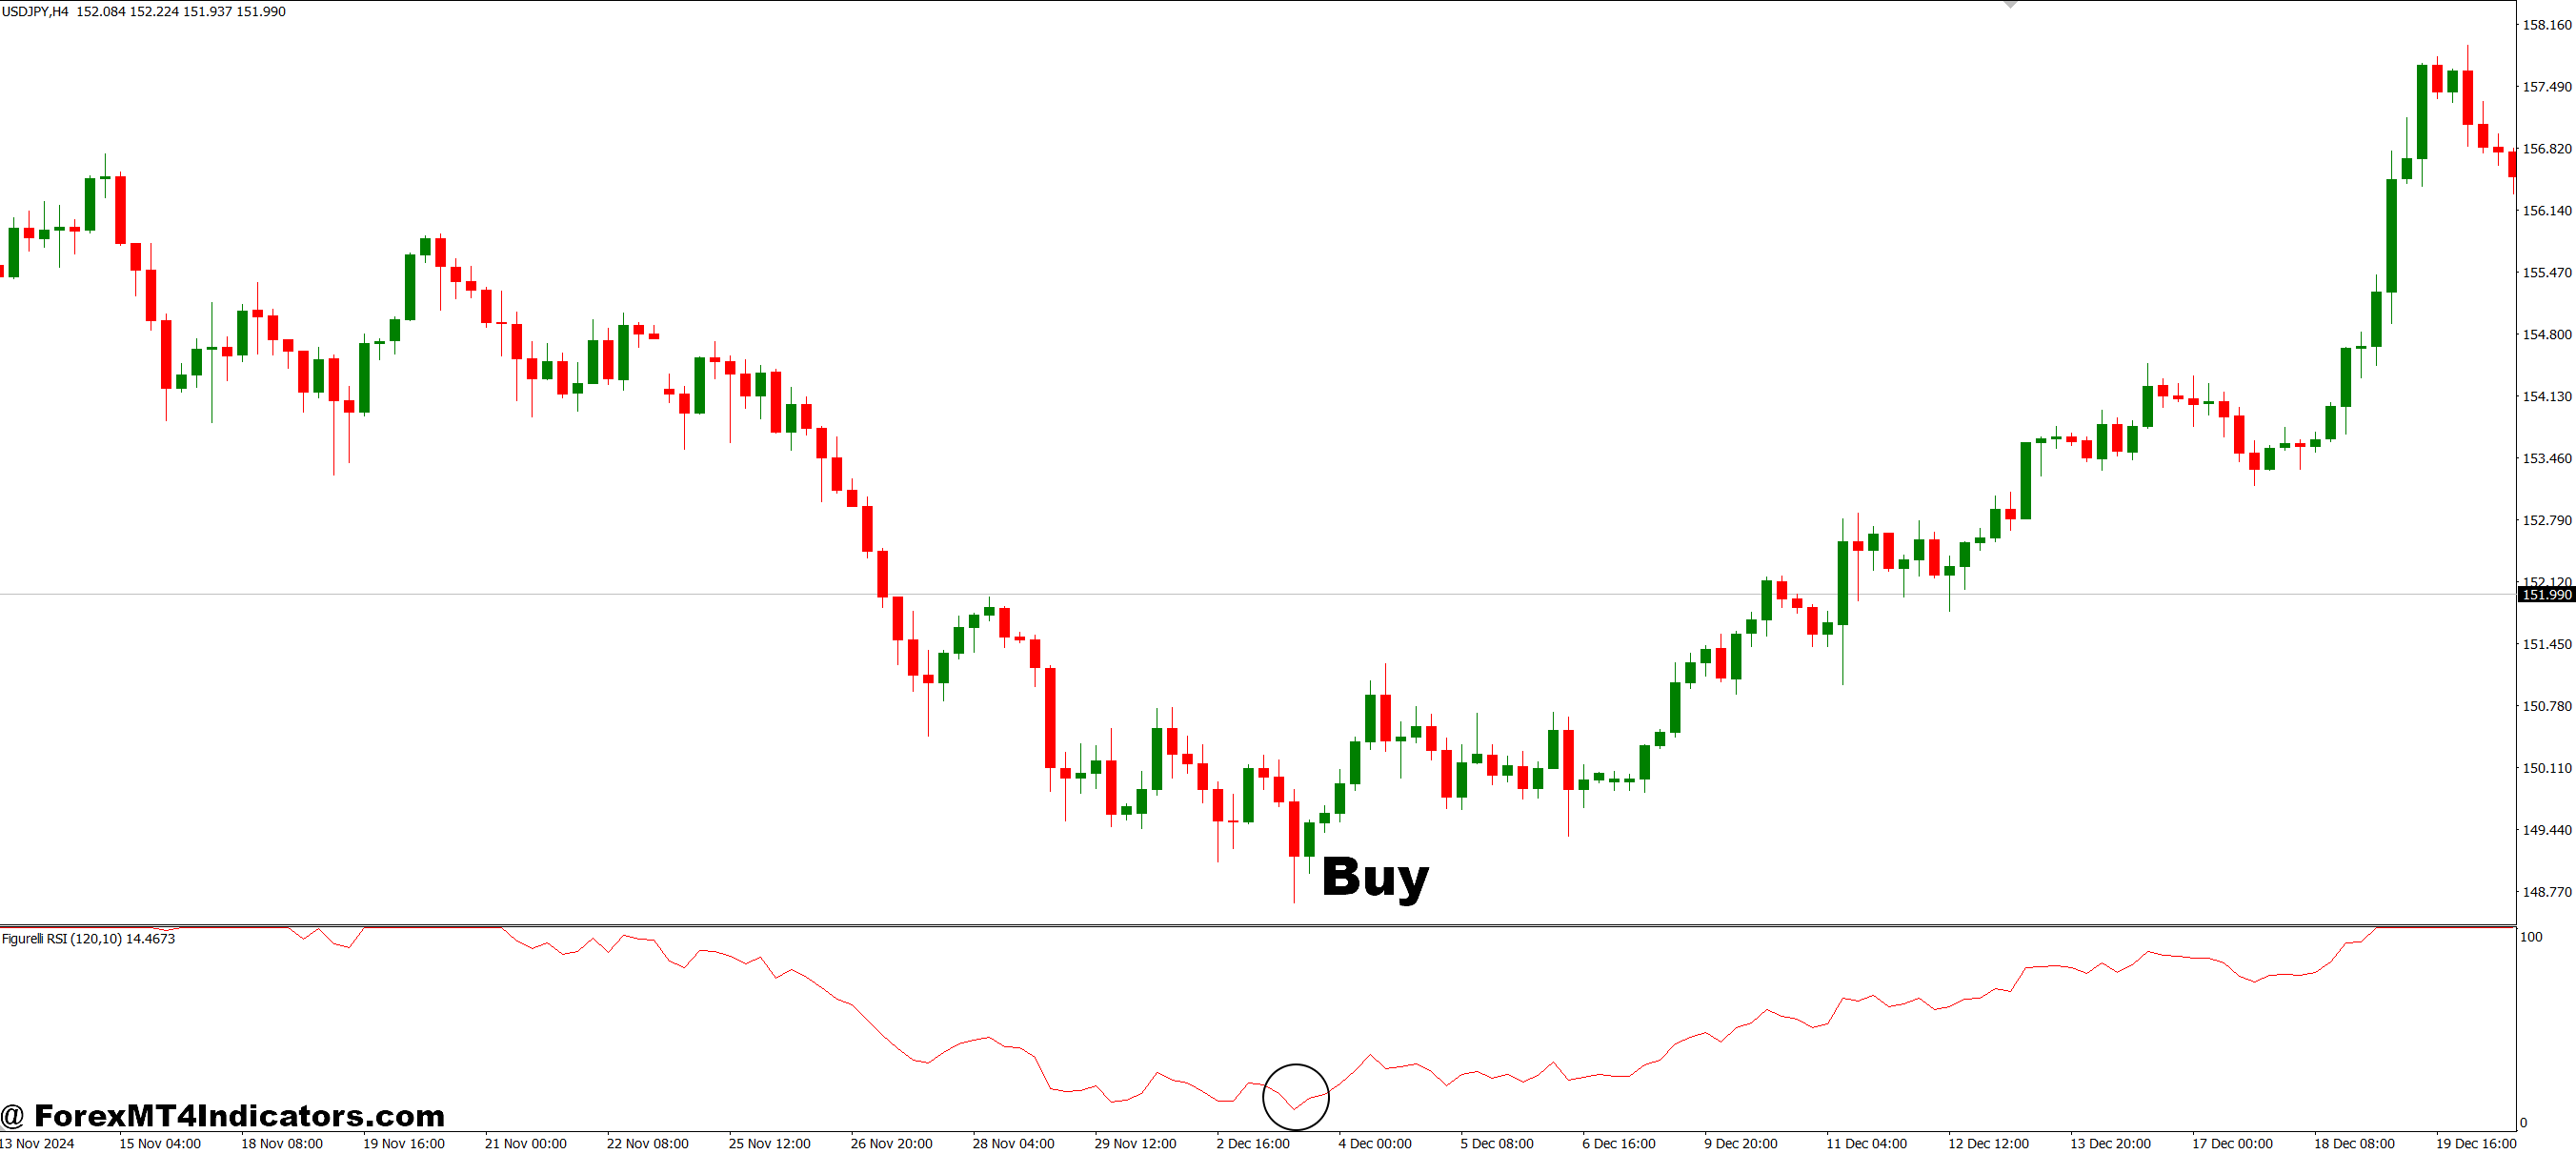
- Wait for the Figurelli RSI line to cross above the 30 level, signaling the end of oversold conditions.
- Confirm upward momentum if the line continues rising toward the mid-range (50).
- Look for price action confirmation, such as bullish candlestick patterns or a bounce from support.
- Enter a buy trade and place a stop-loss just below the recent swing low.
Sell Entry
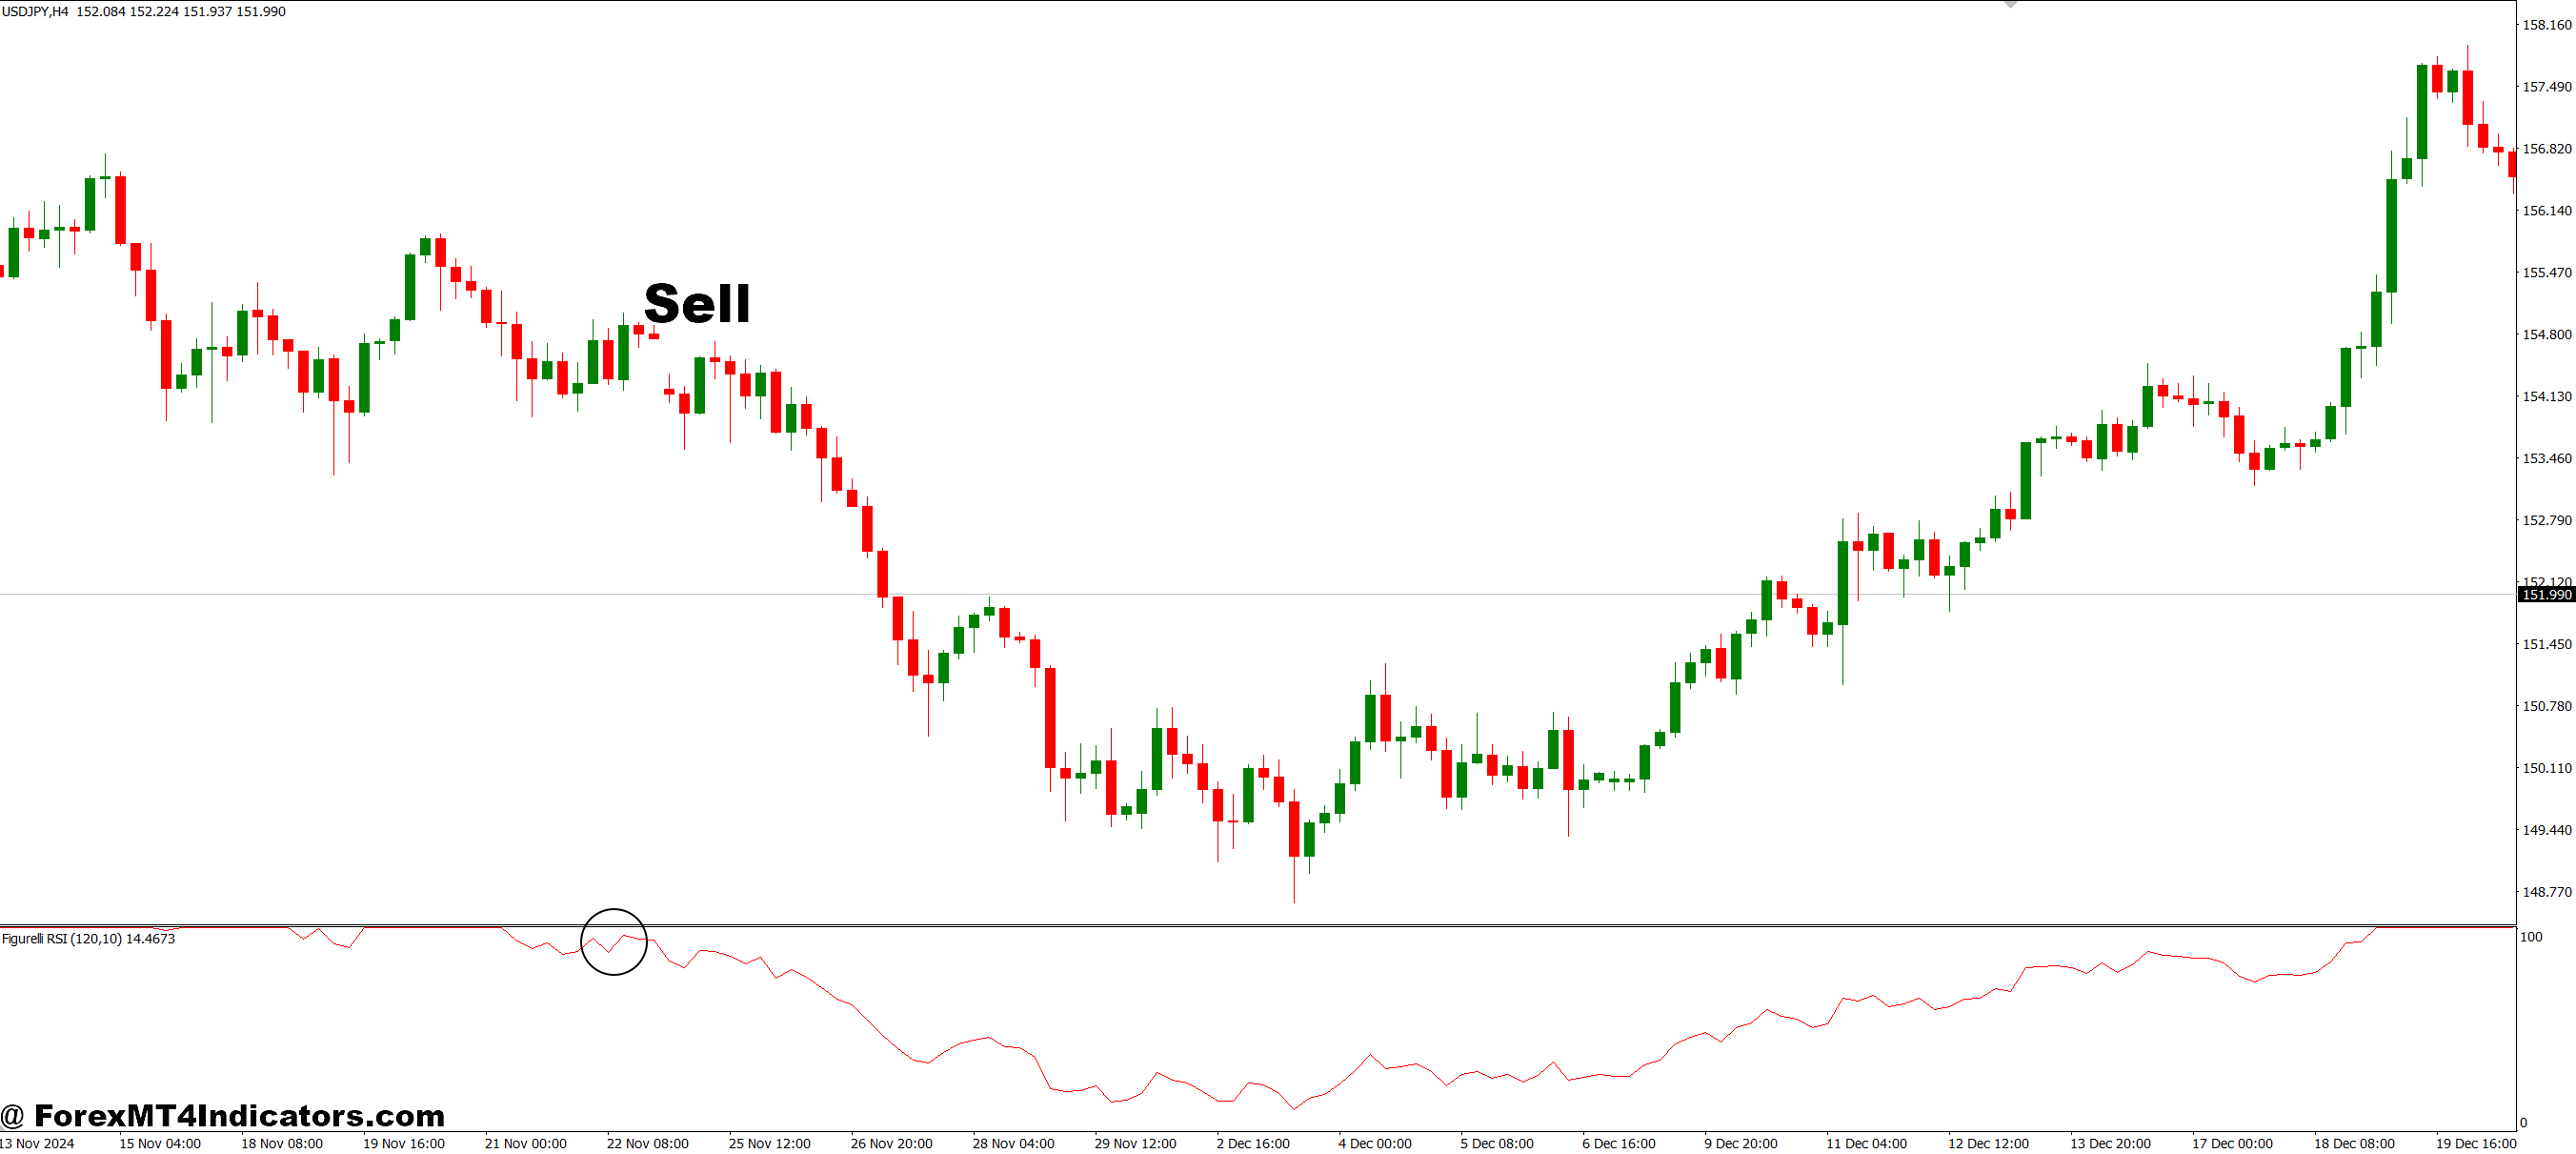
- Watch for the Figurelli RSI line to cross below the 70 level, indicating the end of overbought conditions.
- Confirm downward momentum if the line continues falling toward the mid-range (50).
- Check for bearish candlestick patterns or rejection from resistance.
- Enter a sell trade and place a stop-loss just above the recent swing high.
Conclusion
The Figurelli RSI MT4 Indicator offers a smarter, smoother approach to momentum trading. Filtering out noise and giving more accurate signals helps traders avoid false entries and focus on stronger opportunities. Whether they’re beginners or experienced traders, those who add this tool to their strategy can gain better insights and trade with greater confidence.
Level up your trading
Learn to read the chart — not just the indicator
eBook · Instant PDF
Video Course · 12 modules
Recommended MT4/MT5 Brokers
- ✓ *FREE *$50 to start (withdrawable)
- ✓ Deposit bonus up to $5,000
- ✓ Negative balance protection
Trading forex and CFDs carries a significant risk of loss and is not suitable for everyone. Broker links are affiliate links — we may earn a commission at no cost to you.
Free MT4 Indicator Download

Enter Your Email Address below, download link will be sent to you.