

Last updated: August 31, 2026 · By: Tim Morris
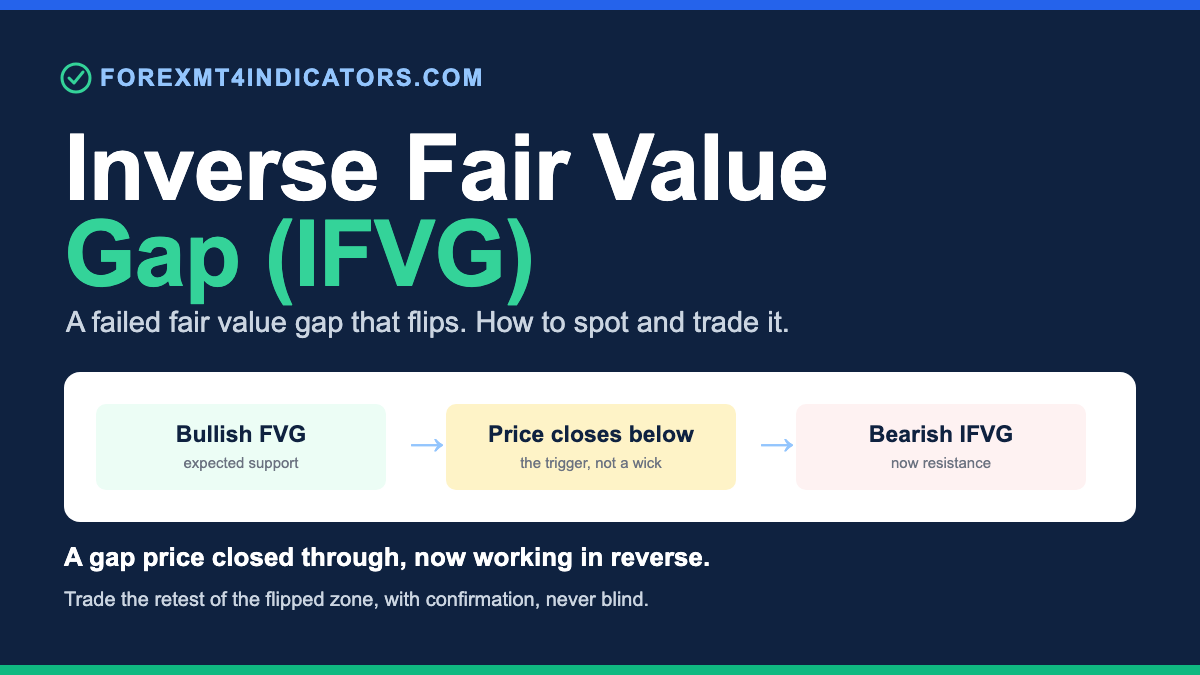
An inverse fair value gap (IFVG) is a fair value gap that price has traded through and closed beyond, flipping its role. A bullish FVG that price closes below becomes a bearish IFVG, so old demand now acts as resistance. A bearish FVG price closes above becomes bullish support. It marks a shift in order flow.
What is an inverse fair value gap?
An inverse fair value gap is a failed fair value gap. Price entered the imbalance, did not respect it as support or resistance, and closed clean on the other side. The zone that traders expected to hold instead gave way.
Once that happens, the reading flips. A gap that should have been demand and failed becomes a supply zone on the way back up. A gap that should have been supply and failed becomes a demand zone on the way back down.
This idea comes out of Smart Money Concepts and ICT teaching. It is discretionary. The IFVG describes a tendency in order flow, not a rule the market is forced to obey, and most retail traders lose money treating tendencies as guarantees.
The core value of an IFVG is context. When a fair value gap fails, it tells you the side that was in control lost the level. That failure often, not always, precedes a move in the opposite direction, which is why traders track it. For the base concept underneath all of this, read our fair value gap guide first.
How does an inverse fair value gap form?
Start with a normal three-candle imbalance. On a bullish FVG, the middle candle rips higher and leaves untraded space between the first candle’s high and the third candle’s low. Traders expect price to return and hold that space as support.
The flip begins when price returns but does not hold. Instead of bouncing out of the gap, price pushes into it and a candle closes below the entire gap. The close is the trigger, not a wick. A wick that pokes through and recovers has not inverted anything.
Once a candle body closes below that bullish gap, the zone inverts. It stops being demand and starts acting as supply. The same levels that traders bought are now the levels sellers defend on any retest from below. That is a bearish IFVG.
The bearish-to-bullish version is the mirror. A bearish FVG leaves untraded space where price dropped fast. If price later rallies back and a candle closes cleanly above the whole gap, that resistance zone flips into support. That is a bullish IFVG.
The word doing the work in both cases is “closes.” A close through the gap is a decision by the market. A wick is a test. On lower timeframes like M5 you will see more fake closes, which is one reason many traders read IFVGs on H1 and H4 where the closes carry more weight.
How to spot an inverse fair value gap
You are looking for two events in sequence. First, an existing fair value gap. Second, a candle that closes fully through it, invalidating the original read.
The invalidation is step one: mark the fair value gap, then watch for the body close on the far side. Until that close prints, you have a normal FVG that price is testing. After the close, you have a flipped zone and a new bias.
The retest is step two, and it is where the trade lives. Price rarely reverses the instant a gap inverts. It tends to run a bit, then come back to the flipped zone from the new side. That return is your setup, not the initial close.
Draw the zone from the edges of the original gap. On a bullish FVG that flipped bearish, the zone runs from the old gap high to the old gap low, and you now expect it to reject price from underneath. Wait for price to tap into that band and stall.
Confirmation matters on the retest. A rejection wick, a bearish engulfing candle, or a lower-timeframe break of structure inside the zone all raise the odds. Entering the moment price touches the level, with no confirmation, is one of the most common ways this setup burns accounts.
An order block sitting inside or right beside the flipped zone is a strong confluence. When the last opposing candle before the original move overlaps your IFVG, two SMC concepts point at the same level. For how these gaps sit inside the wider framework, see the smart money concepts guide.
How to trade an inverse fair value gap
Here is a deliberately conservative worked example on EUR/USD. Treat every number as illustration, not a signal. The goal is to show the mechanics, not to hand you a level to trade live.
Say price prints a bullish fair value gap on H1 between a candle-one high of 1.0910 and a candle-three low of 1.0935, a 25-pip imbalance. Traders expect that band to hold as support on a pullback.
Price pulls back into the gap and does not hold. An H1 candle closes at 1.0898, fully below the 1.0910 gap low. The bullish FVG has failed and inverted. The band 1.0910 to 1.0935 is now a bearish IFVG, a supply zone.
You do not chase the close. You set a sell limit into the flipped zone, planning to sell the retest from below. A conservative entry sits near the lower edge, around 1.0912, rather than at the far top, so you are not the last one in.
Your stop goes beyond the zone, above the old gap high, with a buffer for noise: place it around 1.0945, roughly 33 pips of risk from 1.0912. The logic is simple. If price closes back above 1.0935, the inversion has itself failed and the idea is wrong.
For a 2:1 target, project twice the risk. With 33 pips of risk, aim about 66 pips lower, near 1.0846, ideally where prior structure or an opposing FVG already sits. That gives the trade a reason to stop, not an arbitrary round number.
The confirmation layer still applies. If price retests 1.0912 and a bullish engulfing candle prints instead of a rejection, you stand aside even though the limit was hit. A zone tag without rejection is not a trade.
On gold this whole framework needs more room. XAU/USD often ranges $20 to $50 an ounce in a day, so a flipped zone can be several dollars wide on its own, and a stop sized for EUR/USD would sit inside the noise. On gold you widen the zone in price distance, widen the stop, and cut the position size so the cash risk stays the same.
Inverse fair value gap vs a regular fair value gap
The cleanest way to separate them is by what price has already done to the gap. A regular fair value gap is unfilled. An inverse fair value gap is filled and failed.
A regular FVG is an untraded imbalance you expect price to return to and react from. It is a magnet. The bias is that price comes back to fill the inefficiency, then often continues in the original direction.
An IFVG is a gap price has already closed through. The original expectation broke, so the read reverses. Instead of a magnet you expect price to bounce out of, you have a barrier you expect price to reject off from the new side.
Direction of bias is the giveaway. With a fresh bullish FVG you lean long on the fill. With that same gap after a close below it, you lean short on the retest. Same three candles, opposite trade, because the close changed everything.
They are not competitors, they are stages. A gap is a normal FVG right up until price closes through it, then it becomes an IFVG. Understanding the transition is more useful than memorising two separate patterns. For the related distinction between raw imbalance and a tradeable gap, see imbalance vs FVG.
Common mistakes traders make with inverse fair value gaps
Trading the flip without a close through. A wick into the gap that recovers is not an inversion. If the candle body did not close on the far side, nothing flipped, and you are trading a normal FVG test in the wrong direction.
Ignoring the higher-timeframe trend. A bearish IFVG on H1 inside a strong H4 uptrend is fighting the current. These setups work best when the flip agrees with the higher-timeframe bias, not against it. Counter-trend IFVGs need much stronger confirmation.
No confirmation on the retest. Entering the instant price touches the flipped zone, with no rejection candle or structure break, is guessing. The retest is where you read whether the zone is actually holding. Wait for the reaction.
Treating the IFVG as certainty. This is a probability, not a promise. Flipped zones fail like anything else, especially around news. If your plan only survives when the IFVG works, the plan is too fragile.
Too-tight a stop. Placing the stop right at the zone edge, with no buffer, gets you wicked out before the move. The stop belongs beyond the zone plus a noise buffer, and on gold that buffer is far wider than on EUR/USD.
Marking every gap as a potential IFVG. Most fair value gaps never invert. Watching dozens of zones for a flip that may not come leads to forced trades. Track the gaps near meaningful structure, not every three-candle sequence on the chart.
How indicators help detect inverse fair value gaps
Marking gaps by hand across several pairs and timeframes is slow and easy to get wrong. An indicator can plot every fair value gap automatically and, on some builds, highlight the moment a gap is closed through and inverted.
That saves screen time and removes some of the eye-strain guesswork about where a gap’s exact edges sit. A tool draws the box, tracks the close, and flags the flip so you are not scrolling back through candles to confirm it. Our fair value gap indicator for MT4 handles the detection and drawing.
The honest limit is the same one that applies to every SMC tool. An indicator marks the gap and the inversion. It does not decide whether that particular flip is worth trading, whether it aligns with the higher-timeframe trend, or whether the retest showed real rejection. That judgement stays with you.
Use the indicator to find candidates faster, then apply your own filters: trend alignment, confluence with an order block, and confirmation on the retest. A tool that draws a hundred zones is only useful if you are trading the two that matter. Many of those flipped zones exist to become exit liquidity for traders who entered without confirmation.
Frequently asked questions
What is an inverse fair value gap in simple terms?
It is a fair value gap that failed. Price traded into the gap and closed clean through it instead of respecting it, so the zone flips its role. Old support becomes resistance, or old resistance becomes support, and traders then look to trade the retest of that flipped zone.
What is the difference between an FVG and an IFVG?
An FVG is an unfilled imbalance you expect price to return to and react from. An IFVG is that same gap after price has closed through it, so the read reverses. The FVG is a magnet you trade toward; the IFVG is a barrier you trade off from the opposite side.
How do you confirm an inverse fair value gap?
Two things must happen. A candle body must close fully through the original gap, not merely wick through it, which invalidates the old read. Then price should retest the flipped zone from the new side and show rejection, like a rejection wick or an engulfing candle, before you enter.
Do inverse fair value gaps work on gold?
The concept works, but gold needs more room. XAU/USD often ranges $20 to $50 an ounce a day, so flipped zones are wider in price distance and noise is larger. You widen the zone and the stop, place the stop well beyond the zone, and cut position size so your cash risk stays the same as on a tighter EUR/USD trade.
Which timeframe is best for trading IFVGs?
H1 and H4 tend to give cleaner signals because the closes through a gap carry more weight and there are fewer fake breaks. Lower timeframes like M5 produce more inversions, but many are noise. A common approach is to read the flip on H1 or H4 and time the entry one timeframe down.
Are inverse fair value gaps reliable?
No pattern is reliable on its own, and most retail traders lose money. An IFVG is a tendency in order flow, not a guarantee. It works best with confluence: agreement with the higher-timeframe trend, a nearby order block, and clear rejection on the retest. Traded blindly, flipped zones fail as often as any other level.
Trading forex and CFDs carries a high level of risk and is not suitable for everyone. Most retail traders lose money. Nothing here is financial advice; it is educational content only. Always do your own analysis and never risk money you cannot afford to lose.
Ready to put this into practice?
Open an account with a regulated broker and apply what you have learned. These are the three brokers we recommend:
Trading forex and CFDs carries a significant risk of loss and is not suitable for everyone. Broker links are affiliate links — we may earn a commission at no cost to you.