


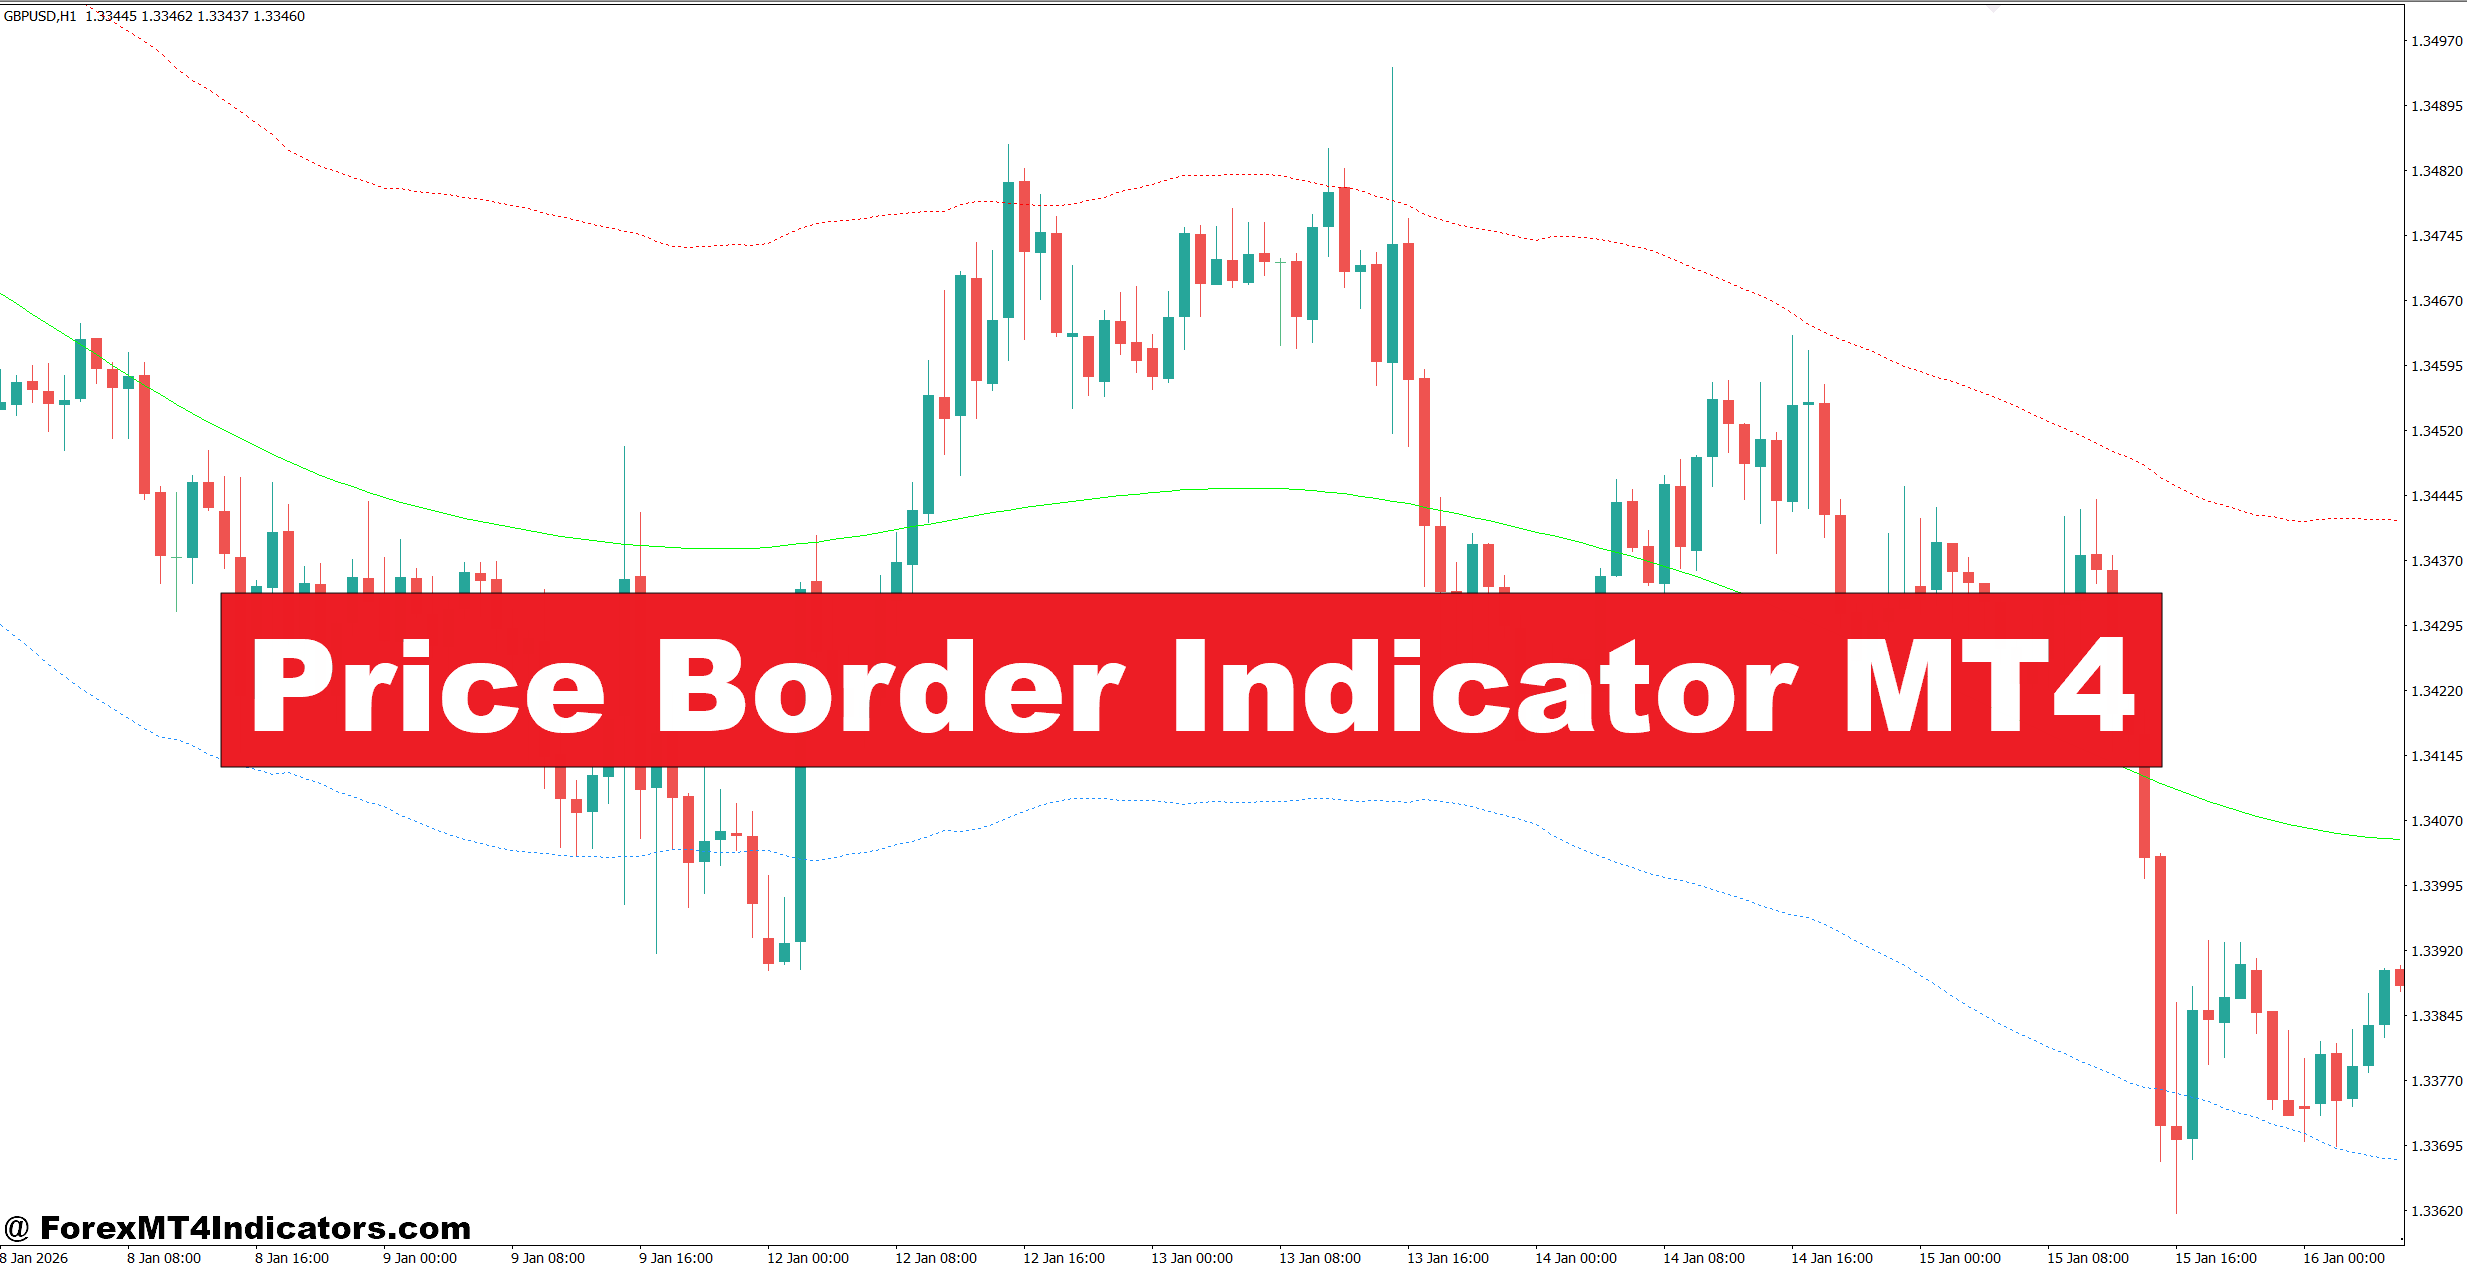
The Price Border Indicator is a custom MT4 channel indicator designed to show three important price areas: an upper border, a middle line, and a lower border. The outer levels can act as dynamic resistance and support, while the center line helps traders judge whether price is generally bullish or bearish. Its structure is similar to other envelope-style tools such as Bollinger Bands.
Some versions of the indicator are described as combining a Half-Length calculation with ATR-based bands. ATR, or Average True Range, measures recent market volatility. As volatility expands, an ATR-based channel can widen; when price movement becomes quieter, the distance between the bands can shrink.
That matters because a fixed 20-pip channel would behave very differently on EUR/USD during a quiet Asian session than during a major U.S. economic release.
The middle line also gives traders a simple trend filter. When price holds above it, bullish conditions may have more weight. When price remains below it, bearish pressure may be stronger. Still, a single line should never replace market structure.
How the Calculation Logic Helps
The exact formula can vary between Price Border versions, so traders should check the inputs of the specific MT4 file they install. In ATR-based versions, the basic concept is straightforward:
Upper Border = Central Price Line + Volatility Adjustment
Lower Border = Central Price Line − Volatility Adjustment
The volatility adjustment is commonly linked to ATR and a multiplier. For example, if ATR on EUR/USD H1 is 12 pips and the channel uses a 1.5 multiplier, the volatility component would be roughly 18 pips. The actual indicator may use a different calculation, so that figure should be treated as an illustration rather than a fixed setting.
This is also why traders should avoid assuming that a band represents a permanent support or resistance level. It moves with the market.
How Traders Can Read Price Border Signals
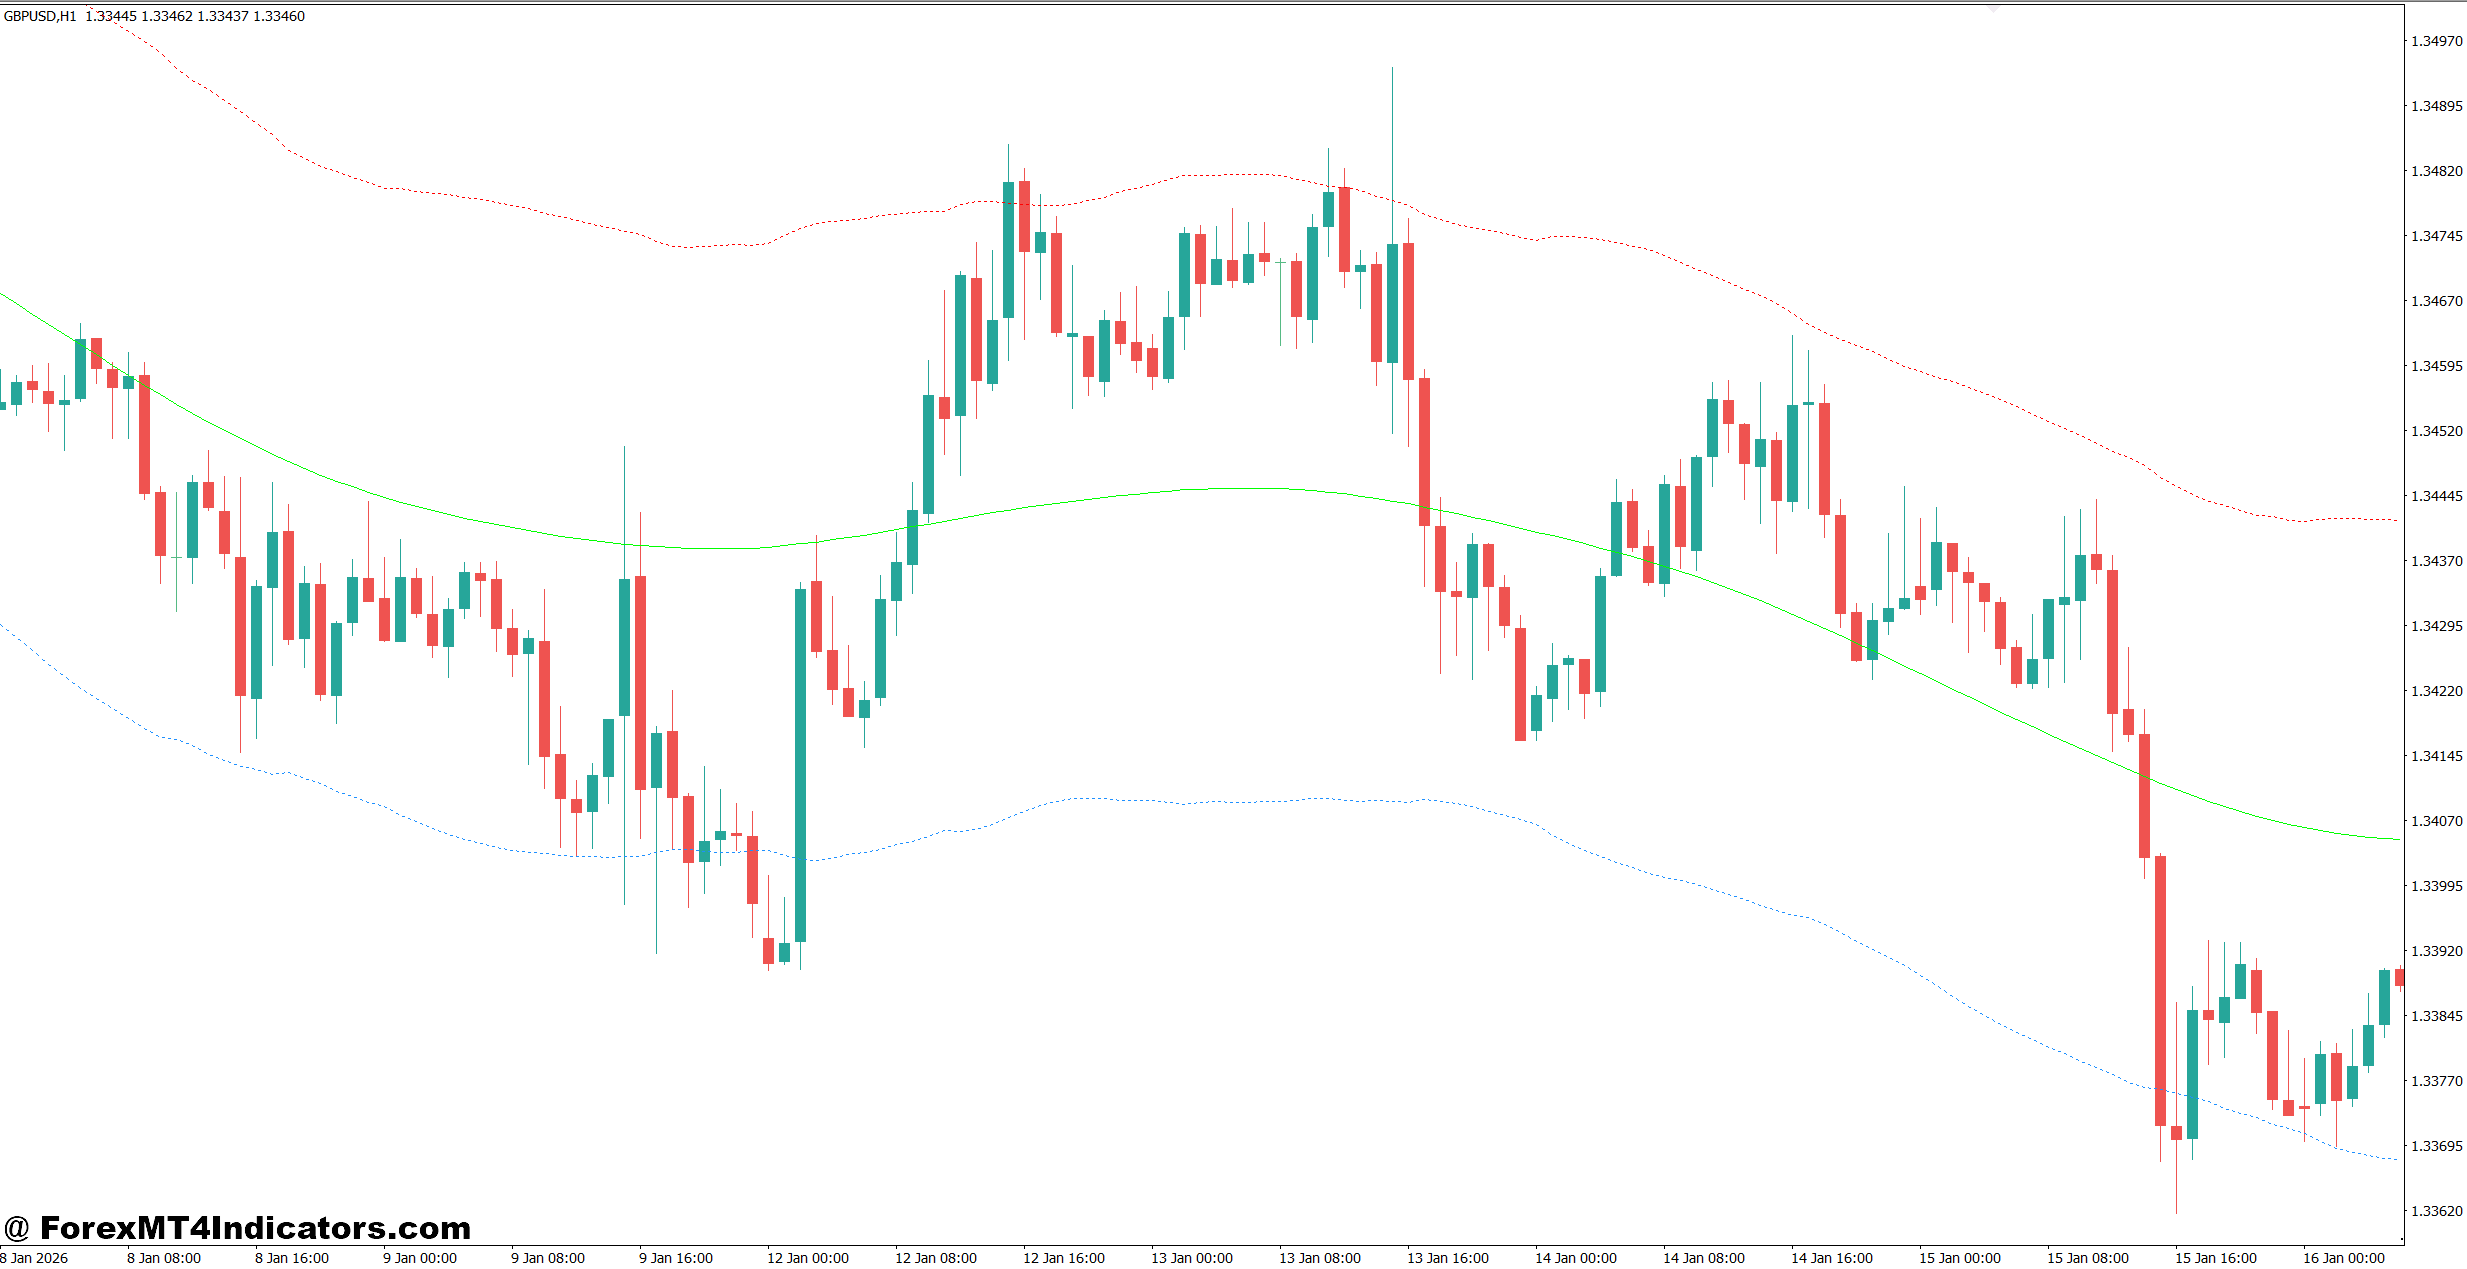
The most useful approach is to combine the borders with price action instead of entering immediately when price touches a line.
Suppose EUR/USD on the H1 chart drops toward the lower border after a 60-pip decline. The candle briefly moves 8 pips below the lower band but closes back inside it. If the next candle forms a bullish engulfing pattern near a previous H1 support level, the setup becomes more interesting. A trader could consider a buy above the confirmation candle, with the stop placed below the recent swing low.
For example, if entry occurs at 1.0840 and the swing low sits at 1.0818, the initial stop is 22 pips away. A first target near 1.0875 would provide roughly 35 pips of potential reward, giving the trade a reward-to-risk ratio above 1.5:1.
The same logic works in reverse.
On GBP/USD H1, imagine price rallies 45 pips into the upper border and forms a bearish rejection candle. If that area also matches a previous resistance zone, traders have stronger evidence for a possible short. A setup around 1.2760 with a stop at 1.2790 would risk 30 pips. A target near 1.2700 would offer about 60 pips, or roughly 2:1 reward-to-risk.
But there is a catch. During a powerful trend, price can remain near an outer band for several candles. Selling simply because price touches the upper border can produce repeated losses during a strong bullish move. This is one of the main weaknesses of channel-based reversal systems.
Settings, Timeframes, and Practical Use
Price Border can be applied across multiple timeframes, but the way traders interpret it should change with the chart. Lower timeframes tend to produce more noise and false breaks, while higher timeframes usually provide cleaner structural information.
For scalping, an M5 or M15 chart can be tested with tighter risk controls. A trader might look for a 5–12 pip reaction on EUR/USD, but spread and execution costs become much more important.
For day trading, M30 and H1 are often easier to manage. A trader can use H4 to identify the broader direction and H1 for the entry. For example, if H4 price is above the middle border while H1 pulls into the lower border, the trader can wait for a bullish candle rather than automatically shorting the H1 move.
Swing traders can test H4 and Daily charts. A 50-pip distance on H4 may be normal for one pair but unusually large on another, so position size should be based on the stop distance rather than a fixed lot size.
When testing the indicator, traders should record at least 50 to 100 historical setups for each pair and timeframe. That gives them a better idea of how often band touches actually lead to useful reversals.
Advantages, Limitations, and Comparison With Other Indicators
One advantage of the Price Border Indicator is simplicity. Three lines can provide a quick visual reference for trend direction, potential extremes, and dynamic levels. It can also complement support and resistance analysis instead of forcing traders to draw every level from scratch.
Compared with Bollinger Bands, Price Border is more focused on its specific channel and swing-zone presentation. Bollinger Bands normally use a moving average with standard deviation to measure dispersion, while ATR-based Price Border versions use volatility through ATR.
Compared with a plain moving average, Price Border gives more information about price location. A 50-period EMA can show direction, but it doesn’t create an upper and lower volatility envelope.
The limitations deserve equal attention. Strong trends can push price along an outer band for a long time. Ranging markets can also create frequent touches and fake-outs. Some versions found online have also been described as recalculating or repainting, so traders should test the exact version they plan to use rather than assuming every Price Border file behaves the same way.
A practical setup is to use Price Border for location, market structure for context, and candle behavior for confirmation. That combination is usually more useful than adding five unrelated indicators to the same chart.
How to Trade with Price Border Indicator MT4
Buy Entry
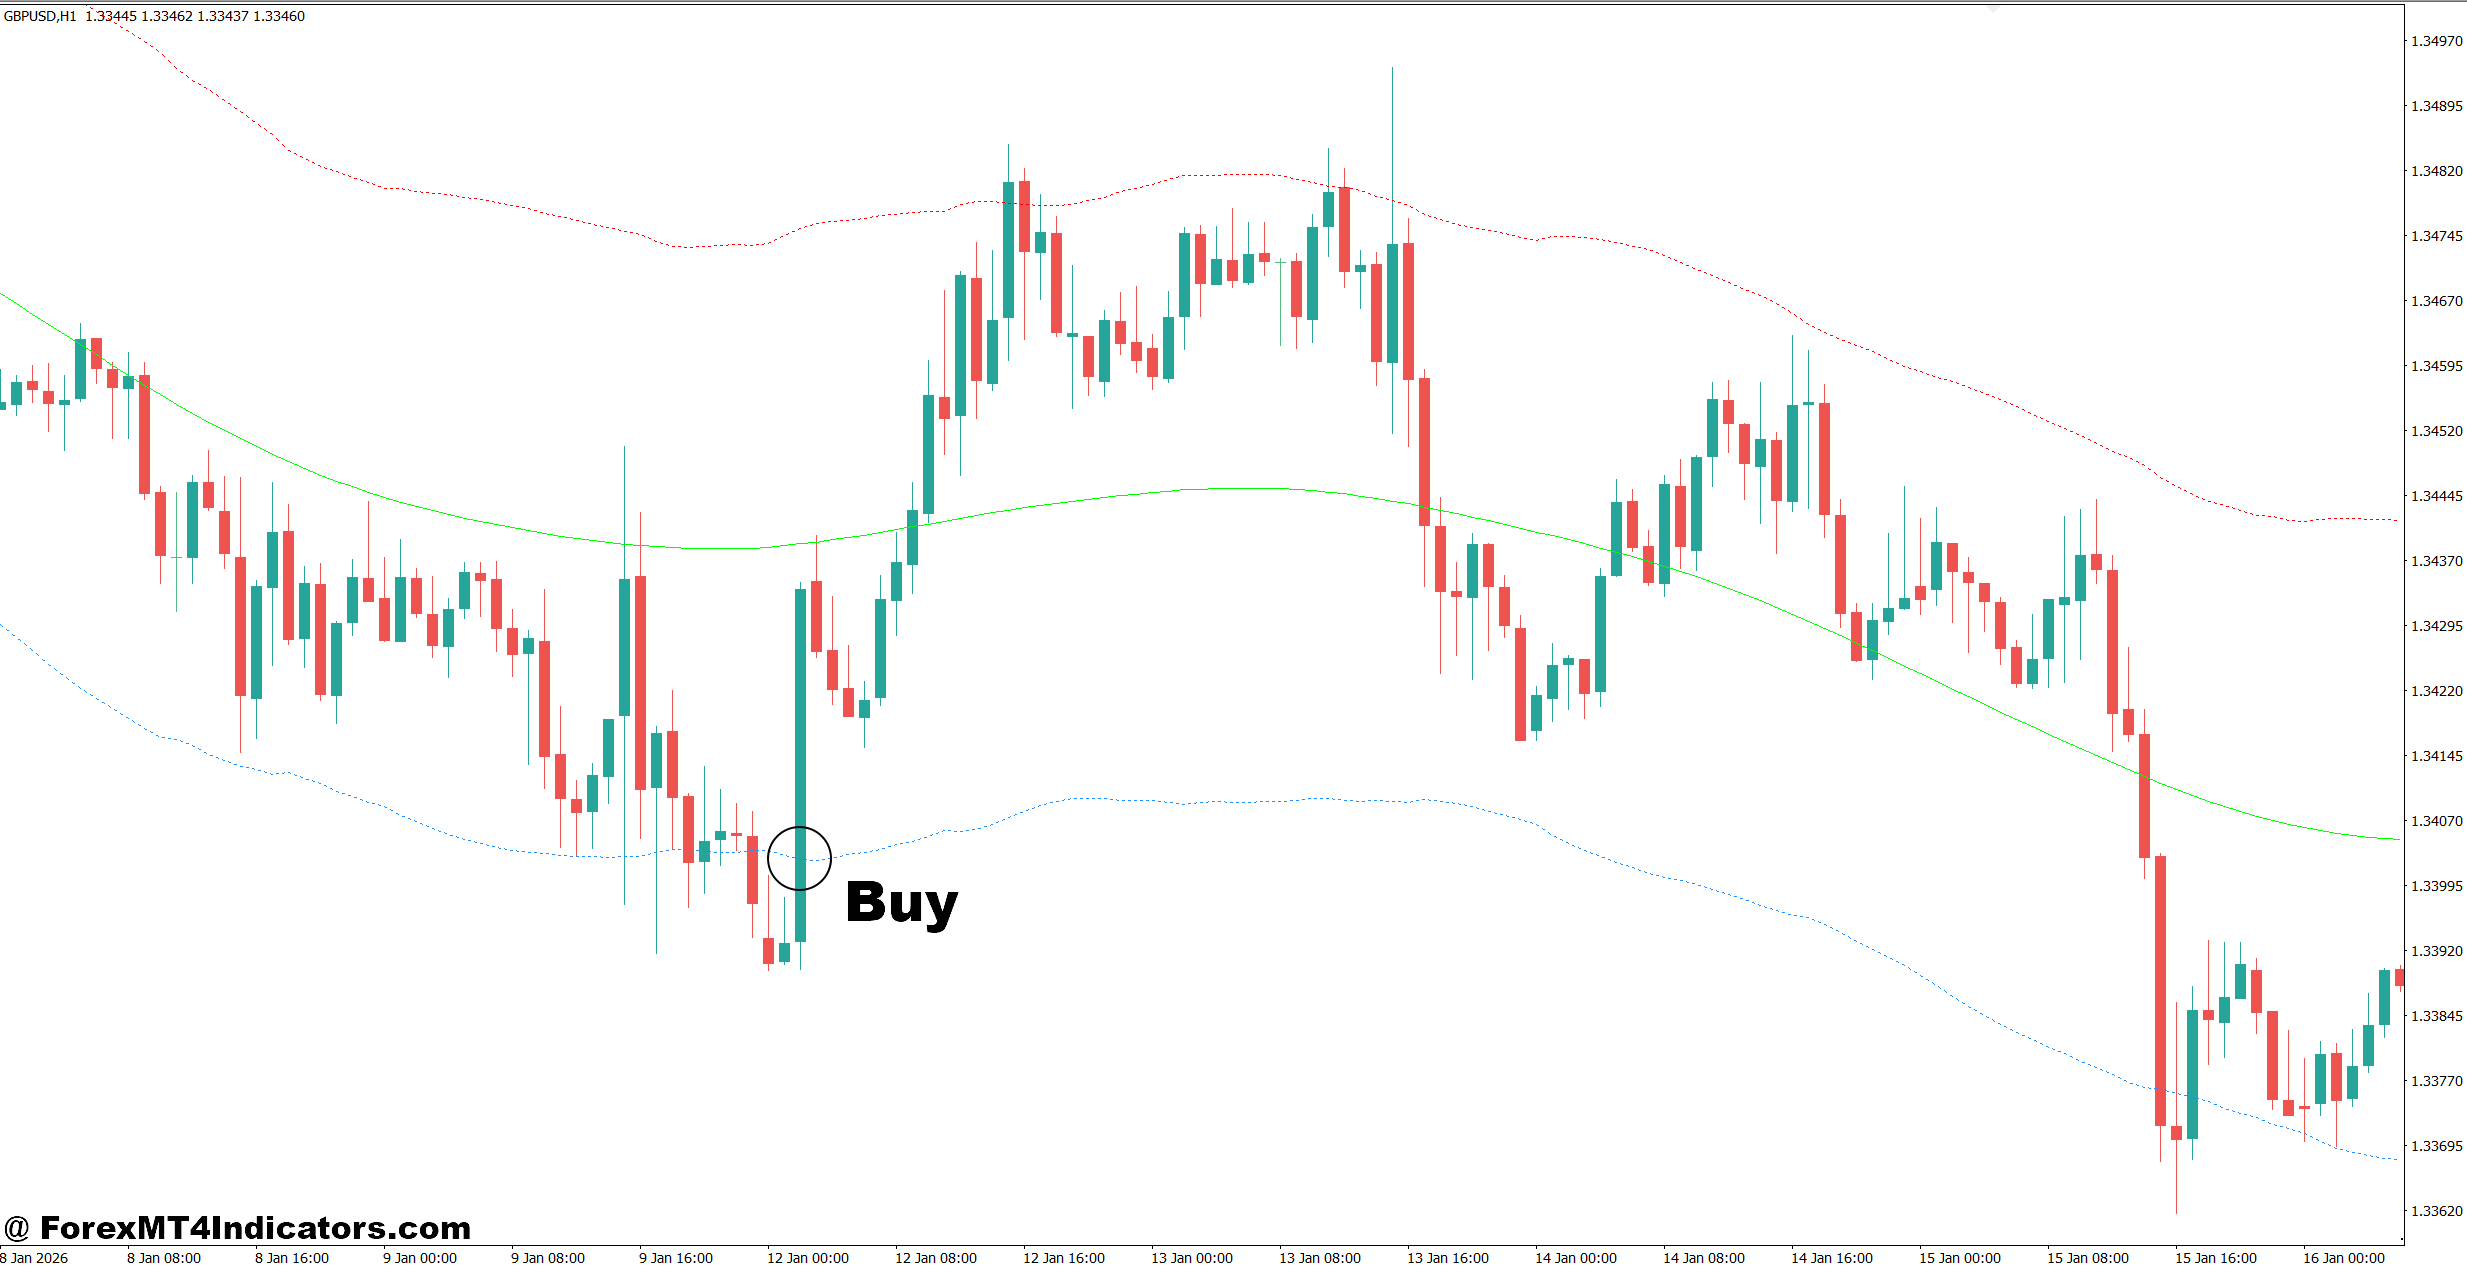
- Buy at lower border rejection – Enter after a bullish candle rejects the lower border on EUR/USD H1, ideally with a 5–10 pip rejection wick.
- Confirm with a bullish close – Wait for an H1 candle to close back above the lower border before buying; avoid entries during an active bearish breakout.
- Check the middle line – Prefer BUY trades when price is above the middle line on H1 or H4, showing stronger bullish pressure.
- Use support confluence – Buy when the lower border matches previous support within 5–15 pips, especially on GBP/USD H1.
- Target the middle border – Consider taking partial profit after 15–25 pips or when price reaches the center line.
- Set controlled risk – Place the stop 10–20 pips below the recent swing low and risk no more than 1% of account equity.
- Confirm higher timeframe bias – On Daily or H4 charts, favor BUY setups when price forms higher highs and higher lows.
- Avoid strong bearish momentum – Don’t buy simply because price touches the lower border during a 30–50 pip bearish breakout; wait for stabilization.
Sell Entry
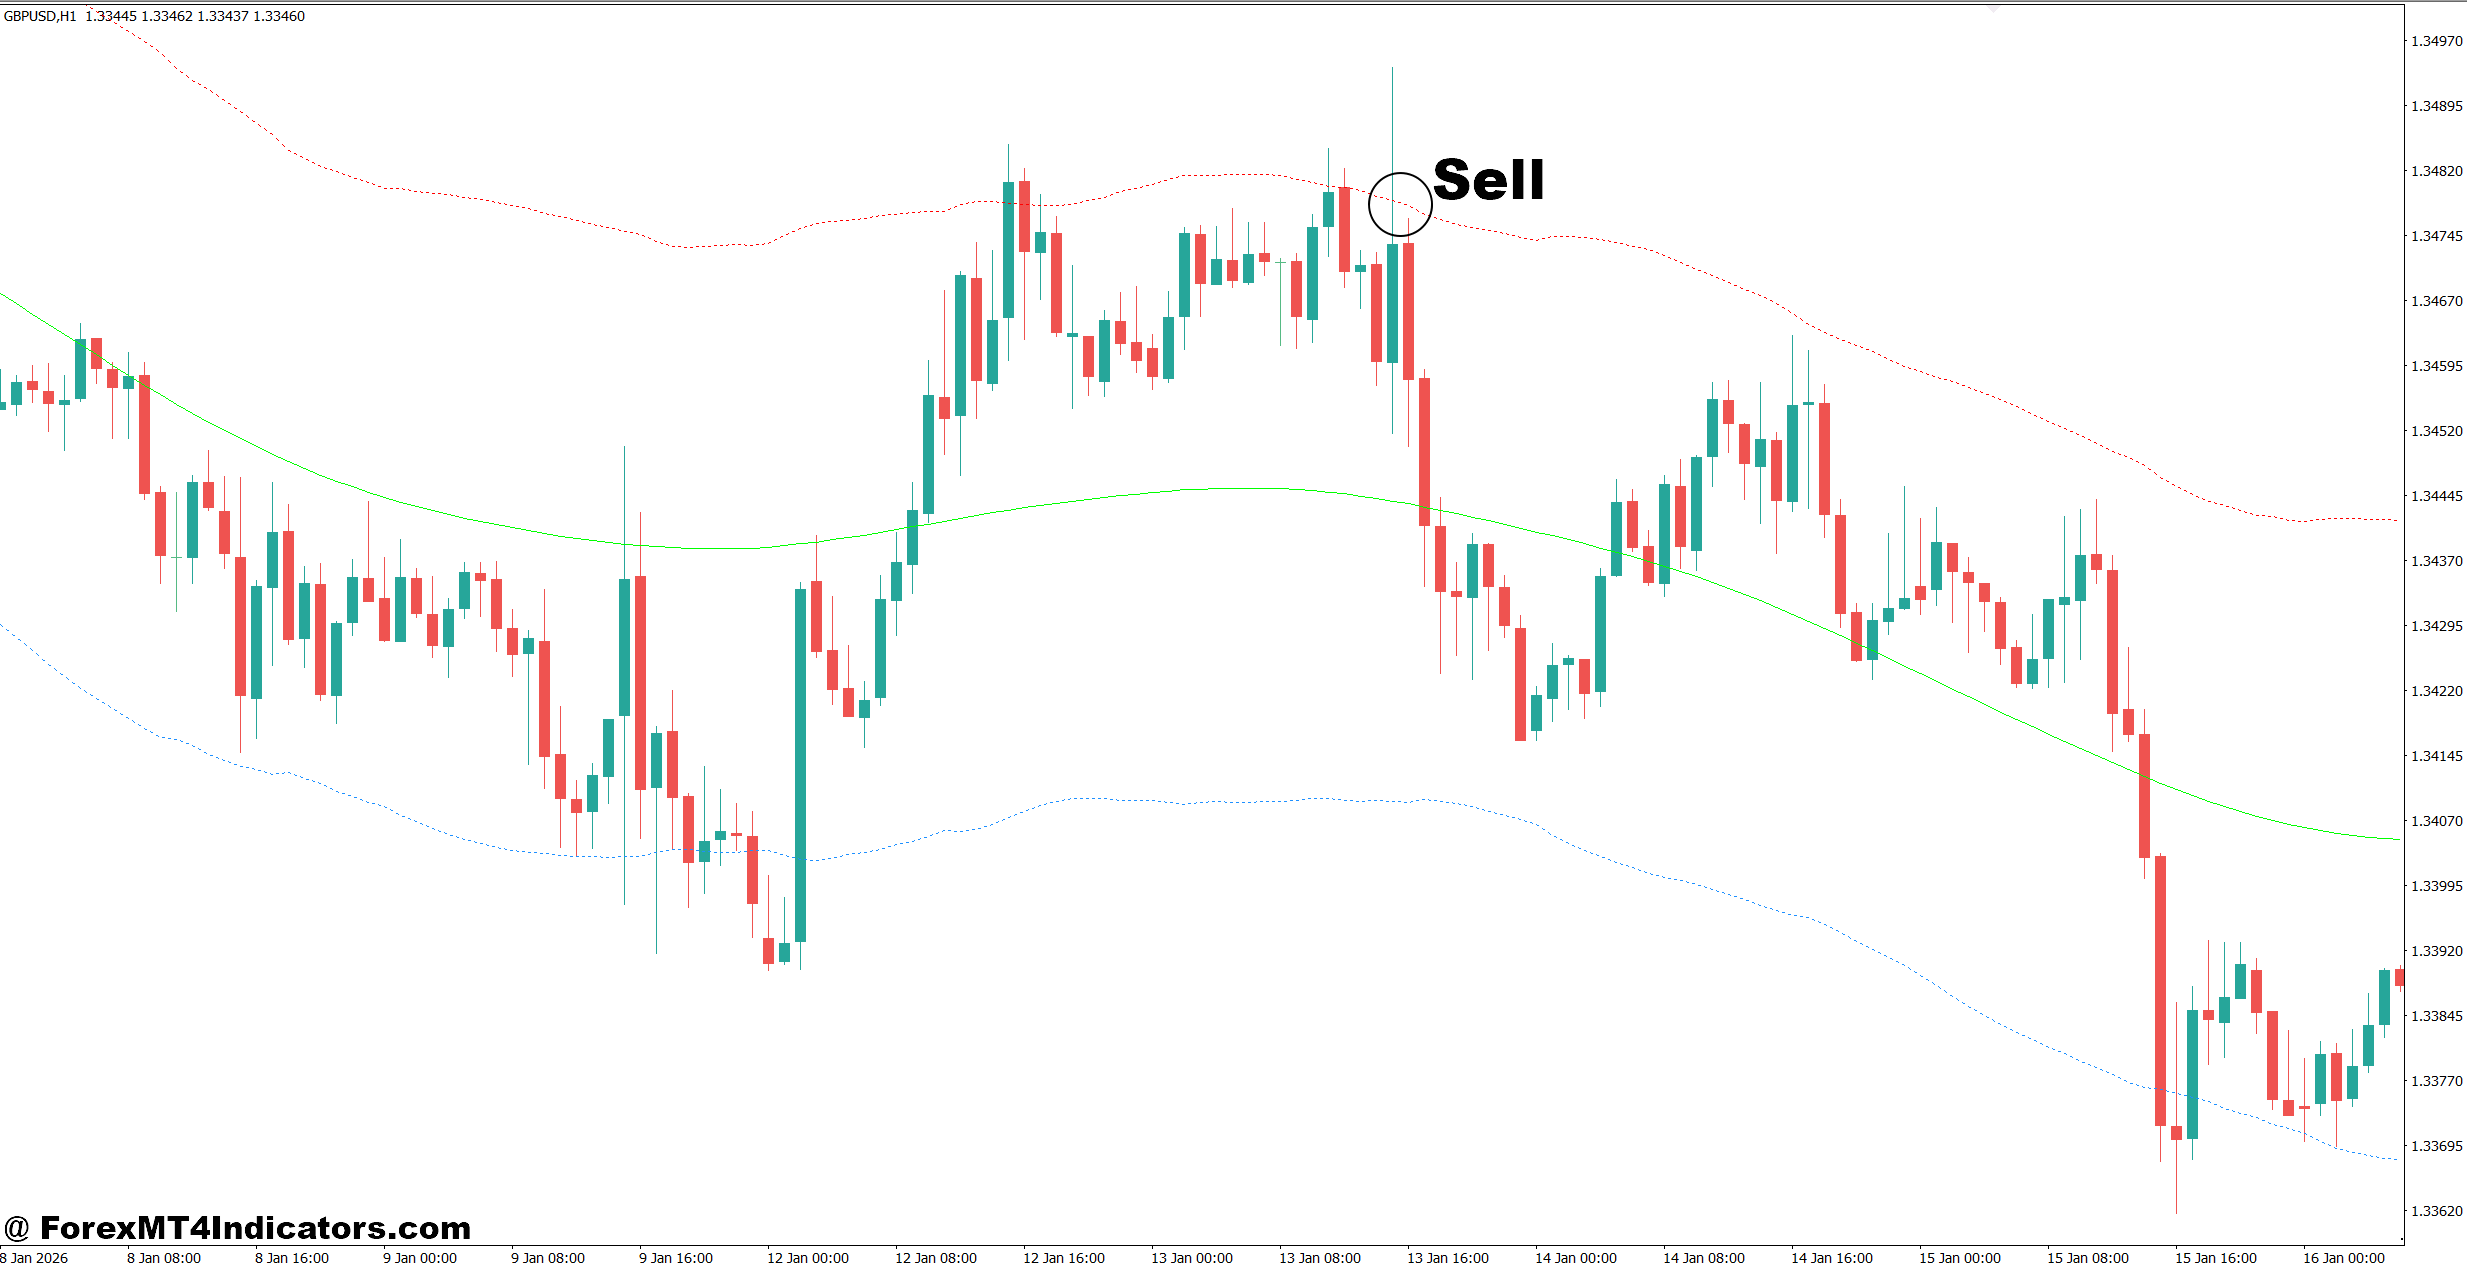
- Sell at upper border rejection – Look for a bearish candle rejecting the upper border on EUR/USD H1, preferably with a 5–10 pip upper wick.
- Wait for bearish confirmation – Enter after an H1 candle closes back below the upper border rather than selling on the first touch.
- Check the middle line – Favor SELL setups when price remains below the middle border on H1 or H4.
- Combine with resistance – Sell when the upper border aligns with resistance within 5–15 pips on GBP/USD H1 or H4.
- Target the middle border first – Consider taking partial profit after 15–30 pips or near the central line.
- Keep risk below 1% – Place the stop 10–20 pips above the recent swing high and keep account risk at 1% or less.
- Use Daily confirmation – Favor shorts when the Daily chart shows lower highs and lower lows, especially after an H4 pullback.
- Avoid strong bullish breakouts – Don’t short an upper-border touch during a 40–60 pip bullish surge; wait for a confirmed reversal.
Final Thoughts on Price Border Indicator MT4
The Price Border Indicator MT4 can give traders a clean way to monitor dynamic support, resistance, swing zones, and trend direction. Its three-band structure is easy to read, while ATR-style volatility calculations can make the channel more responsive to changing market conditions.
Three points matter most: use the middle line as a directional filter, treat outer bands as potential reaction zones rather than guaranteed reversals, and confirm entries with price action and market structure. Traders should also test settings separately on pairs such as EUR/USD, GBP/USD, and XAU/USD because volatility differs sharply between markets.
Trading forex carries substantial risk. No indicator guarantees profits. Before using real money, traders should forward-test the indicator on a demo account and measure actual results across different market conditions. The real question isn’t how often price touches a border; it’s whether the trader has a repeatable plan for what happens next.
Level up your trading
Learn to read the chart — not just the indicator
eBook · Instant PDF
Video Course · 12 modules
Recommended MT4/MT5 Brokers
- ✓ *FREE *$50 to start (withdrawable)
- ✓ Deposit bonus up to $5,000
- ✓ Negative balance protection
Trading forex and CFDs carries a significant risk of loss and is not suitable for everyone. Broker links are affiliate links — we may earn a commission at no cost to you.
Free MT4 Indicator Download

Enter Your Email Address below, download link will be sent to you.
