


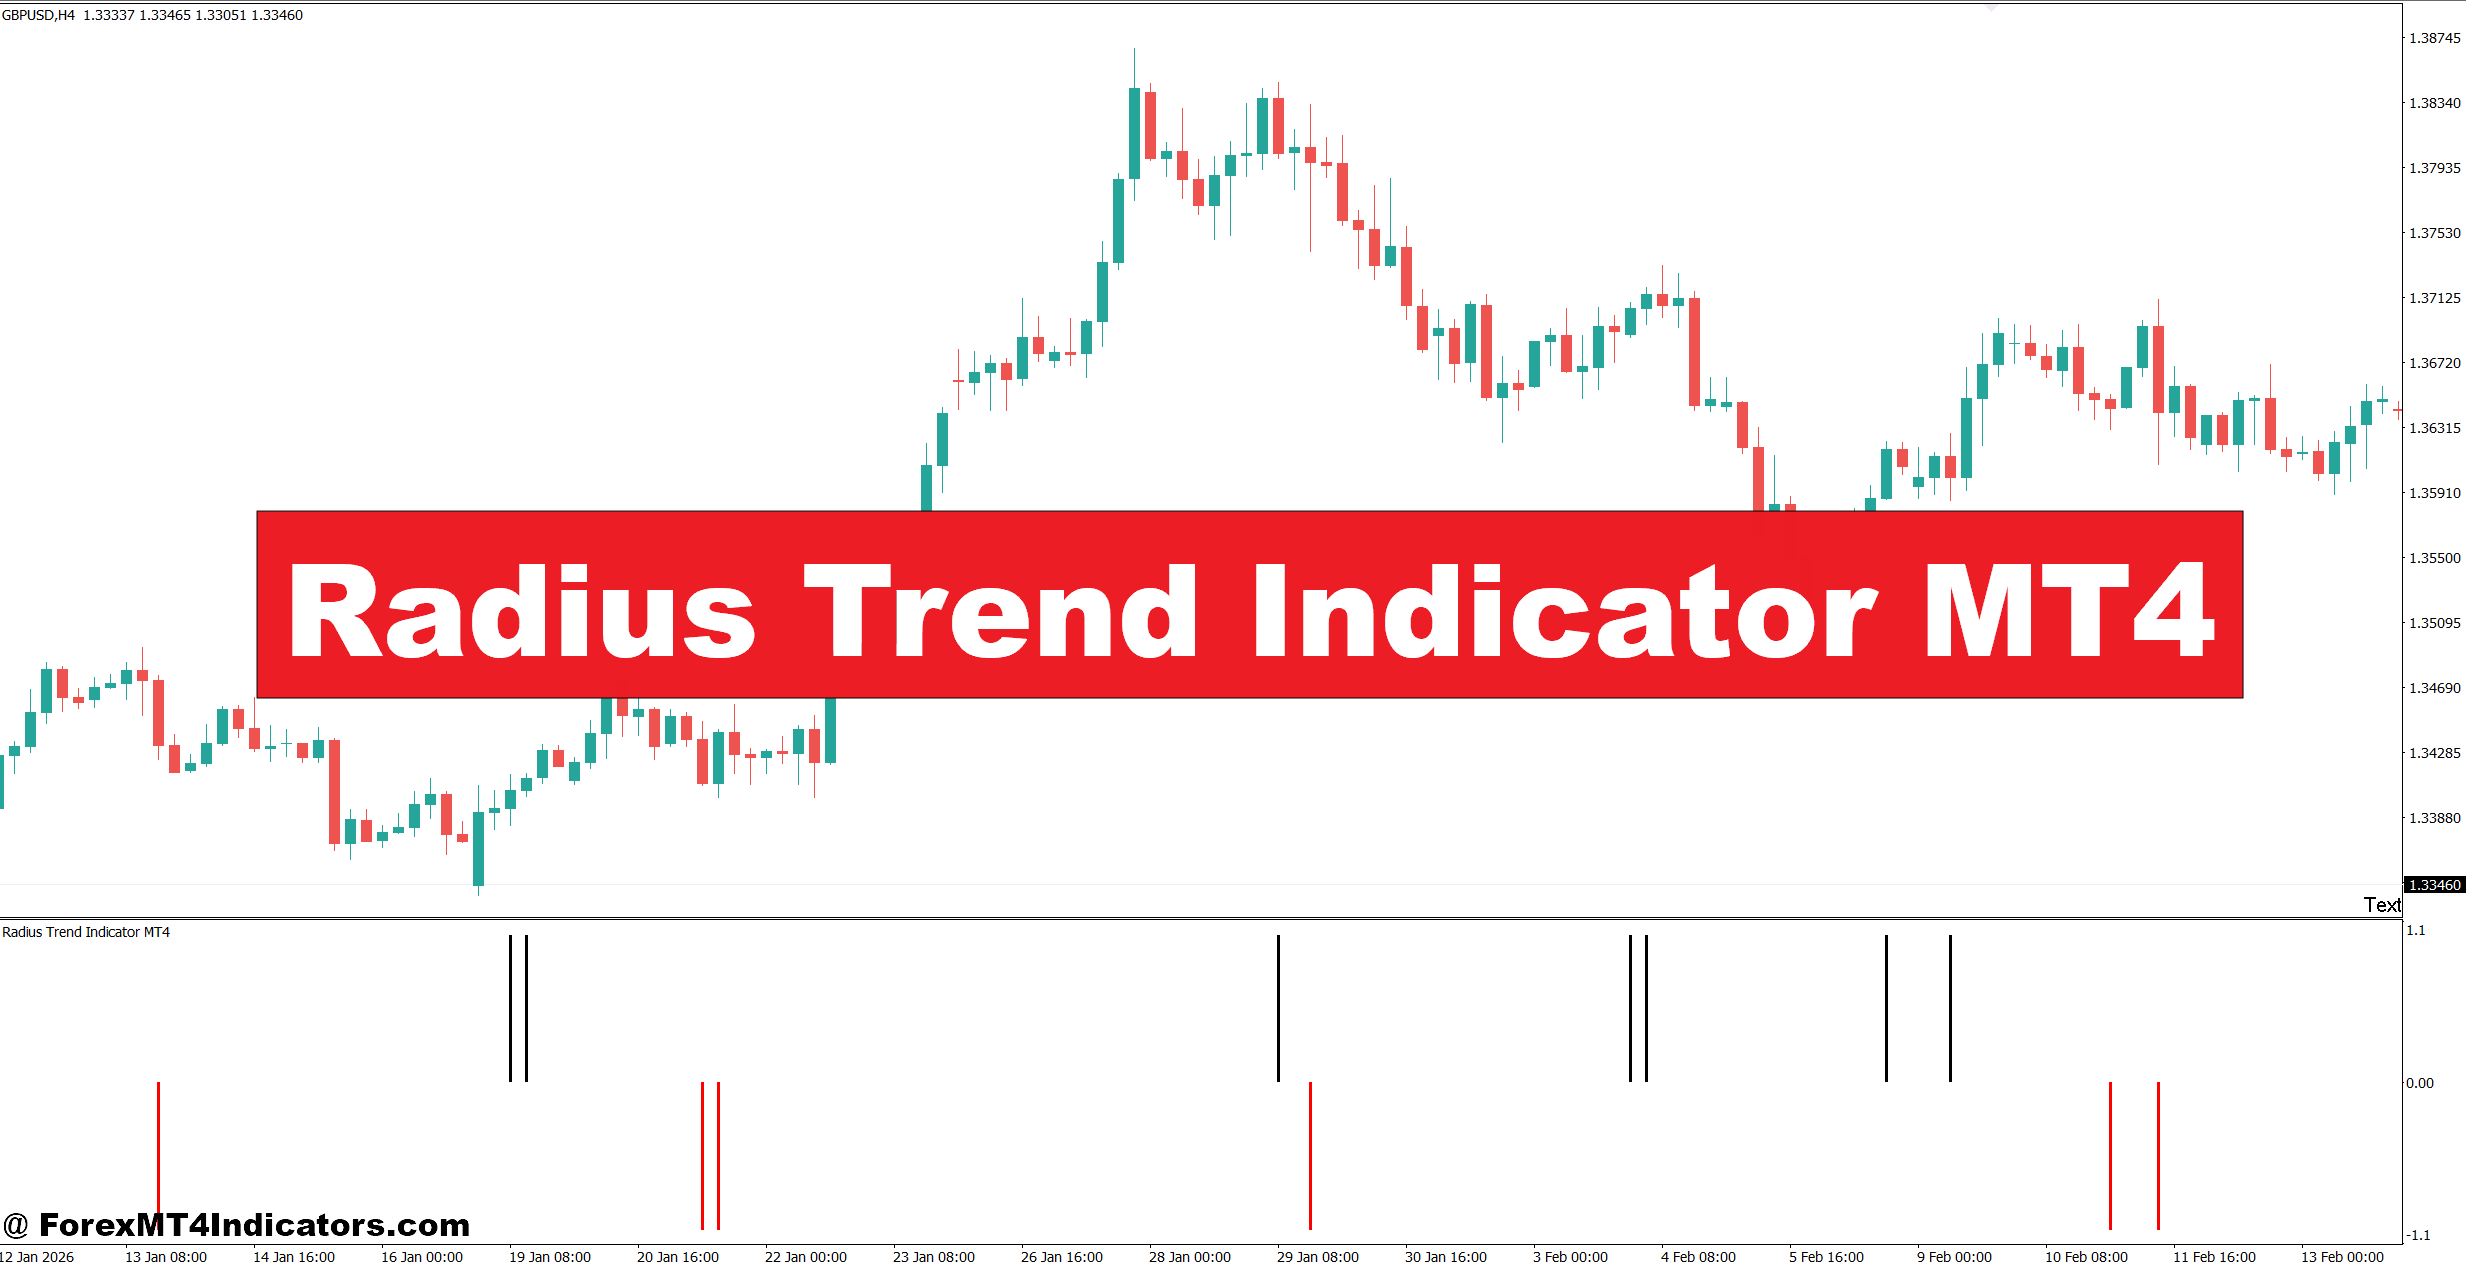
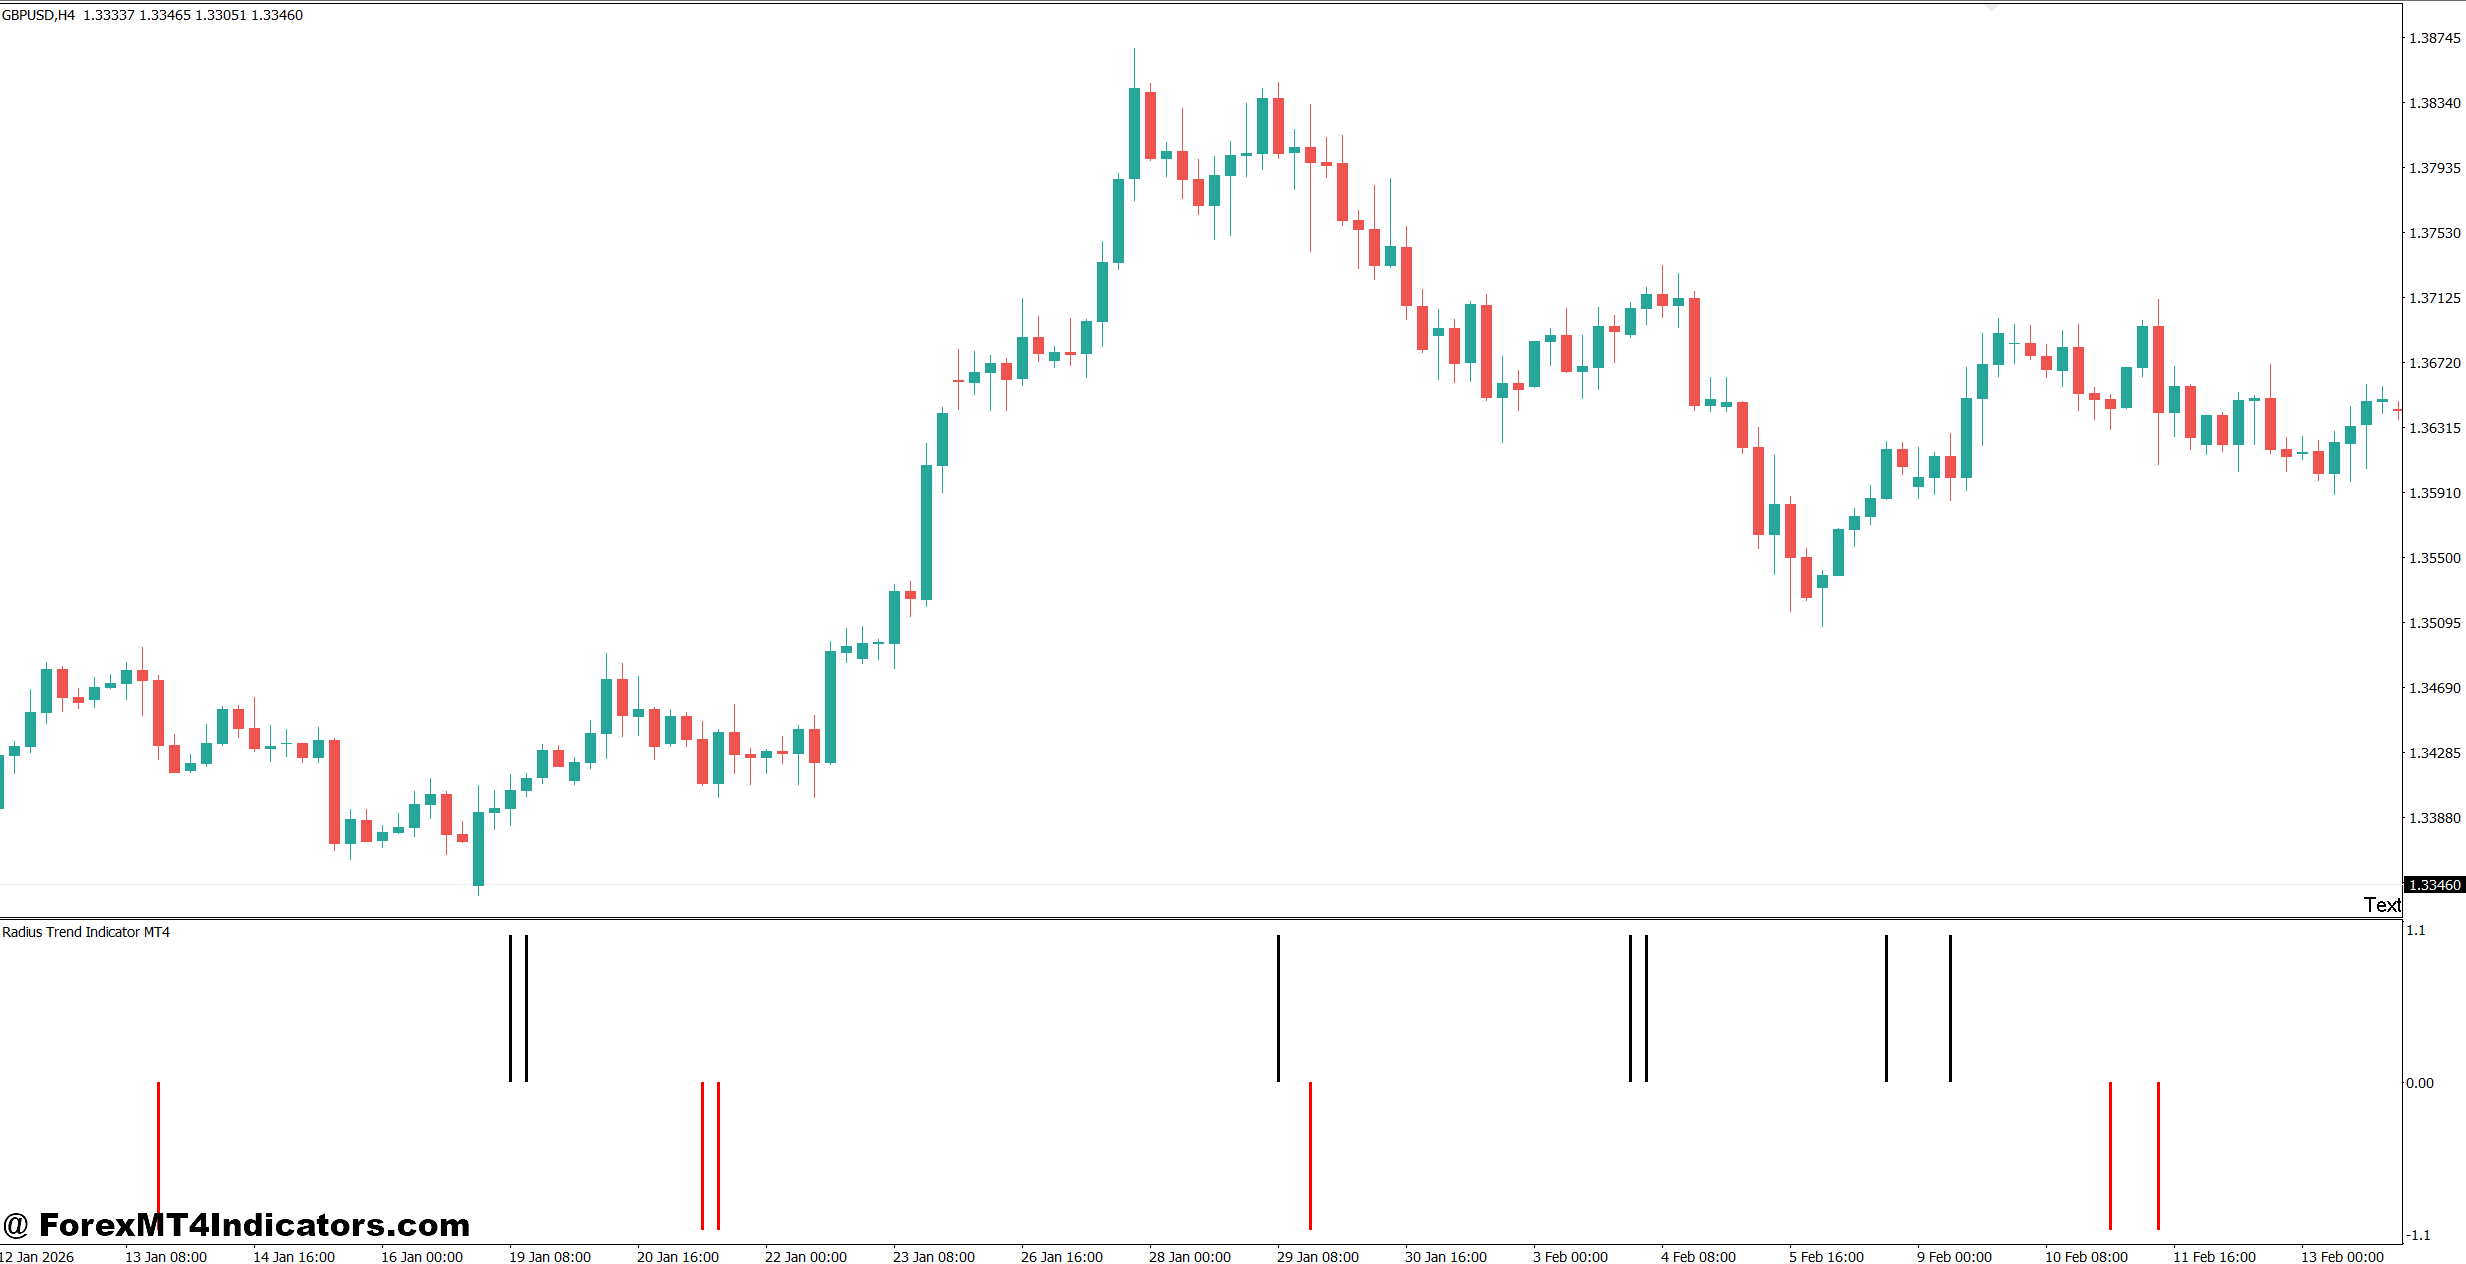
The Radius Trend Indicator MT4 is a technical analysis tool designed to identify the prevailing direction of price. Depending on the version being used, it may display trend changes through colored lines, bands, arrows, or a change in the indicator’s position relative to price.
The main idea is simple: smooth short-term price movement so traders can distinguish a sustained move from ordinary market noise.
Most trend-following calculations of this type rely on some combination of recent price data, smoothing, volatility measurements, and directional thresholds. The indicator then compares current price behavior against that calculated trend zone. When price moves far enough to change the directional condition, the indicator can switch from bullish to bearish or vice versa.
That distinction matters. A signal is not necessarily saying, “Buy now.” It is usually telling the trader that the underlying price condition has changed.
For example, suppose GBP/USD trades around 1.2700 and begins forming higher highs and higher lows on the 1-hour chart. If the Radius Trend reading changes bullish and remains bullish through the next two candles, the setup has more value than a signal that appears during a single five-minute price spike.
The exact formula can vary between Radius Trend versions, so traders should check the settings or source documentation of the specific MT4 file rather than assuming every version calculates its line in the same way.
How Traders Can Read the Indicator
A practical approach is to treat the indicator as a trend filter first and an entry trigger second.
Consider EUR/USD on the 1-hour timeframe. Suppose the pair moves from 1.0820 to 1.0865, pulls back toward 1.0840, and then starts printing higher lows. If the Radius Trend remains bullish during the pullback, a trader can watch the 1.0840–1.0850 area for a price-action confirmation.
One possible plan would look like this:
- Entry near 1.0852 after a bullish rejection.
- Stop-loss around 1.0827, giving roughly 25 pips of risk.
- First target near 1.0890, offering about 38 pips.
- Second target near 1.0910 if momentum remains strong.
The indicator helps establish the directional bias, while support and price structure provide the actual trade context.
The opposite setup applies to a SELL. If USD/JPY turns bearish on the 4-hour chart and price retests a broken resistance level around 157.20, traders can wait for a bearish rejection instead of selling immediately after the first indicator change.
That extra confirmation can make a big difference during choppy sessions.
Use Higher Timeframes as the Filter
A common mistake is relying on the indicator only on M1 or M5 charts. Lower timeframes contain more market noise, especially during quiet sessions.
A trader might use the 4-hour Radius Trend reading to establish direction, the 1-hour chart to identify structure, and the 15-minute chart for entry timing. This creates a simple top-down process without requiring a screen full of indicators.
For instance, if the 4-hour trend is bullish but the 15-minute chart produces a temporary SELL signal, the short setup can be treated as a pullback rather than a full trend reversal.
Settings for Different Pairs and Timeframes
There is no single setting that suits every currency pair. Volatility changes throughout the trading day, and a parameter that works reasonably well on EUR/USD may react too slowly on GBP/JPY.
On a 1-hour chart, traders can start with the indicator’s default settings and test how quickly it reacts around major swings. If signals change too frequently, increasing the smoothing or trend period can reduce noise. If the indicator reacts too slowly, a shorter setting may provide earlier signals, although it can also increase false entries.
A sensible testing routine could compare:
- M15: Shorter settings for active intraday setups, with strict confirmation.
- H1: Balanced settings for swing and day trading.
- H4: Slower settings for broader trend direction.
- Daily: Useful for major trend bias rather than precise entries.
Gold requires extra caution. XAU/USD can move 20–40 dollars during major economic releases, so a setting that looks clean during normal trading may behave very differently during NFP, CPI, or Federal Reserve announcements.
When testing the indicator on volatile NFP days, traders should also examine spread expansion and candle size. A 30-pip stop on EUR/USD and a similarly sized stop on gold do not represent the same level of market risk.
Radius Trend Indicator vs Other Trend Tools
The Radius Trend Indicator can be compared with several familiar technical tools.
A moving average is simpler and highly transparent. A 50-period EMA, for example, gives traders a clear reference for trend direction, but it can lag sharply after a fast reversal. The Radius Trend approach may provide a more visually direct trend change depending on its calculation and settings.
The MACD offers momentum and trend information through moving-average relationships. It can be useful for confirmation, but traders often wait for the histogram or signal line to develop before acting.
The Supertrend indicator is another close comparison because it also focuses on directional changes and volatility. Supertrend often works well as a trailing trend reference, while a Radius Trend implementation may present its signals differently.
No indicator has to replace these tools. A trader could use a 50 EMA for the broader trend, Radius Trend for directional confirmation, and horizontal support or resistance for the entry area. Keeping the chart simple usually makes the decision process easier.
Strengths, Weaknesses, and Risk Management
One clear advantage is visual simplicity. A trader can quickly identify whether market conditions are leaning bullish or bearish without calculating every price swing manually. It can also help reduce trades taken against a strong trend.
The limitation is equally important: trend indicators struggle in sideways markets.
Suppose EUR/USD stays between 1.0780 and 1.0820 for several hours. The indicator may switch direction multiple times as price moves around the middle of the range. Buying and selling every change can create a string of small losses.
Another problem is lag. Any smoothing process uses historical data, so a trend signal may appear after part of the move has already happened.
Risk management therefore remains essential. A trader risking 1% of a $5,000 account has a maximum planned loss of $50 on a position. If the setup requires a 25-pip stop, the position size should be calculated from that stop distance rather than chosen first and protected afterward.
Traders should also avoid taking every signal during major news releases. A clean indicator reading can be invalidated within seconds when liquidity changes sharply.
Trading forex carries substantial risk. No indicator guarantees profits.
A Practical Trading Routine
A useful workflow starts with market structure rather than the indicator itself.
First, check the H4 or Daily chart for the broad direction. Next, mark important support and resistance levels. Then move to H1 and see whether the Radius Trend reading agrees with the structure.
If the trend is bullish, traders can wait for a pullback into support instead of chasing an extended candle. A bullish rejection, higher low, or break above a nearby swing high can provide the final confirmation.
For a bearish market, the same process works in reverse. Traders can wait for price to retest resistance, look for rejection, and then use the indicator’s bearish condition as supporting evidence.
This approach keeps the indicator in its proper role. It helps organize market information, but the trade still depends on price location, volatility, timing, and risk.
How to Trade with Radius Trend Indicator MT4
Buy Entry
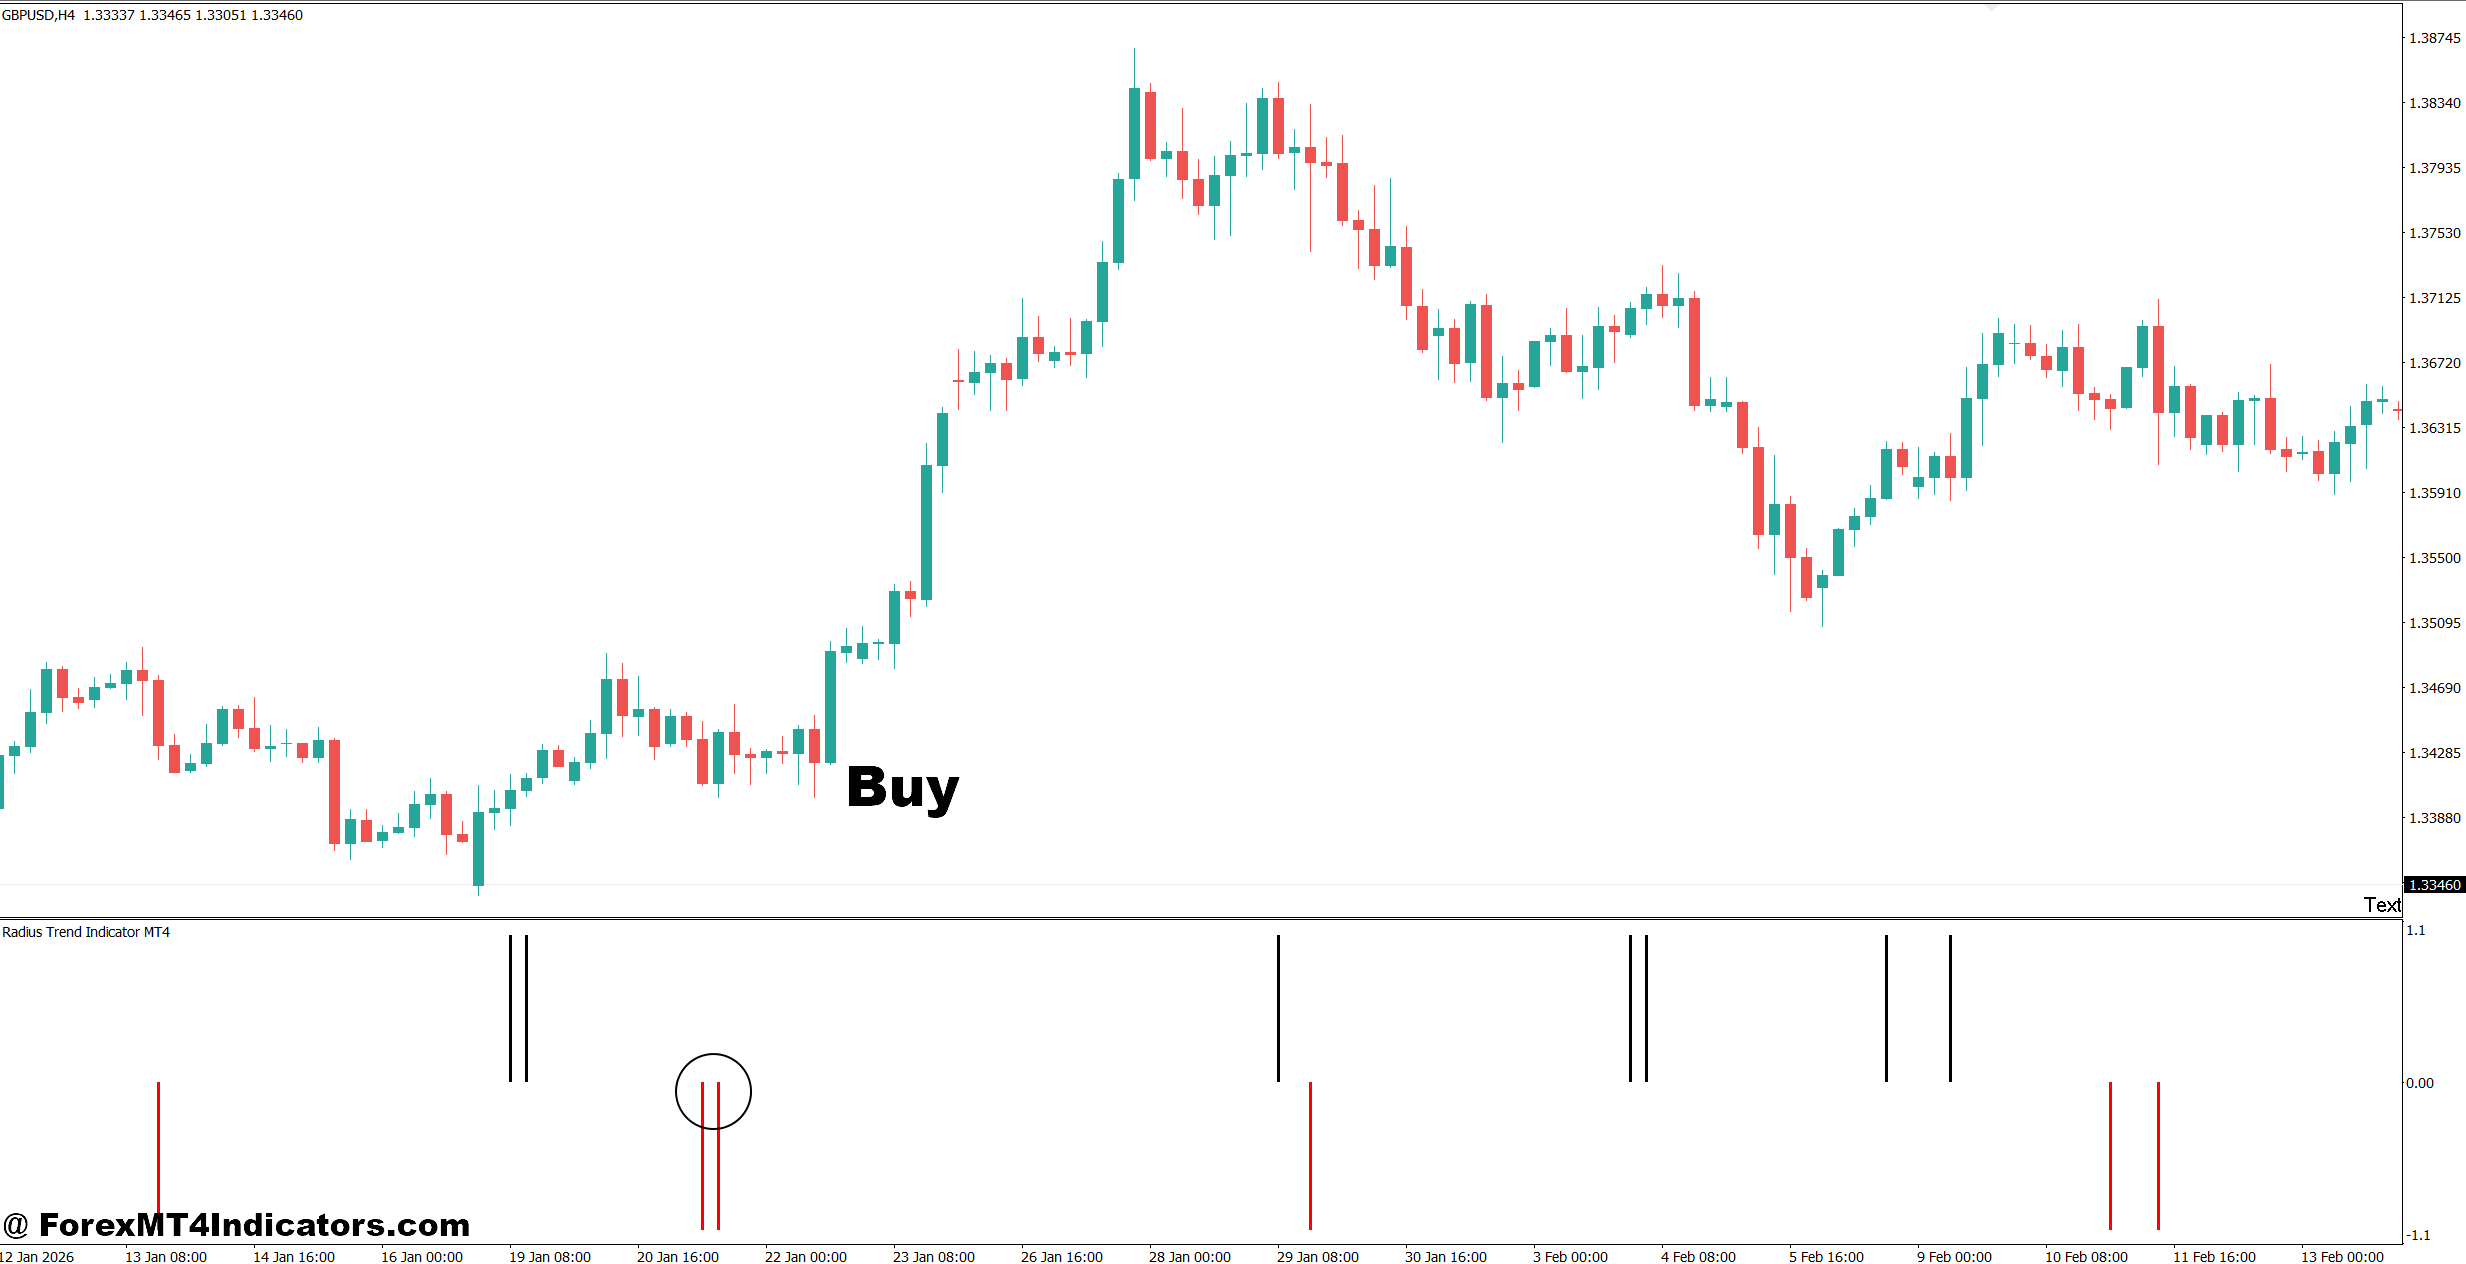
- Wait for a bullish trend signal – Enter BUY only when the Radius Trend Indicator turns bullish on the 1-hour or 4-hour chart.
- Confirm higher highs – Look for EUR/USD or GBP/USD forming higher highs and higher lows before entering.
- Buy the pullback – On the 1-hour chart, wait for price to retrace 15–30 pips toward support before considering a BUY.
- Check daily direction – Prefer BUY trades when the Daily chart also shows bullish structure, reducing counter-trend entries.
- Use a 20–30 pip stop – Place the stop below the latest swing low instead of using an arbitrary distance.
- Target at least 1:2 RR – With a 25-pip stop, aim for approximately 50 pips or more in potential profit.
- Risk only 1% per trade – A $5,000 account should risk no more than $50 on a single setup.
- Avoid major news entries – Don’t BUY immediately before NFP, CPI, or Fed announcements because spreads and volatility can spike.
Sell Entry
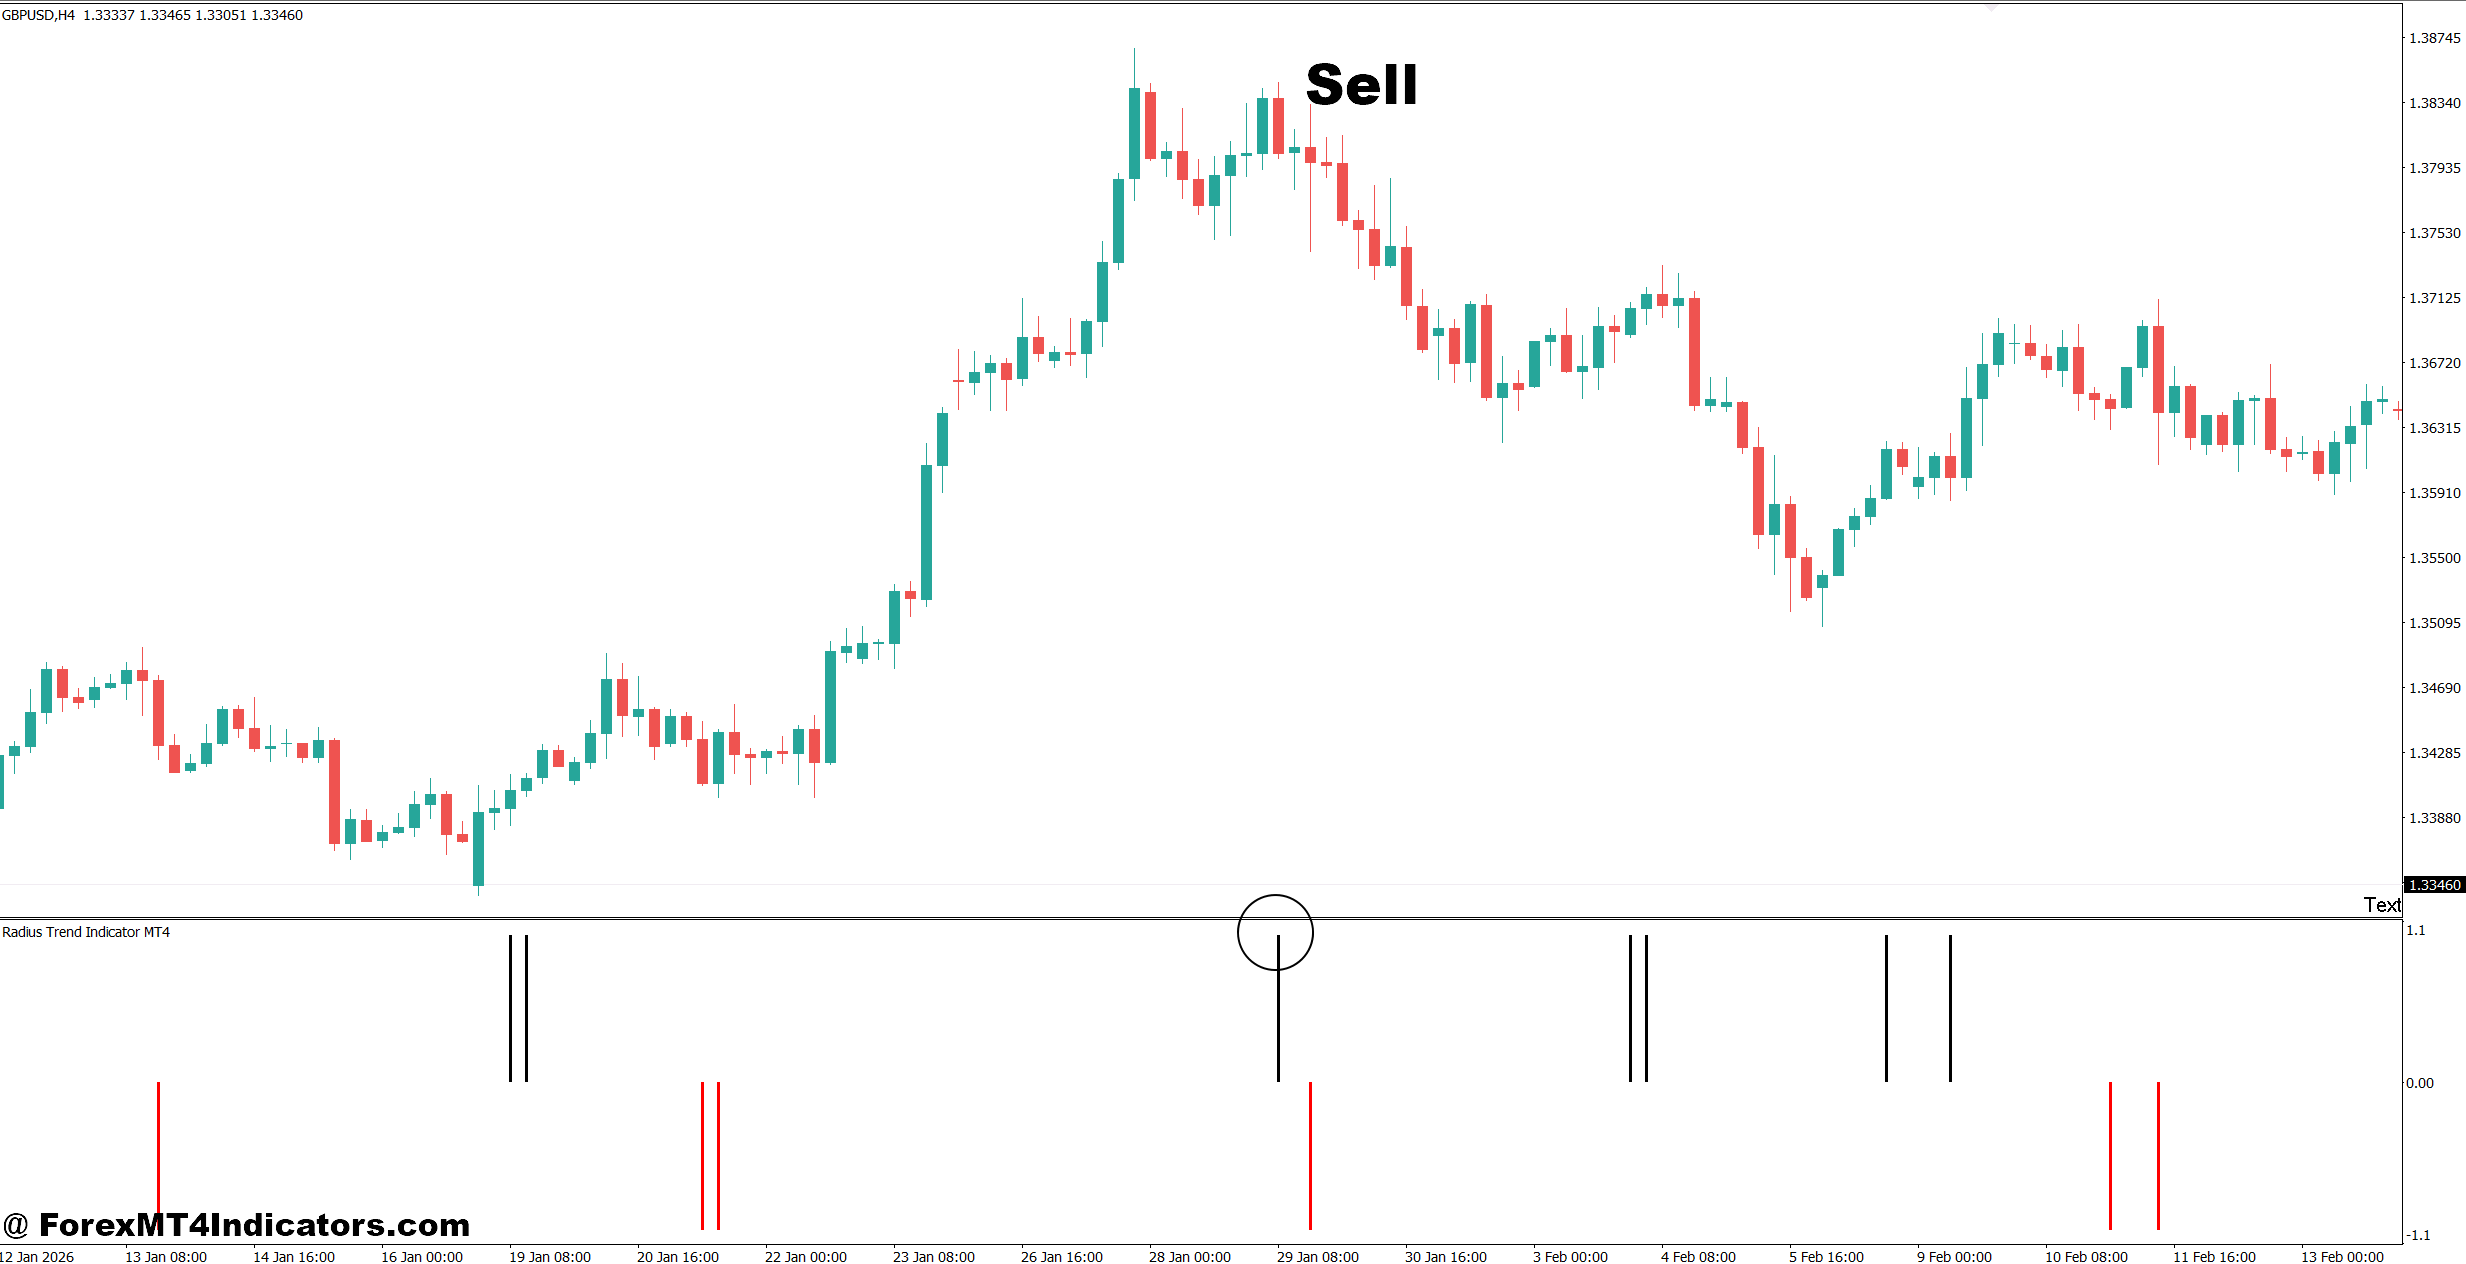
- Wait for a bearish trend signal – Consider SELL entries when the Radius Trend Indicator turns bearish on the 1-hour or 4-hour chart.
- Confirm lower lows – GBP/USD should ideally form lower highs and lower lows before a short trade.
- Sell the resistance retest – On the 1-hour chart, wait for price to pull back 15–30 pips into resistance before entering.
- Check the Daily trend – Favor SELL setups when the Daily structure remains bearish and supports the lower-timeframe signal.
- Set a 20–30 pip stop – Place the stop above the recent swing high and adjust it to current volatility.
- Aim for 1:2 risk-to-reward – A 30-pip stop should target around 60 pips or more when market conditions allow.
- Keep risk near 1% – Reduce position size if the required stop becomes wider than 40–50 pips.
- Skip signals in sideways chop – Don’t SELL when EUR/USD is trapped inside a narrow 20–30 pip range with repeated indicator flips.
Final Thoughts on Radius Trend Indicator MT4
The Radius Trend Indicator MT4 can be a useful addition to an MT4 chart when traders use it as part of a wider decision process.
- Trend filter: It can help identify bullish and bearish conditions more clearly.
- Entry support: It works better when combined with market structure, support, resistance, and price action.
- Adaptable settings: Different pairs and timeframes may require different sensitivity levels.
- Clear limitations: Sideways markets, news events, and delayed signals can still produce poor trades.
The best test is not how attractive the signals look on a chart. It is how the indicator performs across different market conditions with realistic spreads, stops, and position sizes. Traders should backtest it first, then use a demo account before risking live capital. The goal isn’t to follow every signal; it’s to find situations where the Radius Trend Indicator MT4 adds useful confirmation to an already sensible trading plan.
Level up your trading
Learn to read the chart — not just the indicator
eBook · Instant PDF
Video Course · 12 modules
Recommended MT4/MT5 Brokers
- ✓ *FREE *$50 to start (withdrawable)
- ✓ Deposit bonus up to $5,000
- ✓ Negative balance protection
Trading forex and CFDs carries a significant risk of loss and is not suitable for everyone. Broker links are affiliate links — we may earn a commission at no cost to you.
Free MT4 Indicator Download

Enter Your Email Address below, download link will be sent to you.
