


The Trend Finder Indicator MT4 was created to reduce those frustrating situations by helping traders identify the dominant market direction before taking a position.
Poor trend identification often leads to emotional decisions. Chasing price, closing trades too early, or holding losing positions for too long can slowly damage both confidence and account balance. A trader who consistently enters against the main trend usually experiences more fake-outs than profitable moves.
The Trend Finder Indicator MT4 attempts to simplify trend analysis by filtering market noise and highlighting the prevailing direction. While no technical tool can predict every price movement, it can improve decision-making when combined with sound risk management and price action analysis. The following sections explain how this indicator works, where it performs best, and what traders should know before relying on it.
Understanding the Trend Finder Indicator MT4
The Trend Finder Indicator MT4 is a trend-following tool designed to identify bullish and bearish market conditions on the MetaTrader 4 platform. Depending on the version, it may display colored lines, arrows, histogram bars, or background changes that indicate the current trend direction.
Most Trend Finder indicators rely on a combination of moving averages, momentum filters, and price smoothing algorithms. Instead of reacting to every candle, they attempt to ignore small market fluctuations and focus on meaningful directional movement.
The indicator performs best during established trends rather than sideways markets. For example, if EUR/USD is making higher highs and higher lows on the 1-hour chart, the indicator may remain in buy mode until momentum weakens significantly.
Unlike simple moving averages that only follow price, many Trend Finder versions include additional filters to reduce frequent signal changes during normal market pullbacks.
How the Trend Finder Indicator Generates Signals
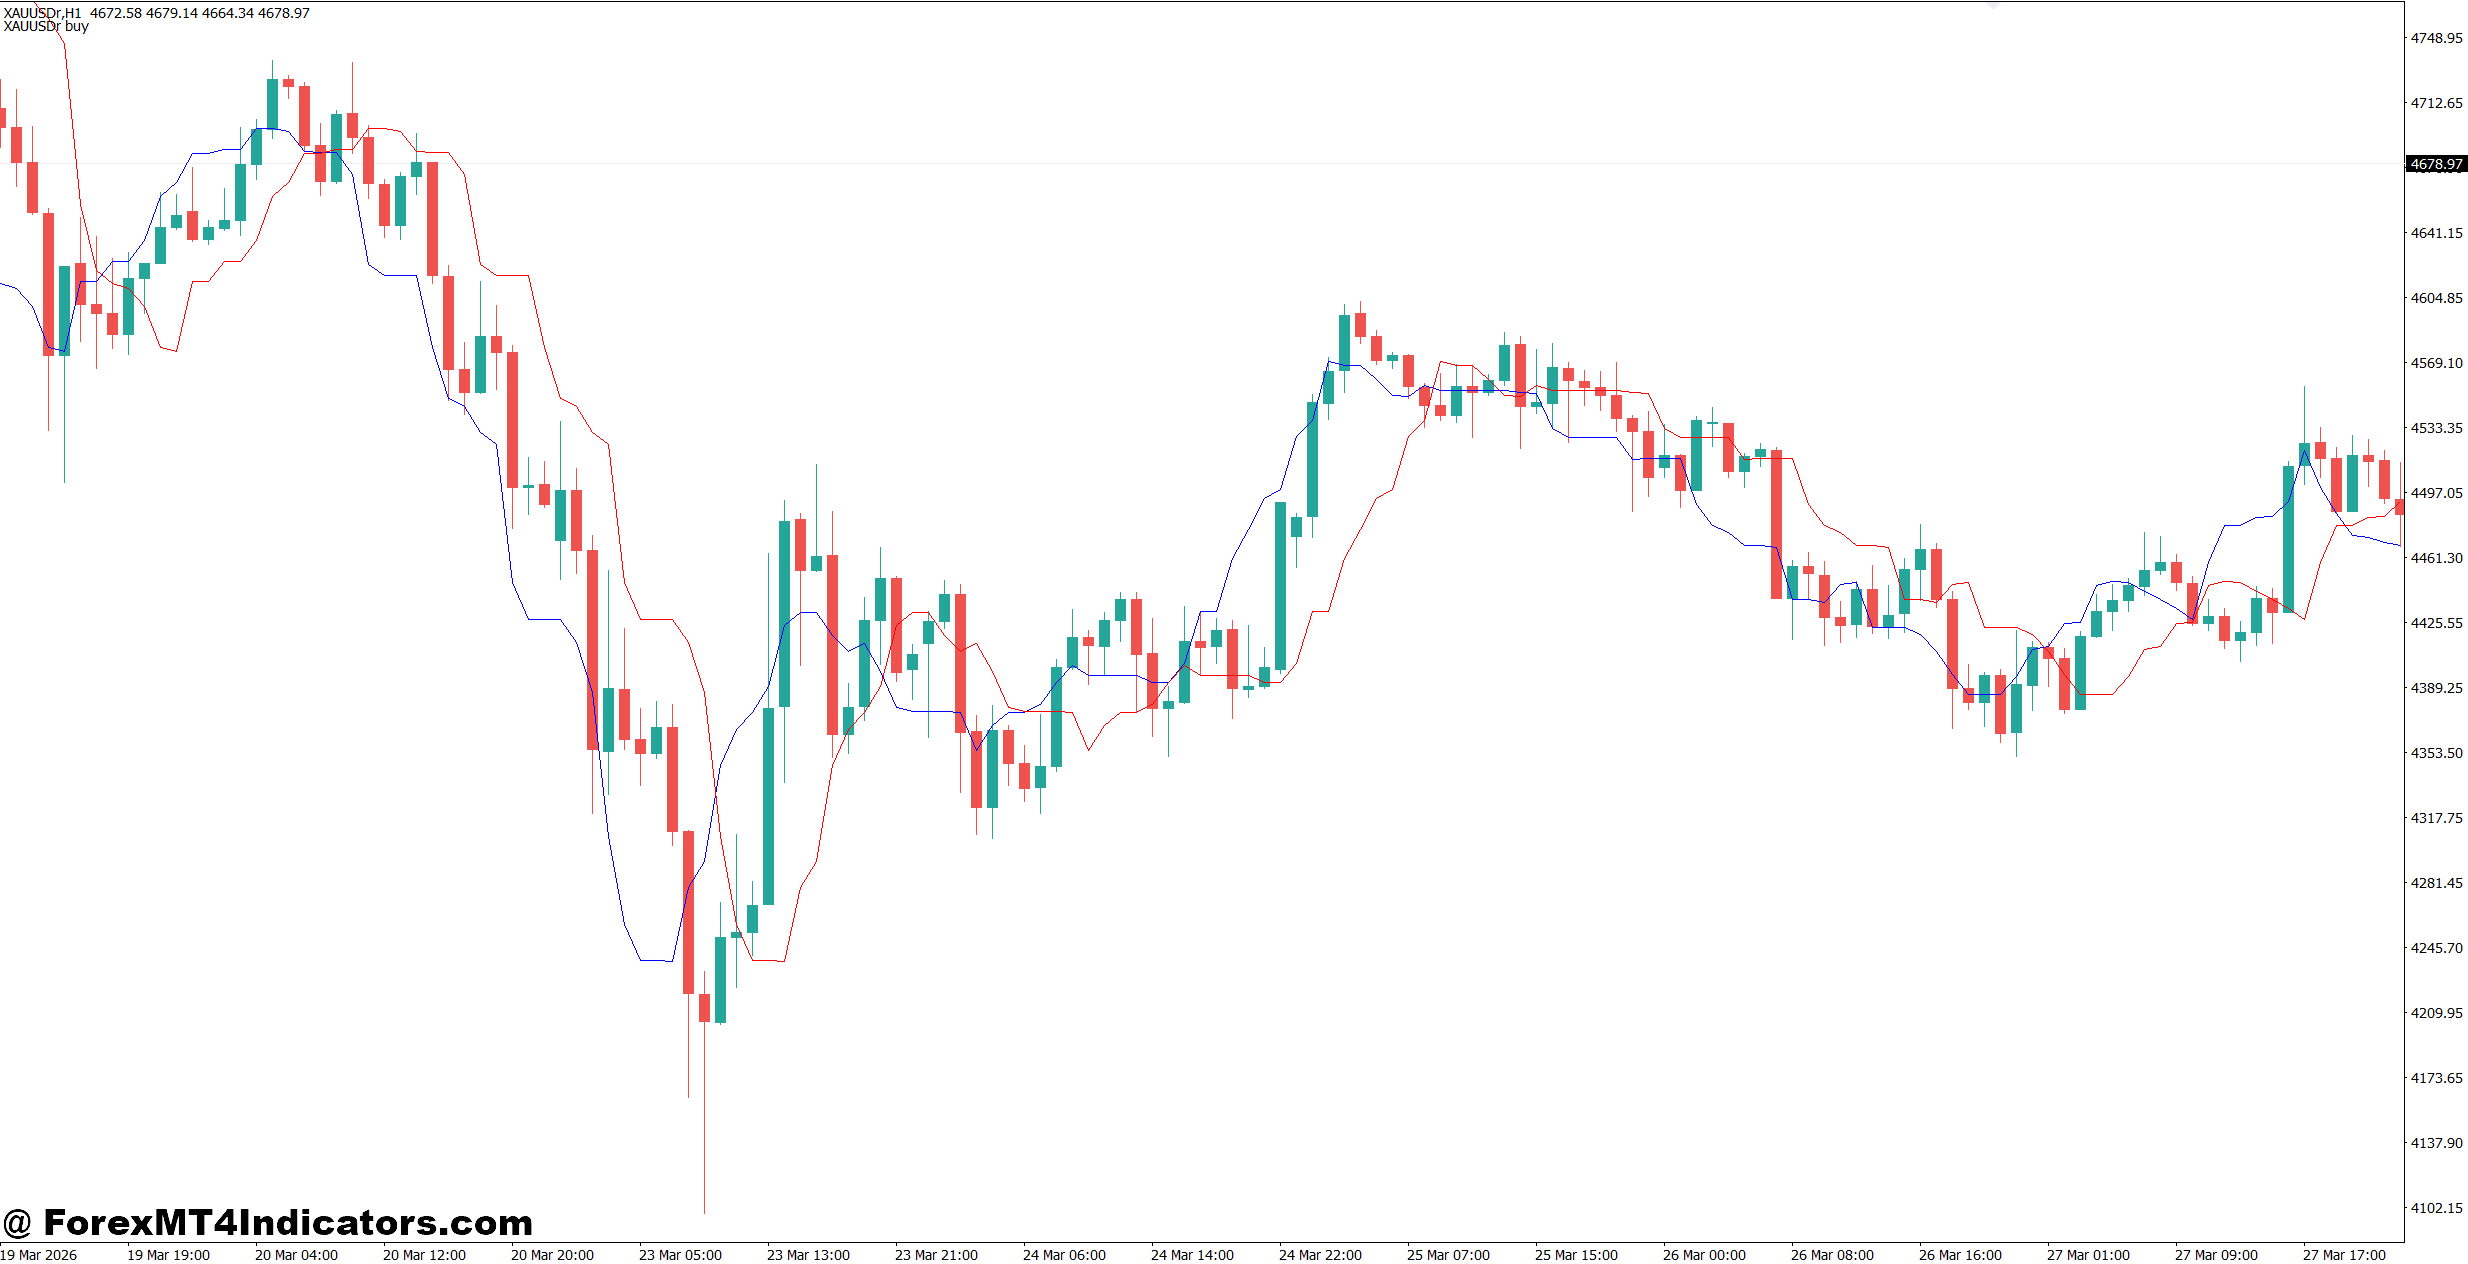
The exact calculation depends on the developer, but the logic usually follows several technical principles.
Price is first smoothed using one or more moving averages. The indicator then compares current price behavior with previous market structure while measuring momentum. If buying pressure remains strong, it continues displaying bullish signals. When momentum shifts and sellers gain control, the indicator changes direction.
For example, imagine GBP/USD trading above its 50-period moving average while momentum continues increasing. The Trend Finder Indicator MT4 may keep printing bullish arrows or maintain a green trend line. Once price closes below the smoothing filter and bearish momentum strengthens, the indicator changes to a sell signal.
Experienced traders rarely enter immediately after the first signal. Instead, they often wait for the current candle to close before making a decision. This simple habit filters out many false signals that appear during highly volatile sessions.
When testing this indicator during Non-Farm Payroll (NFP) releases, many traders notice temporary signal changes caused by sharp price spikes. Waiting 10 to 15 minutes after major economic news often produces cleaner entries than reacting instantly.
Combining Trend Confirmation with Price Action
A trend signal becomes much stronger when price confirms it.
Suppose USD/JPY prints a bullish Trend Finder signal on the 4-hour chart while price also breaks above a resistance level that has held for several days. That combination provides stronger confirmation than relying on the indicator alone.
Many traders also watch for:
- Higher highs and higher lows during uptrends.
- Lower highs and lower lows during downtrends.
- Candlestick confirmation such as bullish engulfing or bearish rejection candles.
- Increasing momentum during breakout moves.
This extra confirmation helps reduce trades during choppy market conditions where trend indicators often struggle.
Practical Trading Applications
The Trend Finder Indicator MT4 fits several trading styles.
Swing traders frequently apply it on the 4-hour and daily charts to capture larger directional moves. Scalpers may use it on the 5-minute or 15-minute charts, although lower timeframes naturally produce more market noise.
One practical example occurred on EUR/USD during a strong London session. Price broke above Asian session resistance while the Trend Finder Indicator remained bullish throughout the move. Traders who waited for the breakout retest found a lower-risk entry with a stop loss around 20 pips below the swing low. The pair later advanced nearly 75 pips before slowing near the next resistance zone.
Another example can be seen on GBP/JPY during ranging conditions. The indicator changed between buy and sell several times within two hours. Traders who ignored overall market structure experienced multiple losing trades. Those who recognized the sideways environment simply stayed out of the market.
Here’s the thing: knowing when not to trade is often just as valuable as finding a good entry.
Settings, Customization, and Real-World Strengths
Different trading styles require different indicator settings.
Short-term traders often prefer faster calculations because they need earlier entries. They may use settings between 10 and 20 periods on lower timeframes like M15 or M30. The trade-off is an increase in false signals.
Swing traders generally choose slower settings between 40 and 100 periods on H4 or Daily charts. Signals arrive later, but they usually align better with larger market trends.
For highly volatile pairs such as GBP/JPY or XAU/USD, increasing the smoothing period may reduce unnecessary signal changes. Less volatile pairs like EUR/CHF often work well with standard settings.
What makes this different from using a single moving average?
The added momentum filter attempts to reduce whipsaws during minor pullbacks. Even so, it won’t eliminate every fake-out.
Compared with indicators such as the Moving Average, Supertrend, or MACD, the Trend Finder Indicator MT4 often provides cleaner visual signals while remaining relatively easy to interpret. MACD offers deeper momentum analysis, while Supertrend reacts more directly to volatility. Each tool has strengths depending on market conditions.
No indicator should replace risk management.
Trading forex carries substantial risk. No indicator guarantees profits. Traders should always define stop-loss levels before entering a trade and avoid risking more than 1% to 2% of account equity on a single position.
Backtesting across multiple currency pairs and different market conditions also helps traders understand how the indicator behaves before using it on a live account.
How to Trade with Trend Finder Indicator MT4
Buy Entry
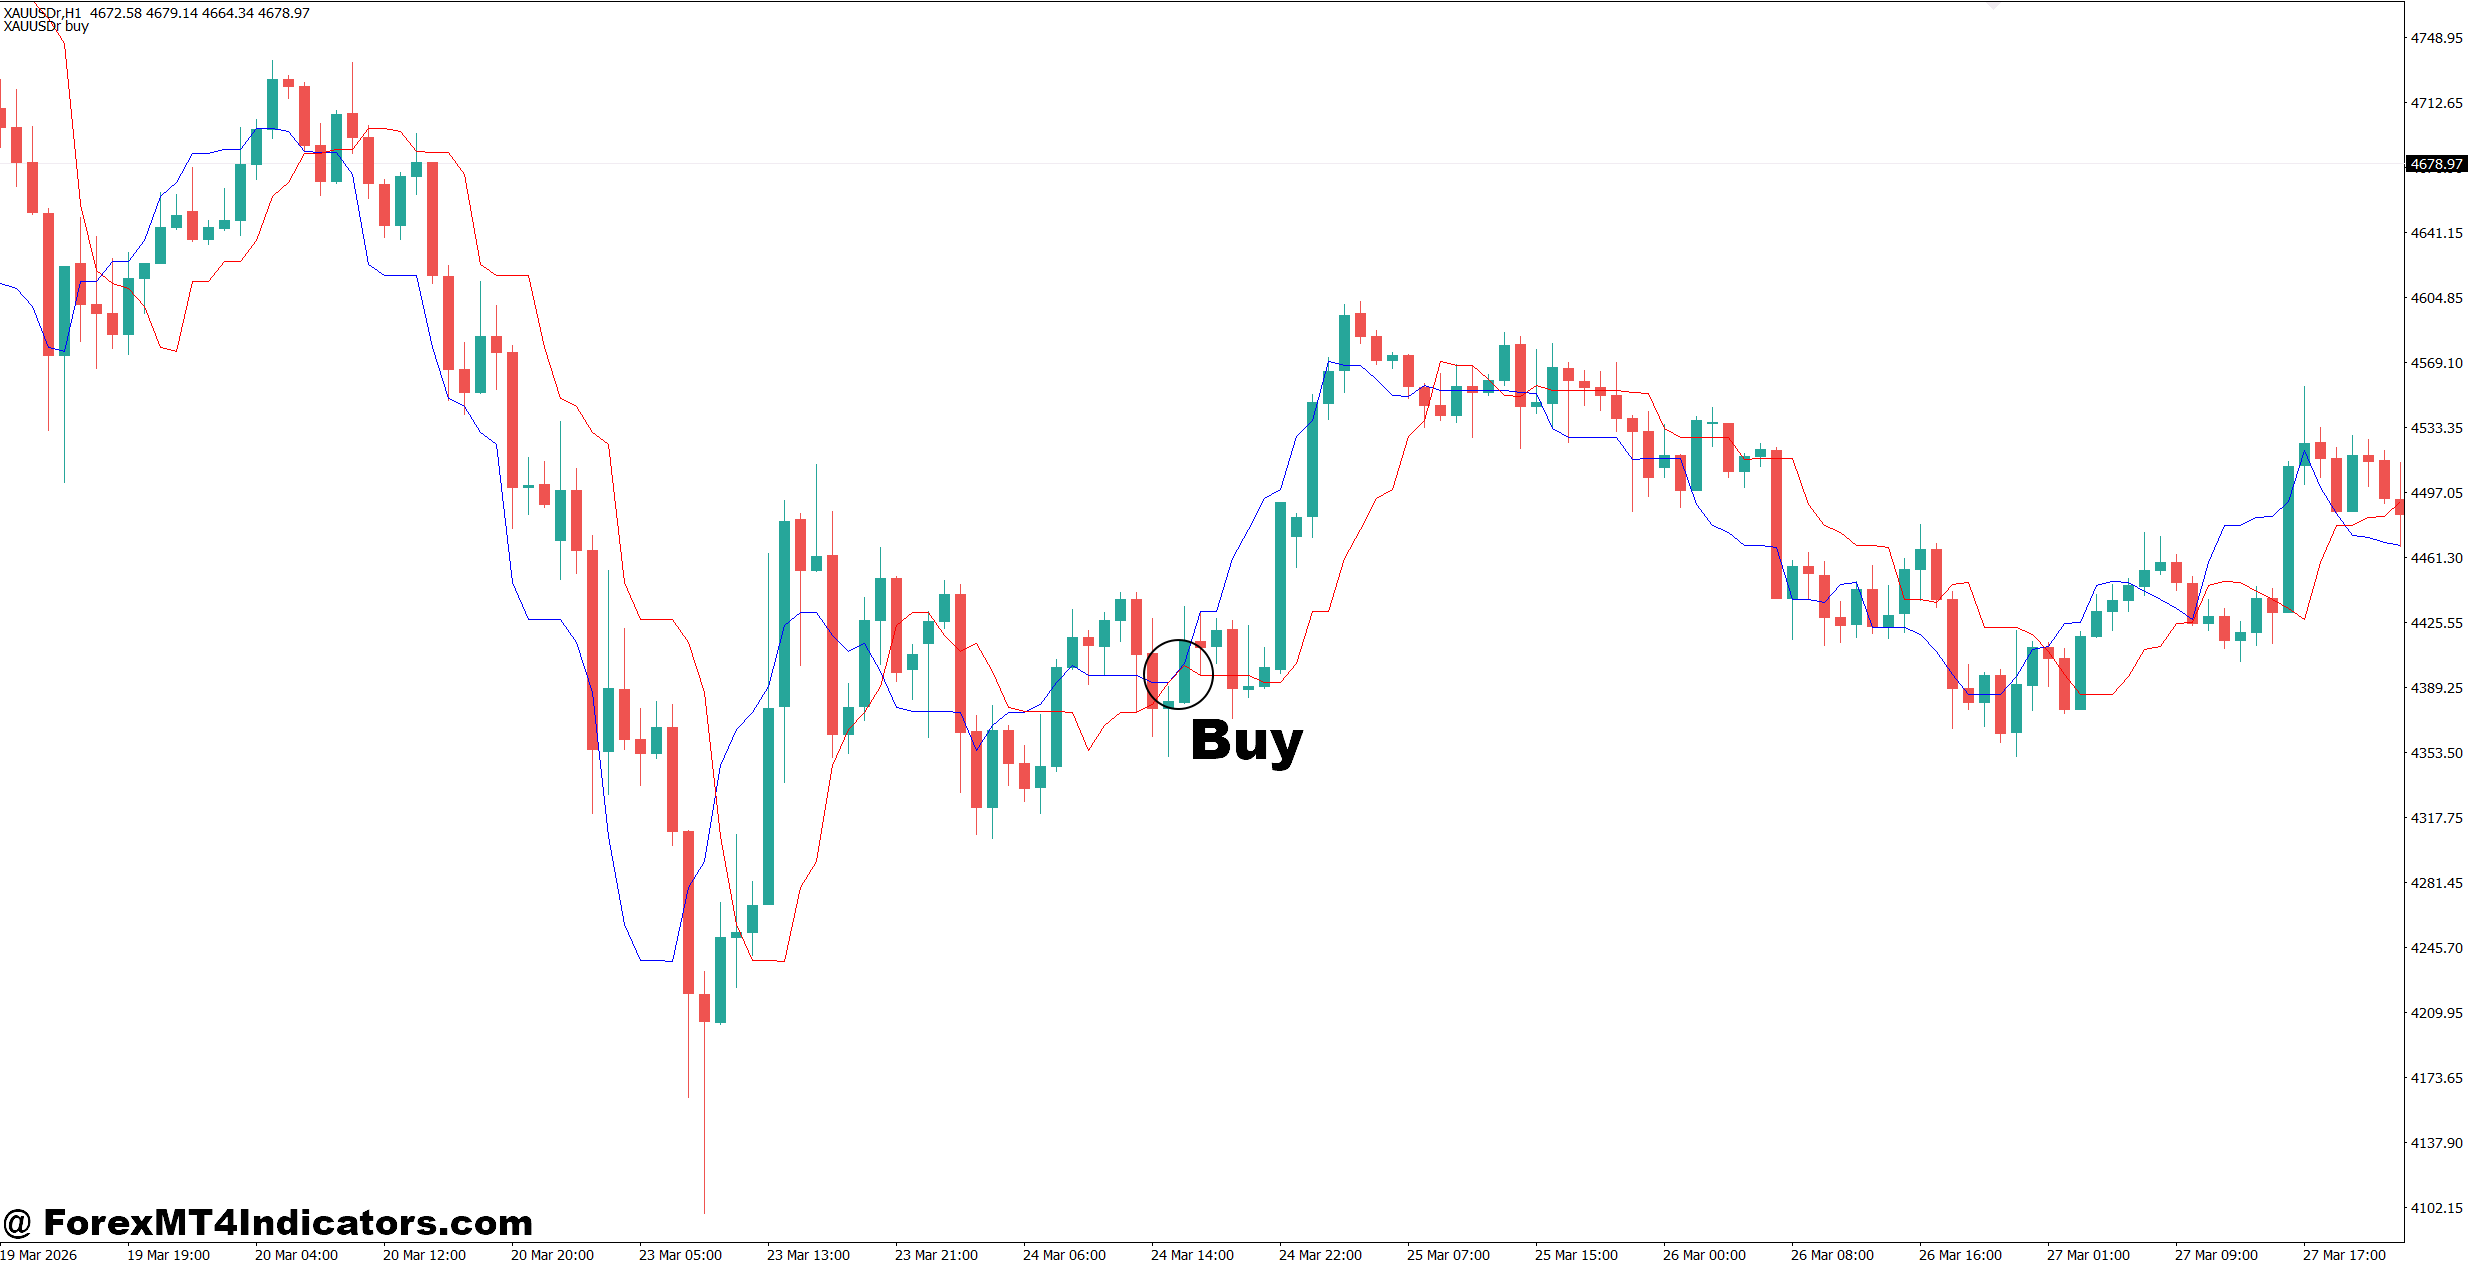
- Wait for a bullish trend signal – Enter a buy after the indicator turns bullish and the candle closes above it on the EUR/USD 1-hour chart.
- Confirm with higher highs – Buy only if price forms higher highs and higher lows with at least 20-30 pips of upside potential.
- Trade after a pullback – Enter after a retracement ends and the indicator stays bullish; place a 15-25 pip stop-loss below the swing low.
- Use multi-timeframe confirmation – Take buys when both the 4-hour and 1-hour charts show the same bullish trend.
- Risk only 1-2% – Keep position size small so one losing trade doesn’t risk more than 2% of account equity.
- Target nearby resistance – Aim for a reward of at least 40-60 pips or a 1:2 risk-to-reward ratio.
- Avoid major news events – Skip buy entries 15-30 minutes before high-impact news like NFP or CPI releases.
- Stay out in sideways markets – Don’t buy if the indicator changes direction repeatedly within the last 5-10 candles.
Sell Entry
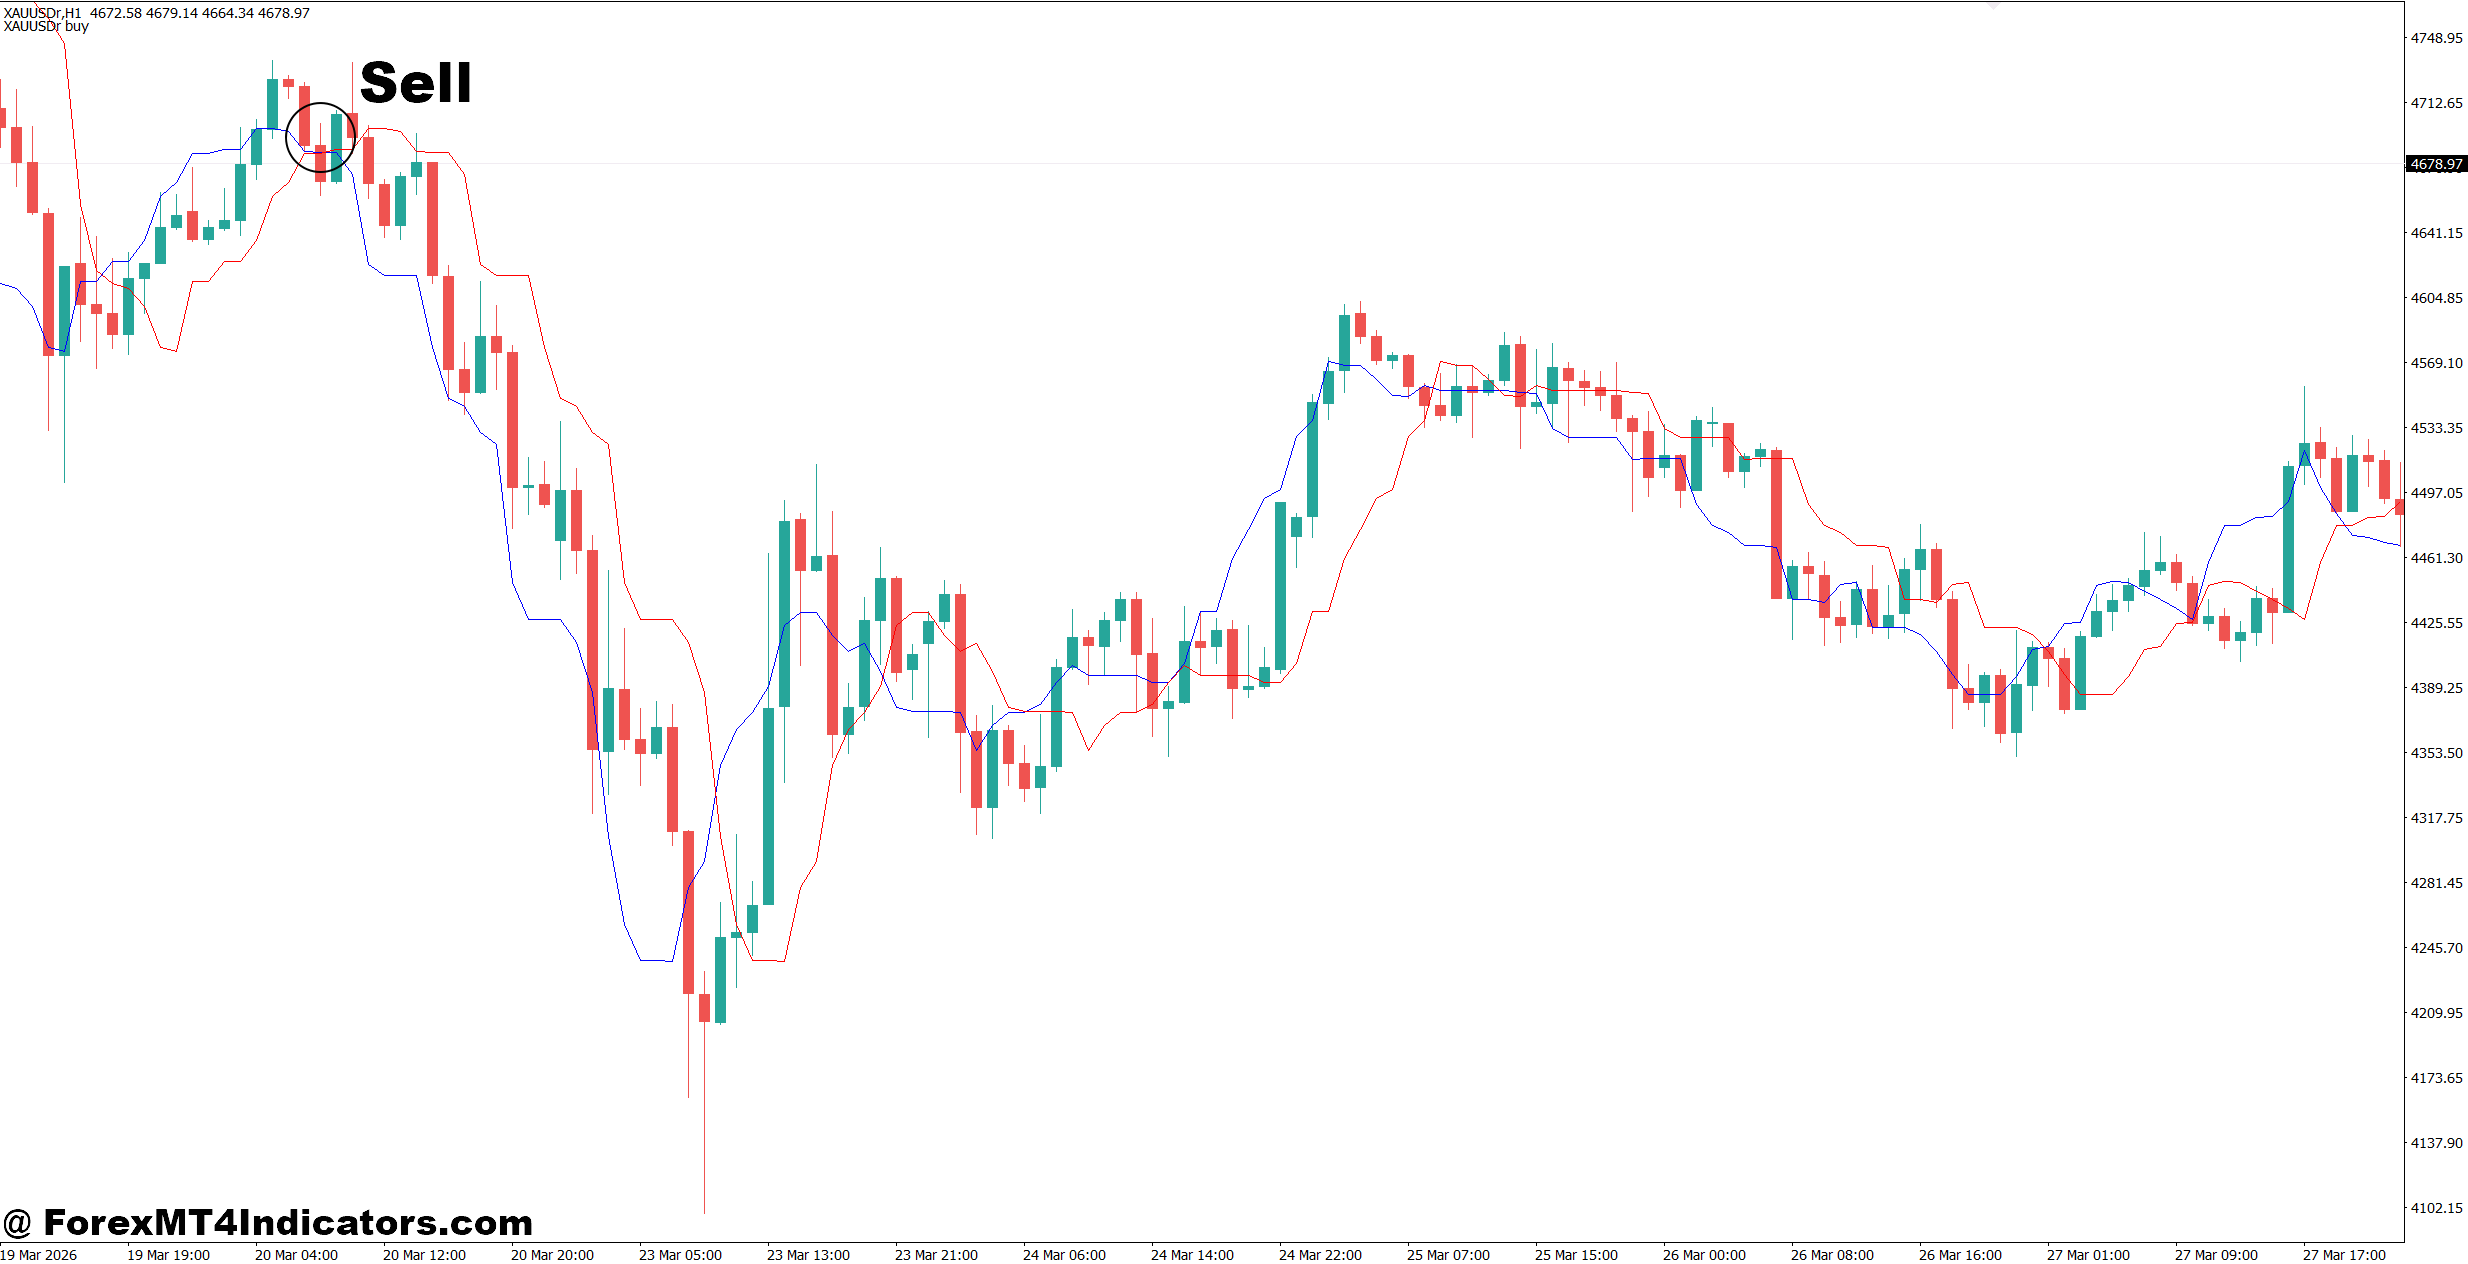
- Wait for a bearish trend signal – Sell after the indicator turns bearish and the candle closes below it on the GBP/USD 1-hour chart.
- Confirm lower lows – Enter only when price forms lower highs and lower lows with at least 20-30 pips of downside room.
- Sell after a pullback – Wait for a bearish rejection after a retracement and use a 15-25 pip stop-loss above the swing high.
- Check higher timeframe trend – Take sells only when the 4-hour and daily charts also point lower.
- Limit risk to 1-2% – Never risk more than 2% of your trading account on one position.
- Take profits near support – Target 40-60 pips or maintain a minimum 1:2 risk-to-reward ratio.
- Avoid choppy sessions – Skip sell signals during low-volatility Asian sessions if price is moving within a 15-20 pip range.
- Ignore weak signals – Don’t sell if price is holding above strong support despite a fresh bearish indicator signal.
The Trend Finder Indicator MT4 can become a valuable part of a trading plan, but only when combined with discipline, market structure analysis, and patience. It performs well during established trends, offers clear visual direction, and helps traders avoid some emotional decisions. At the same time, it can struggle during sideways markets and around major news events, so confirmation remains essential. Traders who pair trend signals with support and resistance, candlestick patterns, and sensible position sizing usually make more consistent decisions over time. Instead of searching for a perfect indicator, focus on building a repeatable trading process where the Trend Finder Indicator MT4 serves as one piece of a well-balanced strategy.
Level up your trading
Learn to read the chart — not just the indicator
eBook · Instant PDF
Video Course · 12 modules
Recommended MT4/MT5 Brokers
- ✓ *FREE *$50 to start (withdrawable)
- ✓ Deposit bonus up to $5,000
- ✓ Negative balance protection
Trading forex and CFDs carries a significant risk of loss and is not suitable for everyone. Broker links are affiliate links — we may earn a commission at no cost to you.
Free MT4 Indicator Download

Enter Your Email Address below, download link will be sent to you.
