


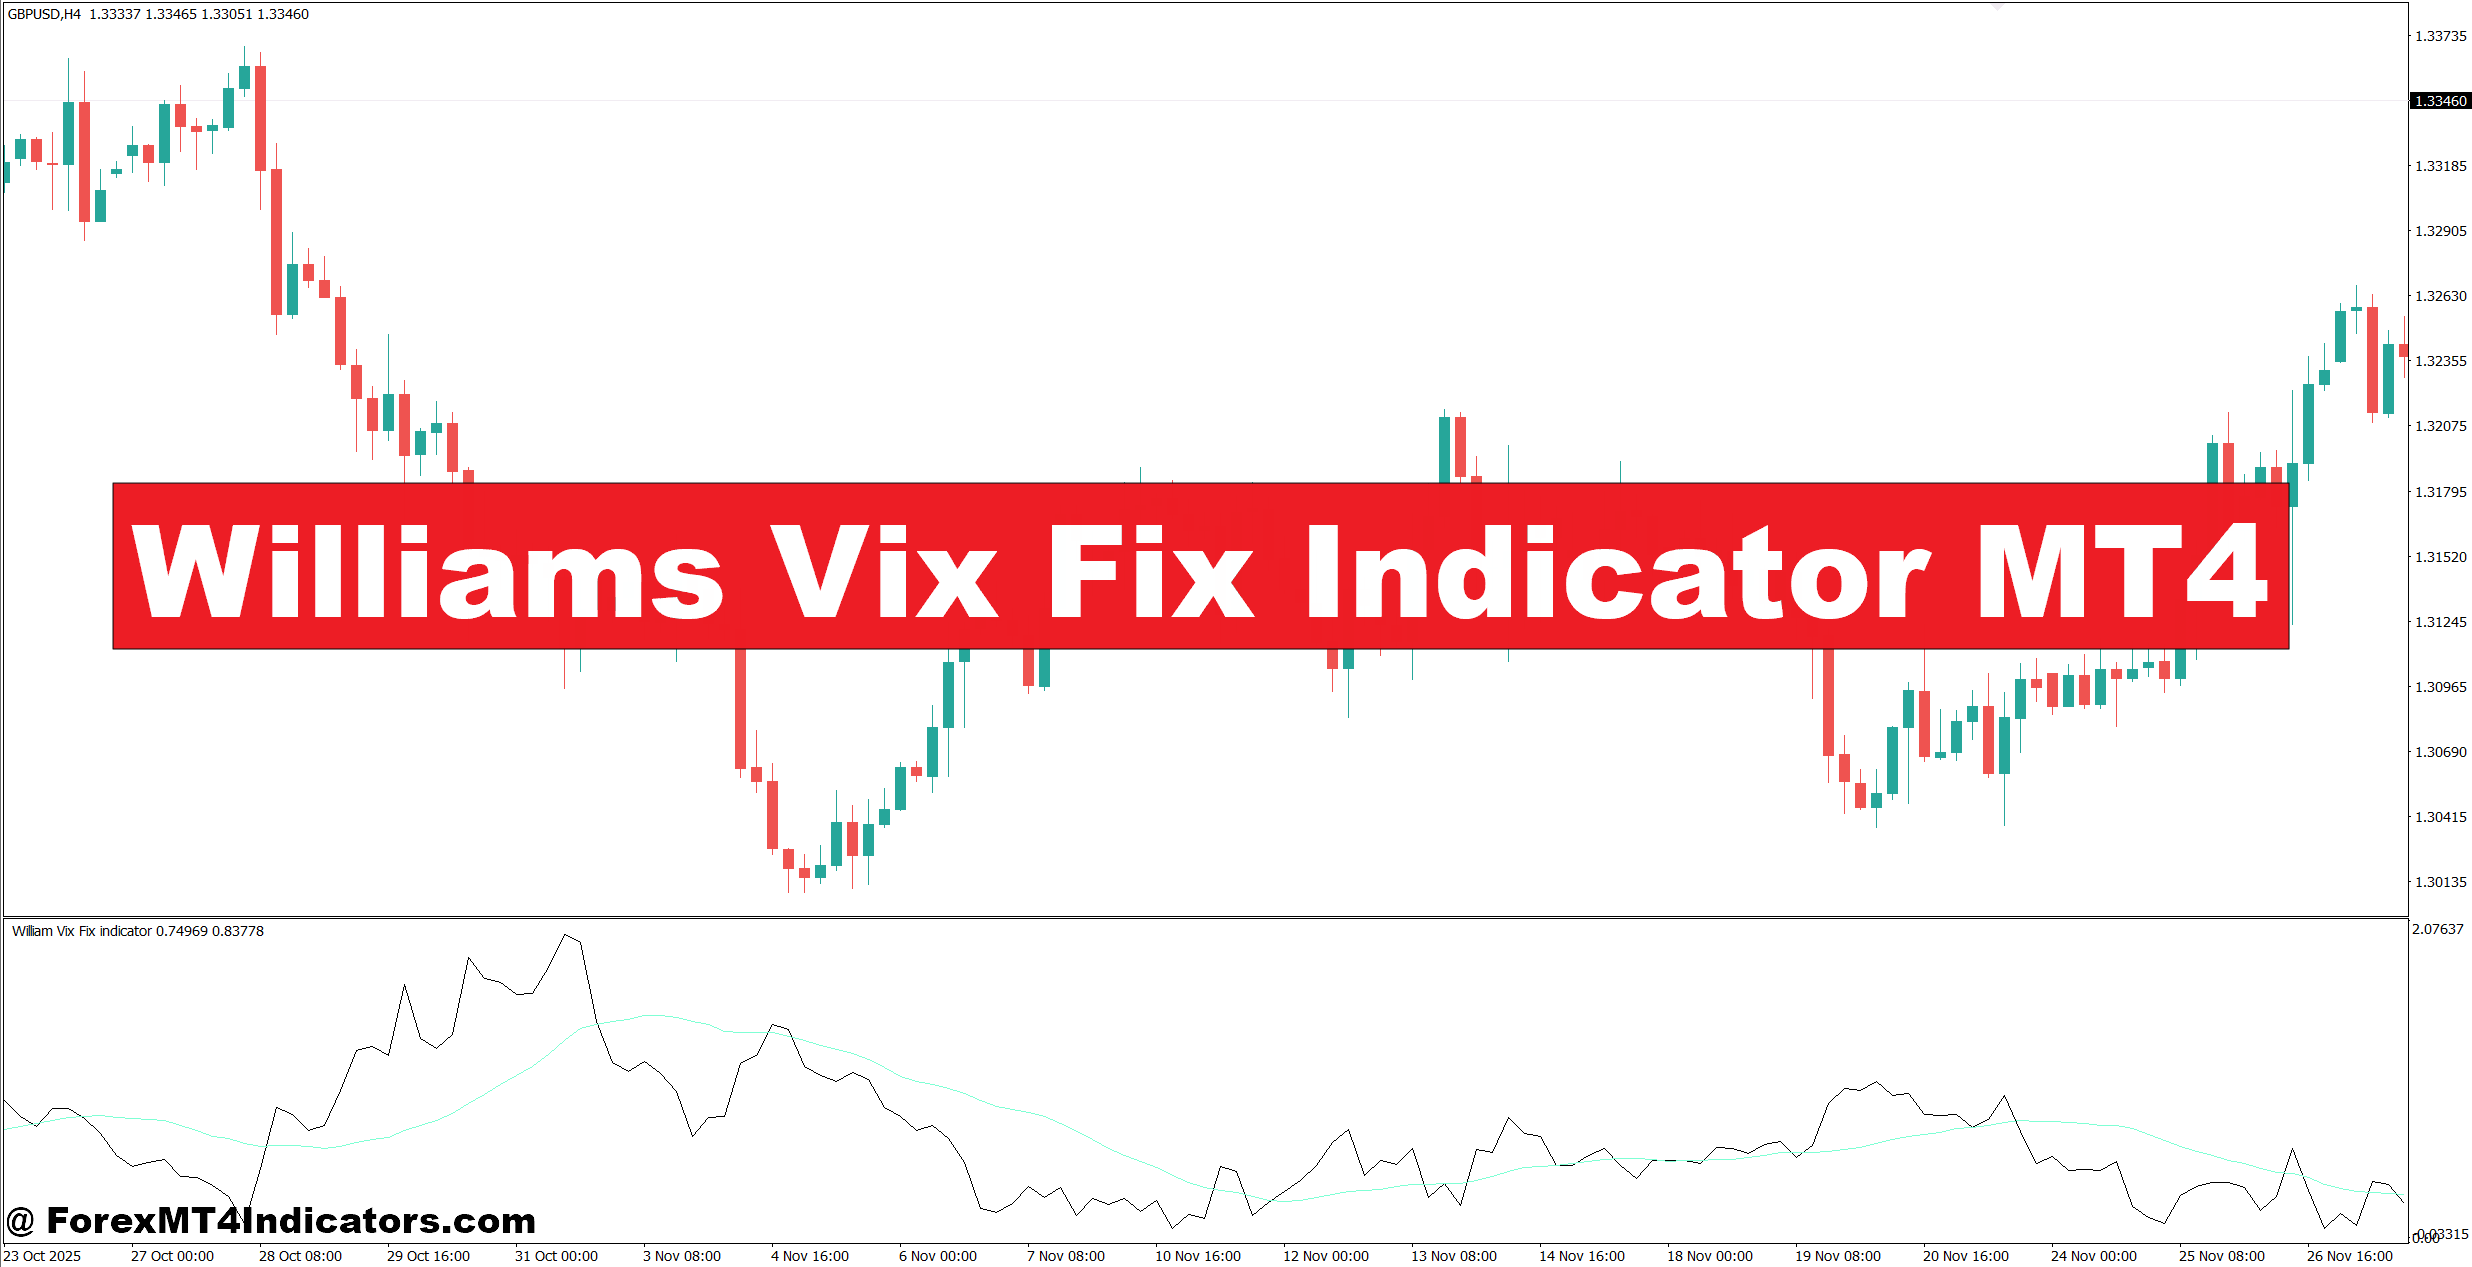
The Williams Vix Fix Indicator MT4 can help identify those moments by measuring unusual downside pressure and highlighting periods when the market may be reaching an extreme.
That problem matters because chasing an exhausted move can lead to quick losses. A 25-pip reversal on EUR/USD may wipe out a carefully planned trade, while repeated false entries can push a trading account into unnecessary drawdown. The Williams Vix Fix approaches the problem from a different angle. Instead of predicting the next candle, it looks for volatility conditions that have historically appeared near market lows.
The key is using it with price action, support and resistance, and trend confirmation. Here’s how traders can apply it without treating every indicator reading as a trade signal.
What Is the Williams Vix Fix Indicator MT4?
The Williams Vix Fix was developed by Larry Williams as a way to identify potential market bottoms through a volatility-based calculation. The original concept compares the current low with the highest close over a selected lookback period.
A simplified version of the calculation is:
Vix Fix = [(Highest Close over N periods − Current Low) ÷ Highest Close over N periods] × 100
The result rises when the current low moves significantly below recent closing levels. Many MT4 versions then apply a moving average or standard-deviation-based threshold to highlight unusually high readings.
A common setup uses a 22-period lookback, although traders can change this depending on the market and timeframe. Some versions display colored histogram bars when volatility reaches an extreme.
The important point is that a high reading doesn’t automatically mean price must rise. It means selling pressure has become unusual compared with the indicator’s recent history.
That distinction prevents a common mistake: buying simply because the histogram turns red or spikes upward.
What the Reading Tells Traders
Suppose EUR/USD trades around 1.0850 and suddenly falls to 1.0805 during a volatile London session. If that decline creates an unusually high Williams Vix Fix reading, the indicator is basically saying that the current downside move stands out compared with recent price behavior.
A trader can then check whether price has reached a known H1 support zone.
If support sits around 1.0800-1.0810 and the indicator reaches an extreme at the same time, the setup becomes more interesting. A bullish rejection candle or break above the previous candle’s high can provide the actual entry trigger.
This is much safer than treating the indicator itself as an automatic buy signal.
How to Trade Williams Vix Fix on MT4
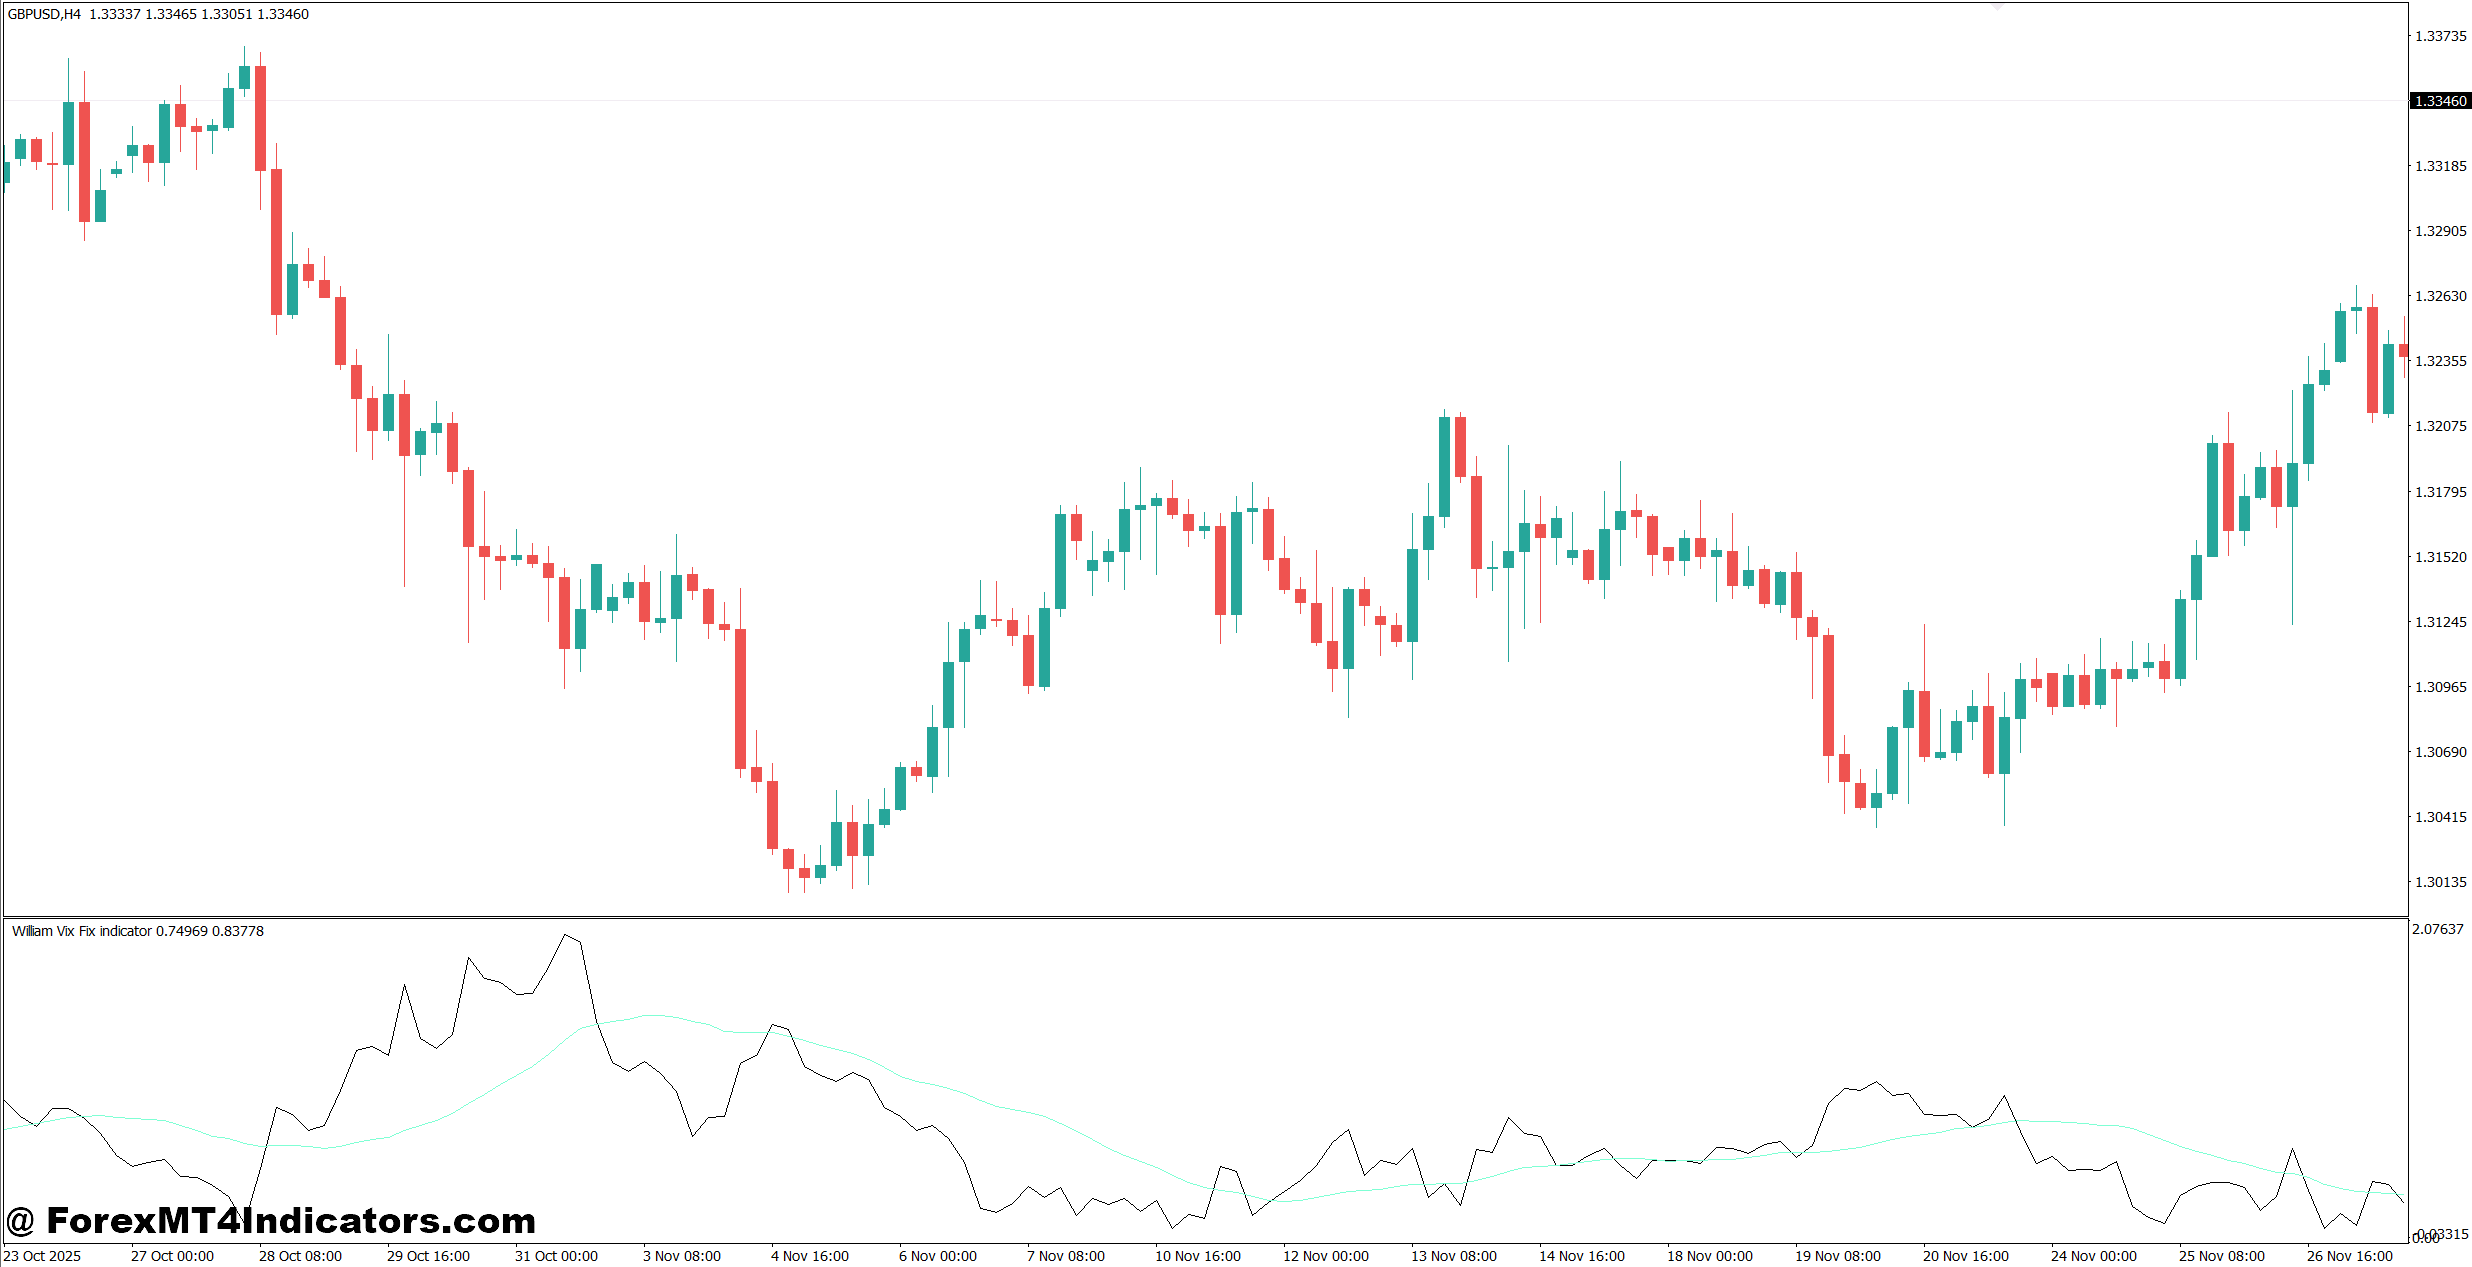
The indicator works best as a context tool. It can help traders identify stretched conditions, while price action decides whether an actual entry exists.
1. Look for an Extreme Reading Near Support
A high Vix Fix reading becomes more useful when it appears near established support.
For example, EUR/USD on the 1-hour chart has support at 1.0720. Price drops from 1.0785 to 1.0725 in four candles, while the Williams Vix Fix reaches one of its highest readings in the previous 30 candles.
Instead of buying immediately, the trader waits.
If the next H1 candle rejects 1.0720 and closes above 1.0740, the market has provided confirmation. A stop could sit around 15-20 pips below the support zone, depending on volatility.
2. Confirm With Market Structure
Market structure matters more than the indicator color.
If GBP/USD keeps printing lower highs and lower lows on the H1 chart, a Vix Fix spike may only identify a temporary pause in a downtrend. Buying against that structure can produce a short-lived bounce followed by another selloff.
A stronger reversal setup would show a Vix Fix extreme, a support reaction, and then a break of a nearby lower high.
For example, if GBP/USD forms a lower high at 1.2650 and later breaks above it after an extreme reading, the reversal has more technical support than the indicator reading alone.
3. Watch Volatility During Major News
When testing this method around volatile NFP sessions, traders should expect exaggerated readings.
A 50-pip EUR/USD candle immediately after the U.S. jobs report can push the indicator sharply higher. That doesn’t mean the market has reached its final low. News-driven moves can continue for another 30, 50, or even 100 pips.
During NFP, CPI, and FOMC releases, waiting for the first reaction to settle can reduce unnecessary whipsaw. Some traders wait 15-30 minutes after the initial release before evaluating the setup.
4. Combine It With RSI or Moving Averages
A second indicator can help filter weak signals.
For example, a trader might use a 14-period RSI with Williams Vix Fix. If EUR/USD produces an extreme Vix Fix reading while RSI falls below 30 near daily support, the market has two separate signs of unusually strong selling.
That still isn’t a guarantee of a reversal.
A trader could wait for RSI to move back above 30 and price to reclaim a nearby resistance level before entering.
Settings for Different Timeframes and Currency Pairs
The default parameters aren’t necessarily ideal for every chart. A 22-period lookback has a very different meaning on an M5 chart than on a daily chart.
For M1-M5 scalping, traders may test shorter settings such as 10-14 periods. These respond faster but also generate more noise. This makes them vulnerable to short-term fake-outs.
On M15-H1 charts, settings around 20-22 periods provide a useful starting point. Traders can then compare historical signals across several months rather than changing parameters after every losing trade.
For H4 and daily charts, a 22-30 period lookback can help identify larger volatility extremes. However, fewer signals will appear.
Currency pair behavior also matters. GBP/JPY, for example, usually produces larger intraday swings than EUR/USD. A setting that works reasonably well on EUR/USD may generate too many extreme readings on GBP/JPY.
A practical approach is to test one setting across at least 50-100 historical signals before deciding whether it fits the pair.
Williams Vix Fix vs RSI, Bollinger Bands, and ATR
Williams Vix Fix has a different purpose from many common indicators.
RSI measures momentum and can identify overbought or oversold conditions. But RSI can remain below 30 during a strong downtrend. Williams Vix Fix instead focuses on unusual downside price behavior.
Bollinger Bands measure price deviation from a moving average. A candle touching the lower band doesn’t necessarily mean a reversal is coming. Williams Vix Fix can add another perspective by identifying whether the downside move is unusually extreme relative to its lookback period.
ATR measures average true range and is useful for estimating volatility and setting stops. It doesn’t specifically identify potential market bottoms. A trader could use ATR to determine whether a 20-pip stop is realistic after Williams Vix Fix identifies an extreme.
This makes the tools complementary rather than interchangeable.
A practical combination might be Williams Vix Fix for identifying an extreme, H1 support for location, RSI for momentum confirmation, and ATR for stop placement.
Advantages and Limitations Traders Should Know
The biggest advantage is simplicity. The indicator can quickly highlight periods when downside volatility becomes unusual, which helps traders focus their attention on potential reversal areas.
It can also work across different timeframes and currency pairs. That’s useful for traders who scan several markets rather than watching one pair all day.
But there are clear limitations.
A volatility extreme can become even more extreme. During a strong bearish trend, several Vix Fix spikes may appear before price finally reverses. The indicator can also react strongly to economic releases, creating signals that look attractive but fail within a few candles.
For that reason, traders should avoid using it as a standalone entry system. Position size should remain controlled, and stop-loss placement should reflect the actual market structure rather than an arbitrary number.
Trading forex carries substantial risk. No indicator guarantees profits. Traders can lose some or all of their trading capital, and historical behavior doesn’t guarantee future results.
How to Trade with Williams Vix Fix Indicator MT4
Buy Entry
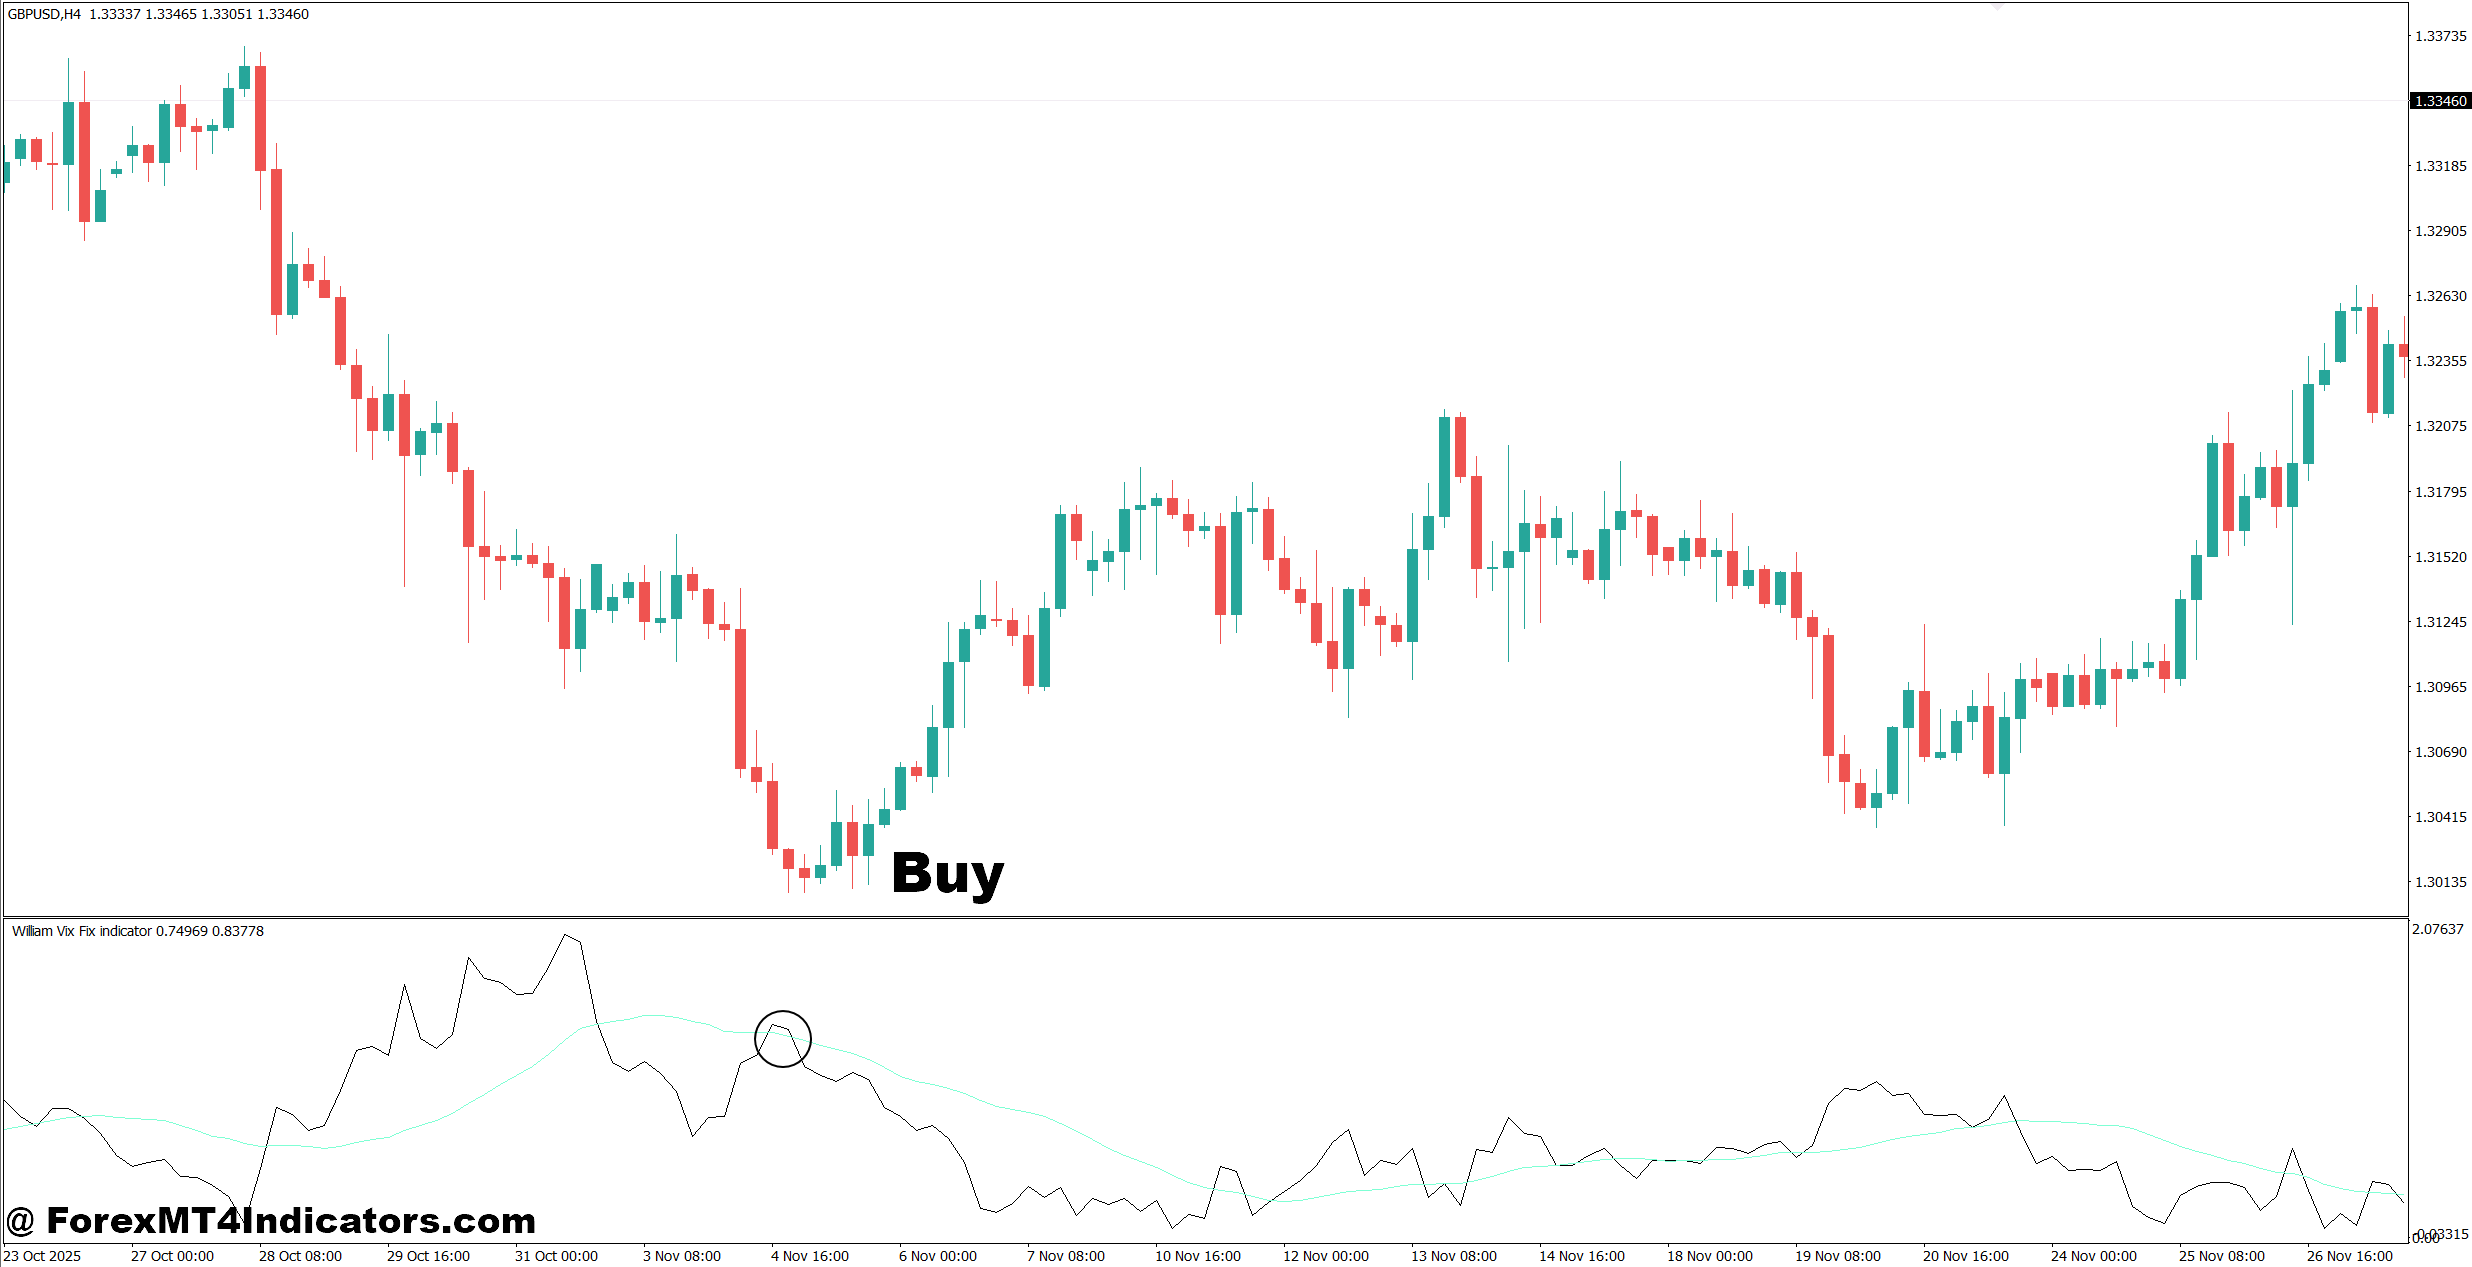
- Wait for a Vix Fix spike – Look for an extreme reading after a sharp drop, especially near established support on the H1 chart.
- Confirm H1 support – Consider a BUY when EUR/USD rejects a support zone such as 1.0800-1.0810 and closes bullish.
- Check for a bullish candle – Enter after a strong bullish rejection candle closes, rather than buying during the initial Vix Fix spike.
- Use RSI confirmation – A Vix Fix extreme with 14-period RSI below 30 can strengthen a reversal setup on EUR/USD or GBP/USD.
- Target 20-40 pips – On an H1 setup, consider a 20-40 pip initial target while keeping the stop near a logical structure level.
- Risk only 1% – Keep account risk around 0.5%-1% per trade, even when the Vix Fix signal looks unusually strong.
- Check the higher timeframe – A BUY on H1 is stronger when the 4-hour chart shows support or a broader bullish structure.
- Avoid strong bearish trends – Don’t BUY simply because Vix Fix spikes; skip the trade if GBP/USD continues making lower lows without bullish confirmation.
Sell Entry
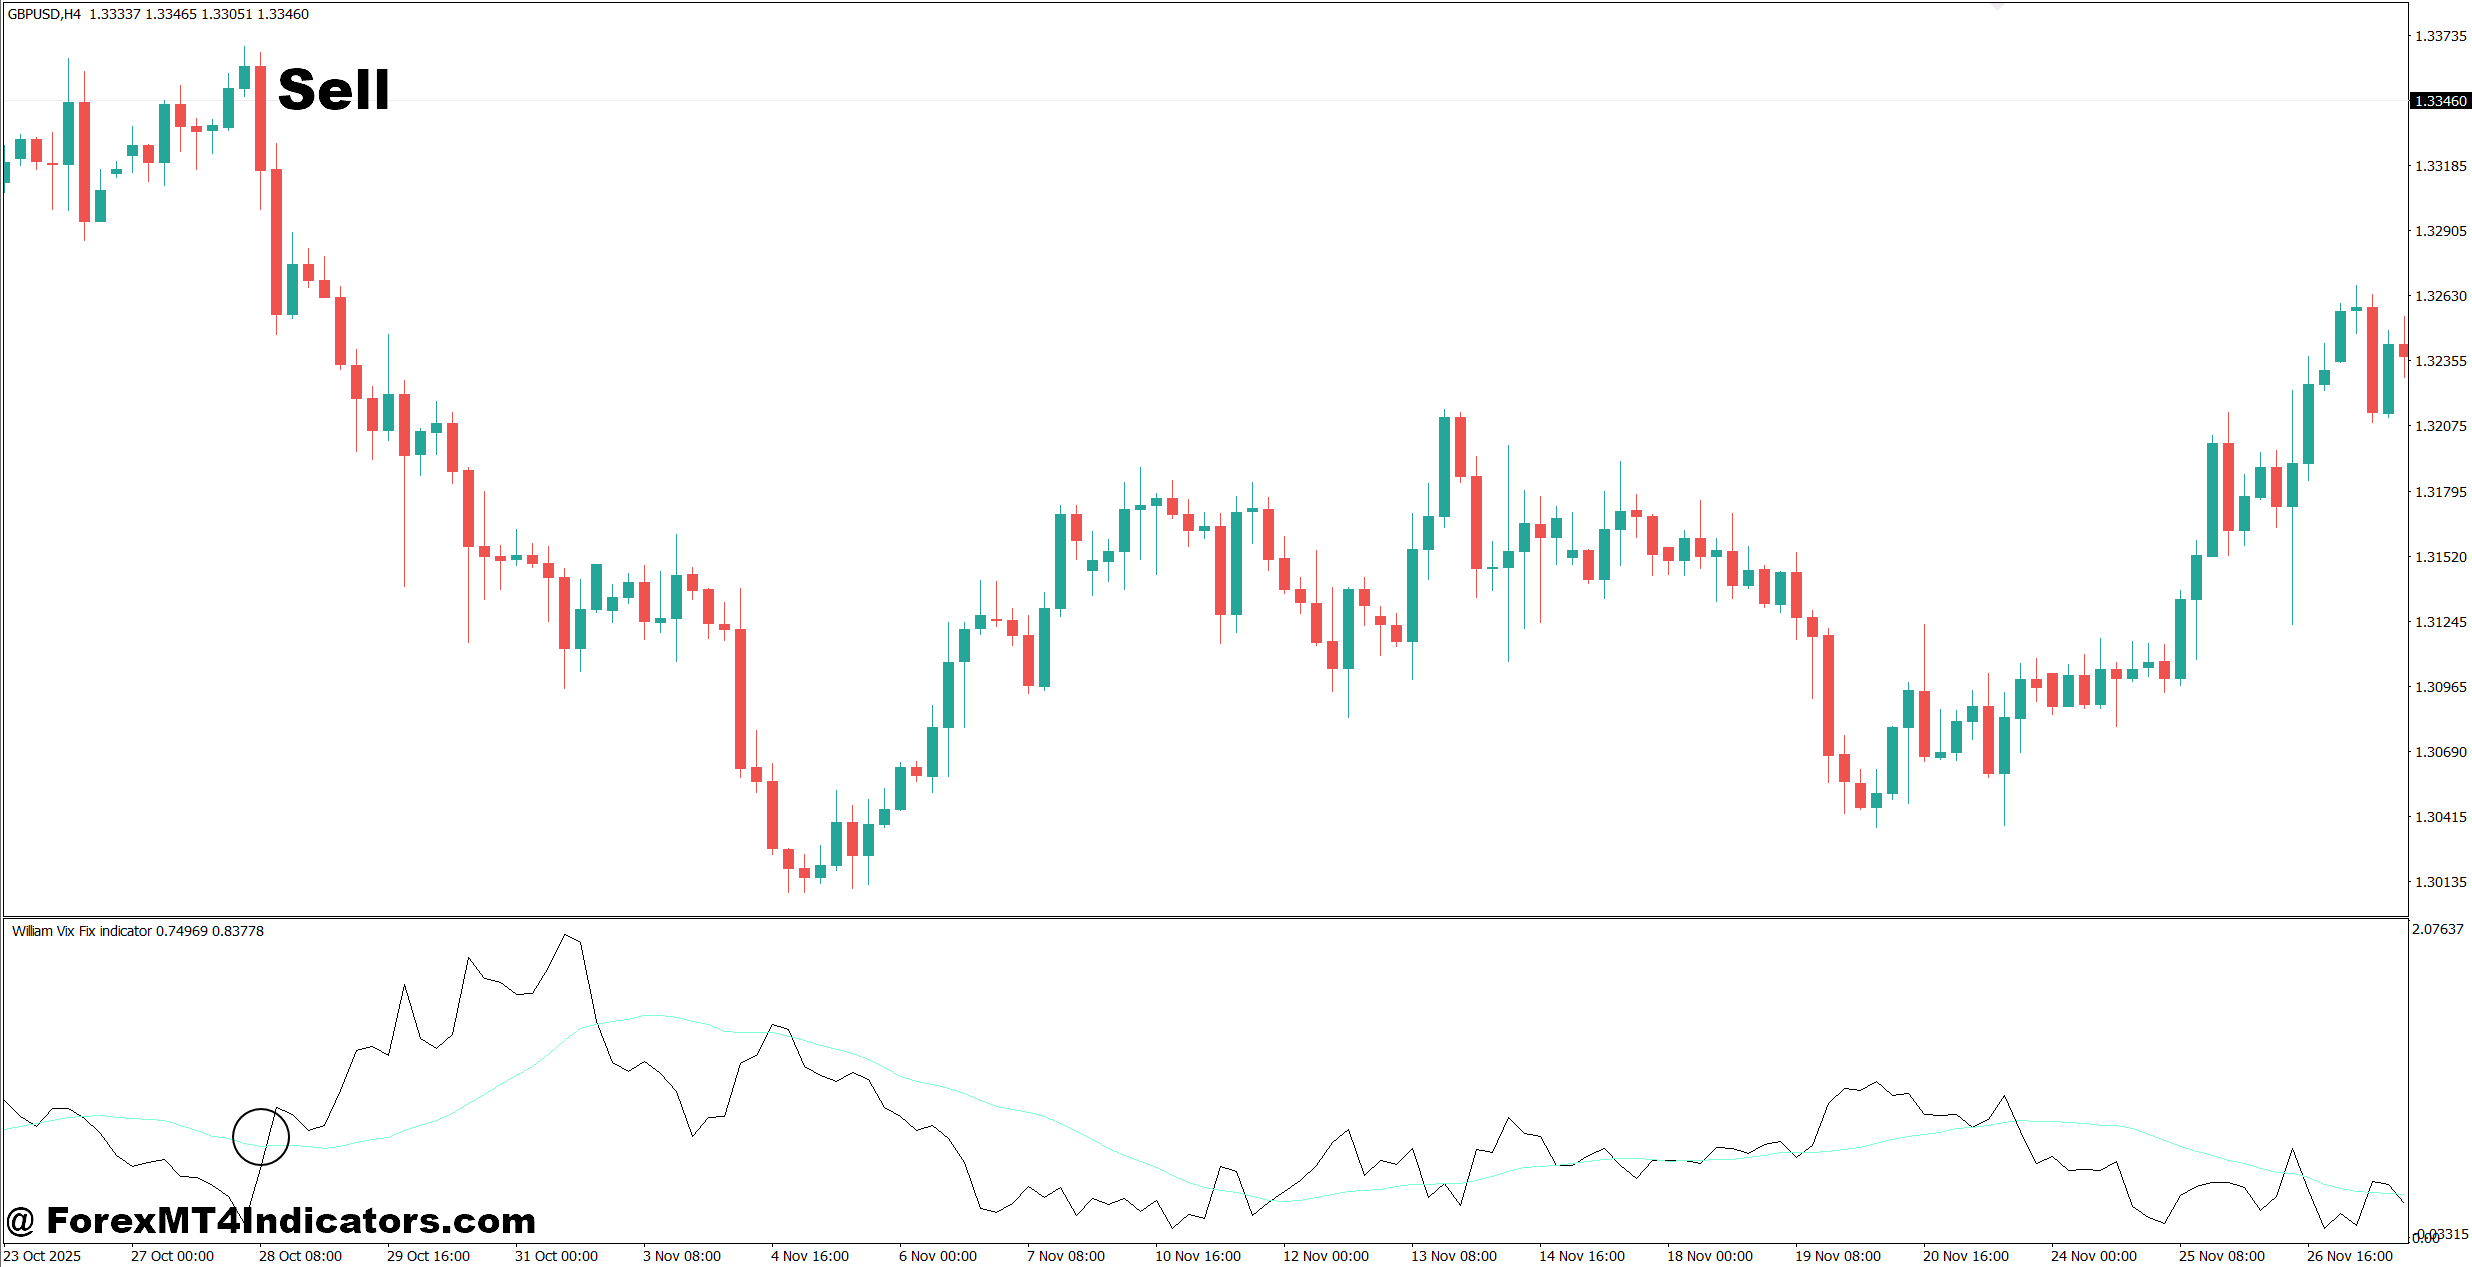
- Watch for a failed rebound – After a Vix Fix extreme, wait for price to reject resistance and form a lower high before considering a SELL.
- Confirm resistance on H1 – GBP/USD rejecting an area such as 1.2750-1.2770 can provide a practical location for a short setup.
- Wait for bearish structure – Enter after price breaks a nearby H1 swing low rather than selling immediately at the first reversal candle.
- Use RSI confirmation – A 14-period RSI falling below 50 after a failed recovery can support the bearish setup.
- Check the 4-hour trend – Prefer SELL trades when the 4-hour chart shows lower highs and lower lows instead of fighting a clear uptrend.
- Set a 20-35 pip stop – For a typical H1 setup, place the stop beyond the recent swing high and adjust it for current volatility.
- Limit risk to 1% – Keep each position around 0.5%-1% account risk, particularly when trading GBP/USD during volatile sessions.
- Avoid selling into major support – Don’t SELL EUR/USD just because momentum looks bearish if daily support is only 15-20 pips below the entry.
Conclusion
The Williams Vix Fix Indicator MT4 is most useful when traders treat it as an extreme-condition detector rather than a buy-or-sell machine.
- It can highlight unusually strong downside pressure.
- Support and resistance can help determine whether the extreme occurs at a meaningful location.
- RSI, market structure, and ATR can provide useful confirmation and risk-management information.
- Different pairs and timeframes require testing rather than blindly copying default settings.
In practice, the best signals often come when several factors line up. A Vix Fix spike at random mid-range prices deserves less attention than the same spike at H1 support followed by a bullish structure break. Traders should test the setup on historical data and a demo account before risking real money.
Level up your trading
Learn to read the chart — not just the indicator
eBook · Instant PDF
Video Course · 12 modules
Recommended MT4/MT5 Brokers
- ✓ *FREE *$50 to start (withdrawable)
- ✓ Deposit bonus up to $5,000
- ✓ Negative balance protection
Trading forex and CFDs carries a significant risk of loss and is not suitable for everyone. Broker links are affiliate links — we may earn a commission at no cost to you.
Free MT4 Indicator Download

Enter Your Email Address below, download link will be sent to you.
