


Last updated:
What is the RSI MA indicator for MT4? It combines the Relative Strength Index with a moving average filter and plots the signals directly on your price chart — so you see potential reversals, overbought/oversold zones, and trend strength without watching a separate RSI window. Download it free below, then read how the two tools work together. If you trade RSI on its own, our RSI strategy guide covers the classic rules.
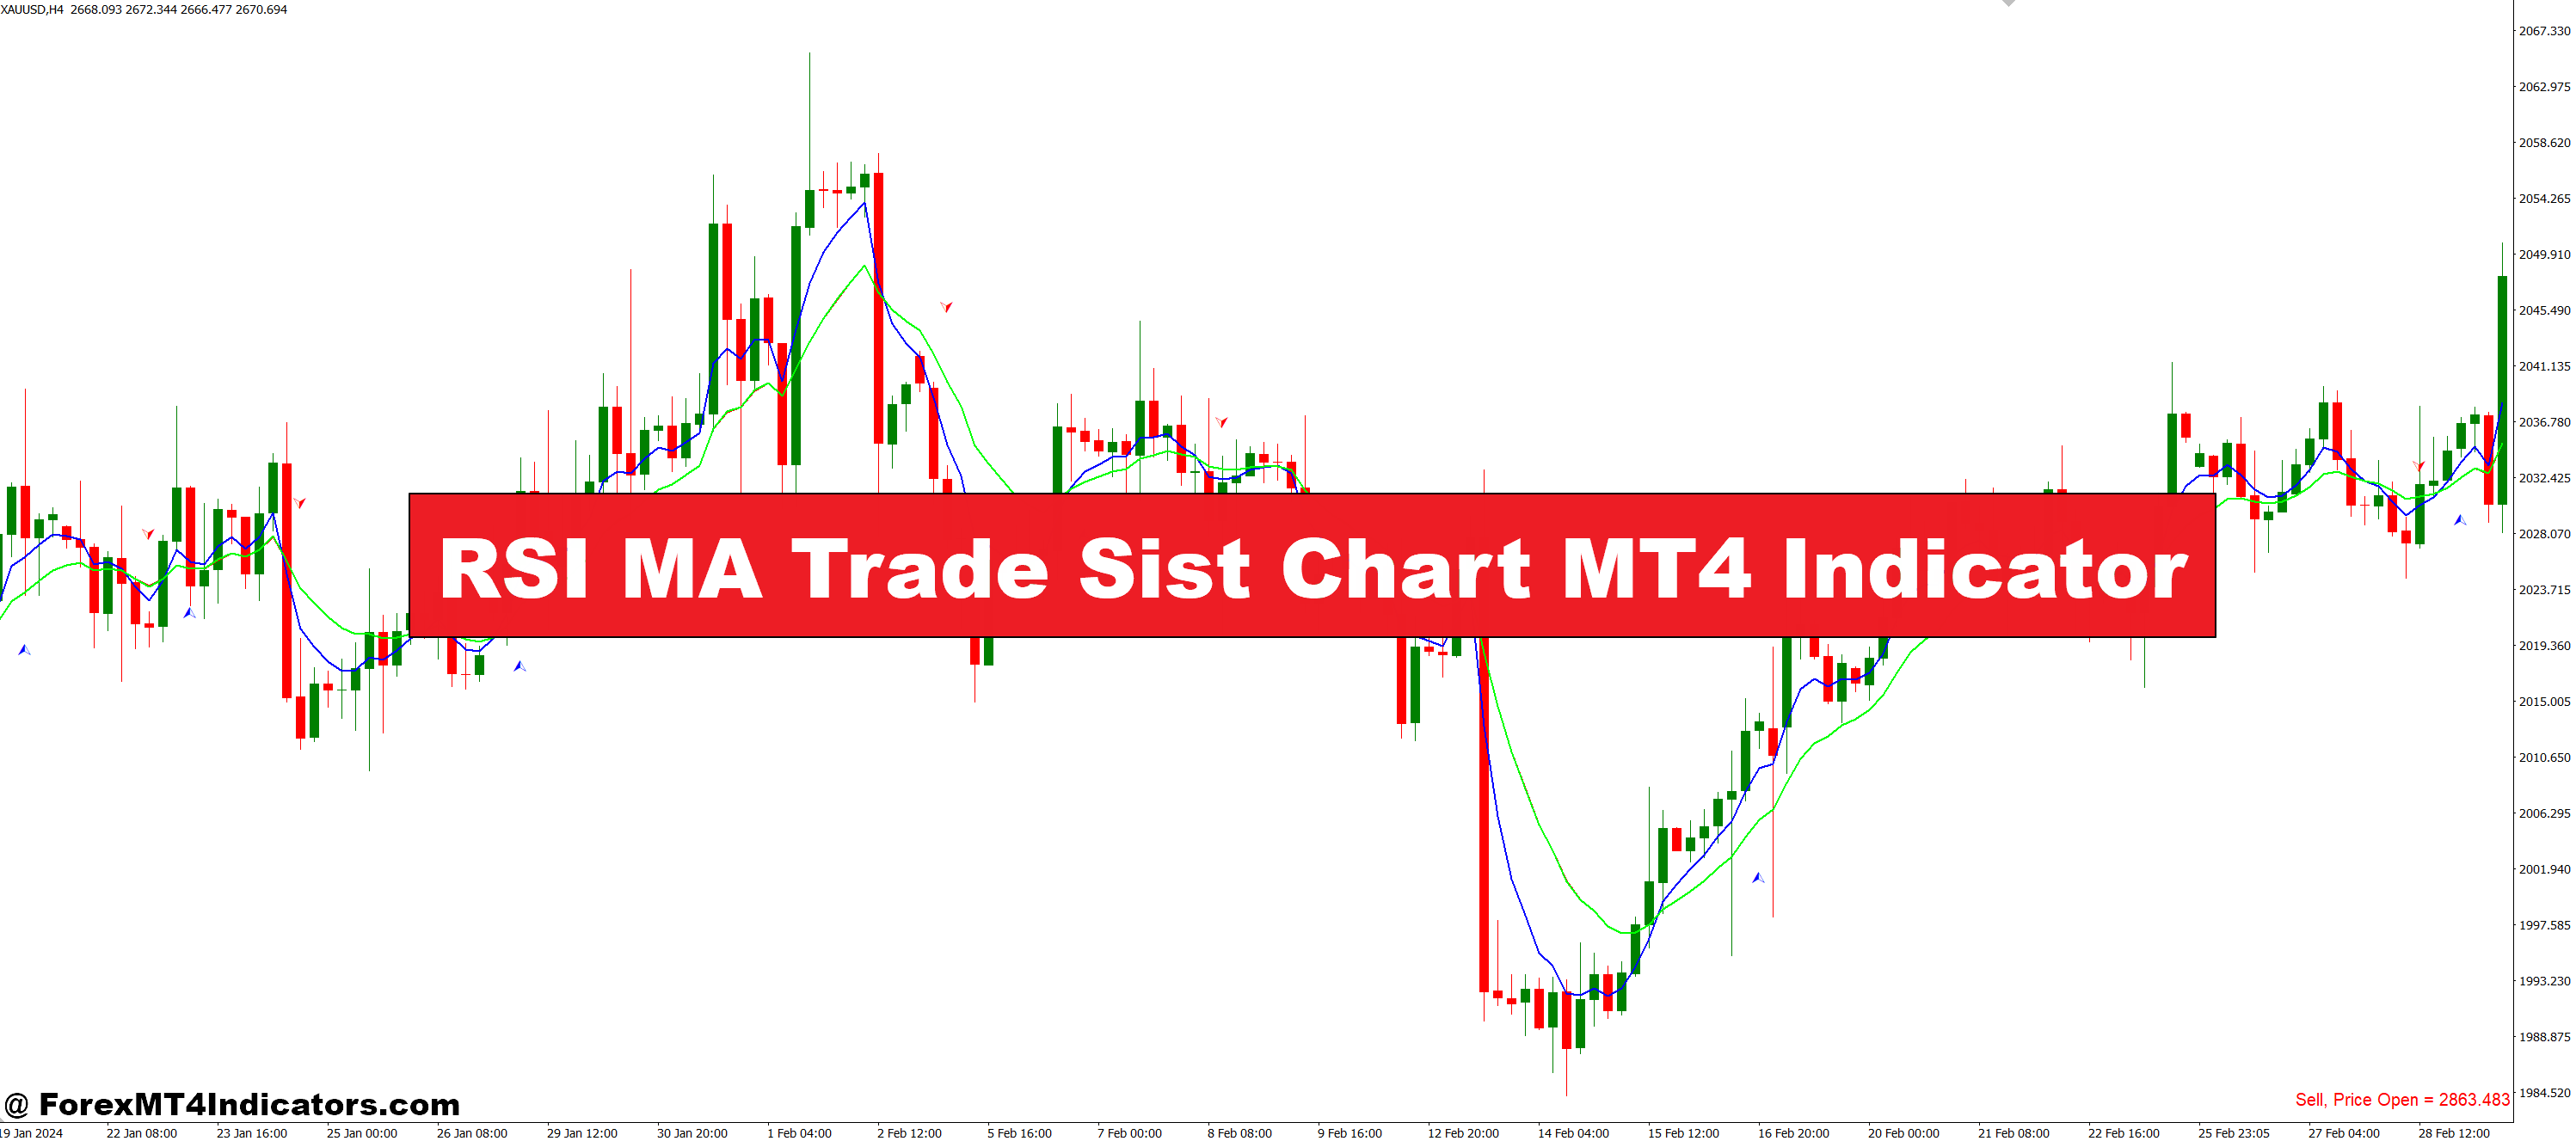
The RSI MA Trade Sist Chart MT4 Indicator is a smart blend of two popular technical analysis tools: the Relative Strength Index (RSI) and Moving Averages (MA). This custom indicator plots visual signals directly on your chart, helping traders see potential reversals, overbought/oversold zones, and trend strength. It’s designed for all skill levels and works on most timeframes, making it a flexible choice for day traders, scalpers, and swing traders alike.
Why Combine RSI and Moving Averages?
RSI alone shows if a market is overbought or oversold, but it can give false signals during strong trends. Moving averages help confirm the overall direction, smoothing out price action. By combining both, the RSI MA Trade System Chart gives a clearer view of market momentum and potential turning points. This combo helps reduce guesswork and offers a better shot at making solid entries and exits.
How It Helps in Real Trading
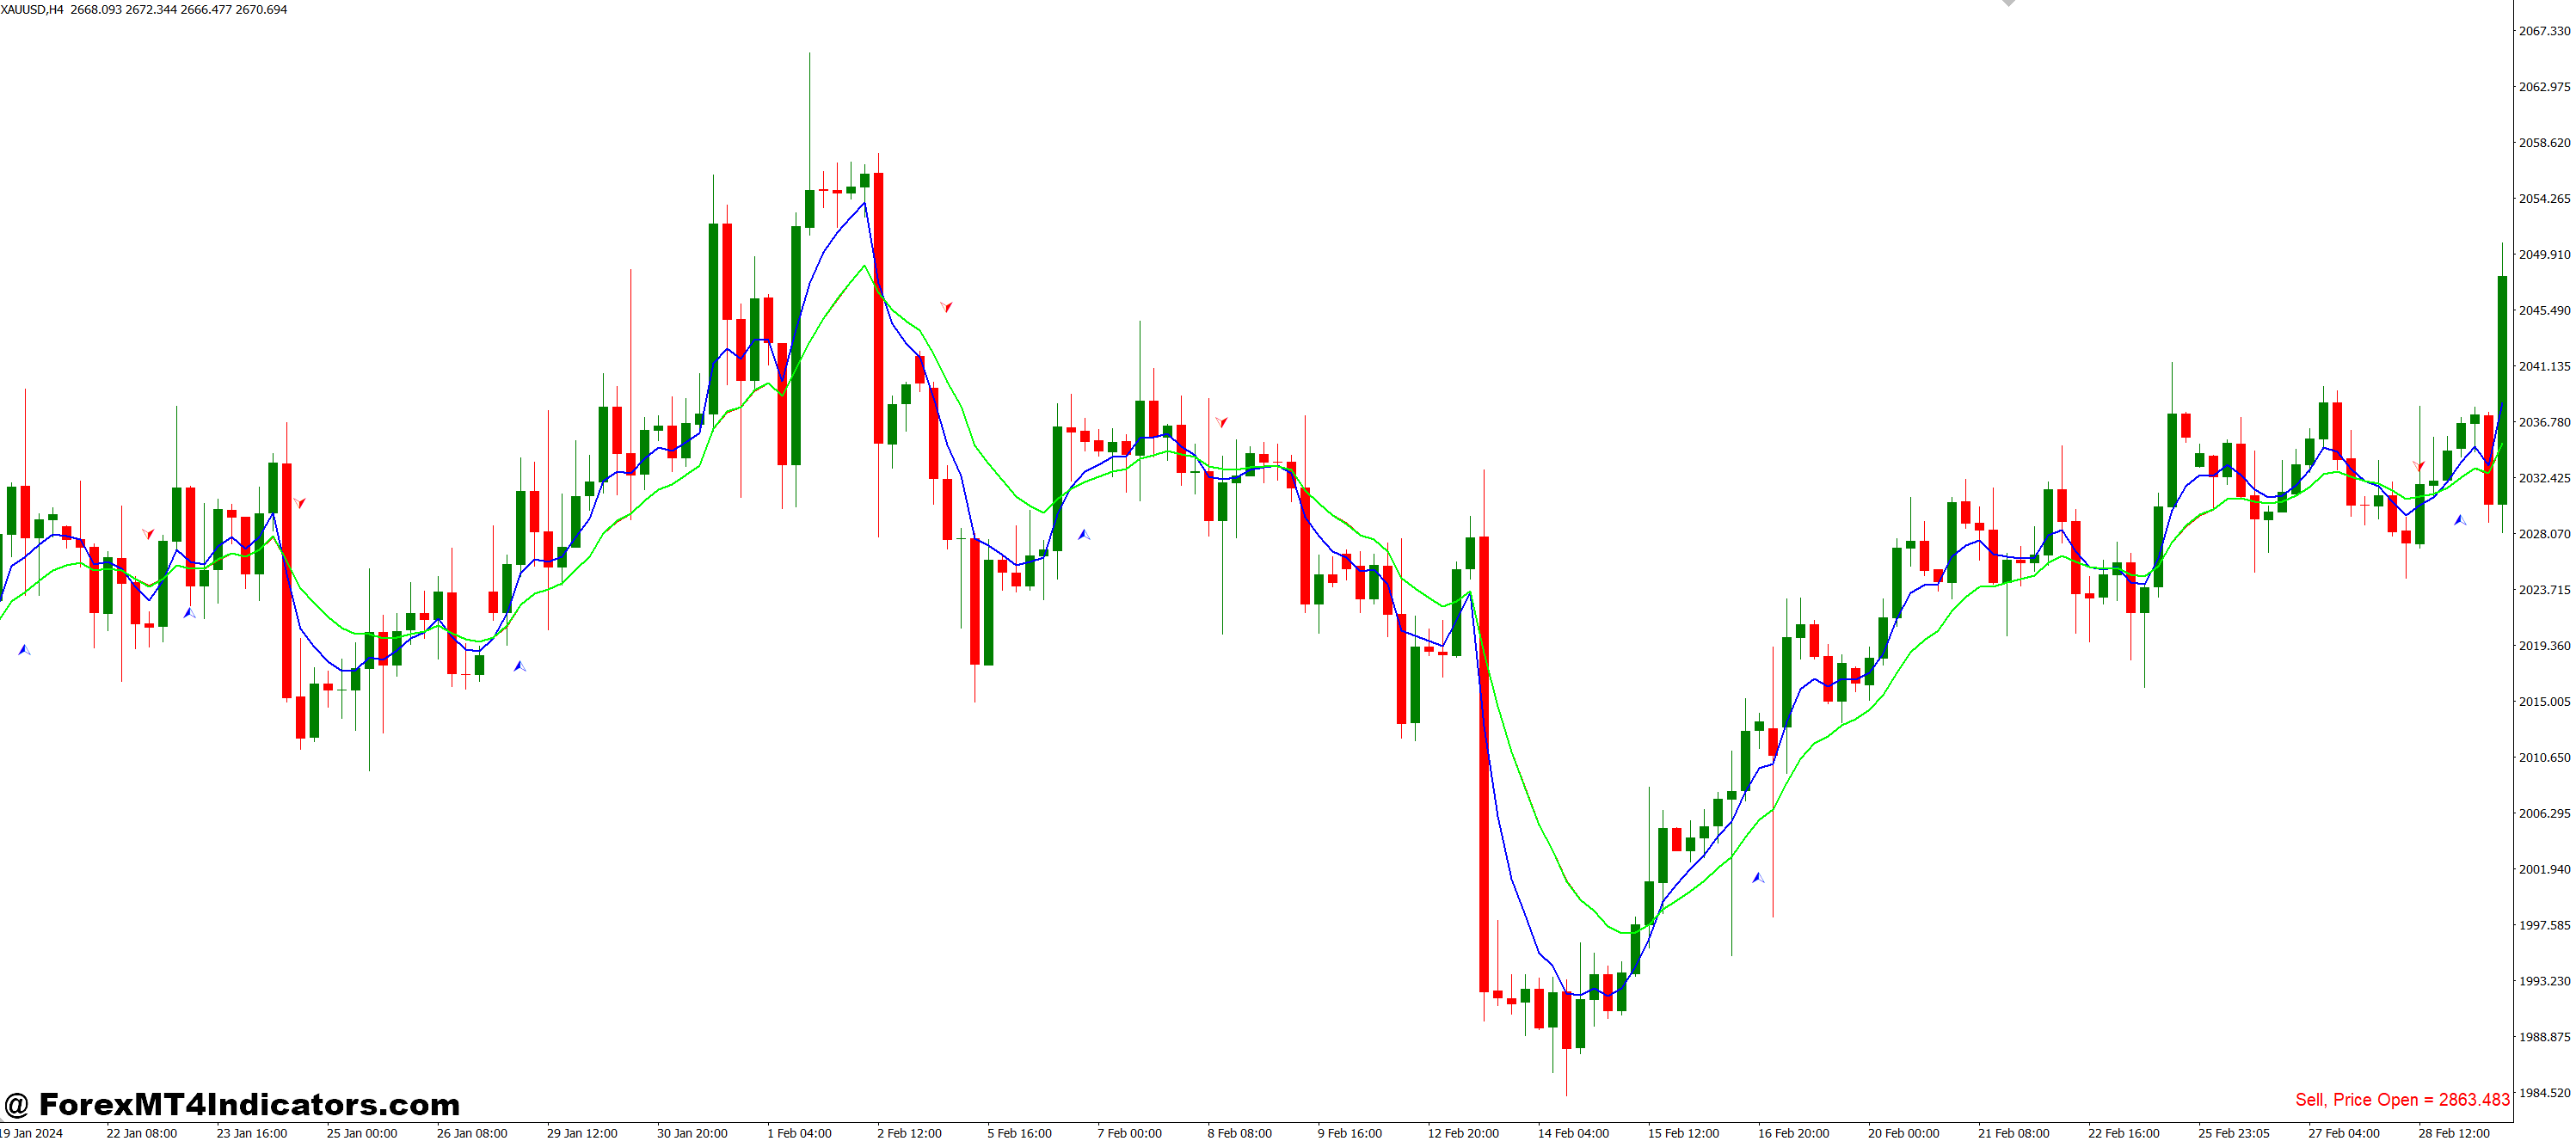
Once applied to the MT4 chart, the indicator displays arrows or signals based on RSI crossing specific MA levels. These alerts can suggest trend continuation or reversal points. For example, a bullish signal may appear when RSI crosses above a moving average from below, indicating building momentum. These visual cues save time and remove much of the emotional bias that can cloud judgment during live trades.
Why Put RSI on the Chart Instead of a Sub-Window?
The standard RSI lives in a panel under the chart, which forces you to glance away from price at the moment you need to act. Plotting RSI-based signals on the chart itself keeps your eyes on the candles: the signal appears where you would place the trade. The moving-average component smooths the raw RSI, which cuts down the rapid flip-flopping the oscillator produces in choppy conditions — you get fewer signals, and the ones that remain lean on momentum that has already been filtered once. The trade-off is the same as with any smoothing: signals arrive slightly later than raw RSI crosses. Neither version predicts anything — treat every signal as a prompt to check structure and manage risk, not a guarantee.
How to Trade with RSI MA Trade Sist Chart MT4 Indicator
Buy Entry
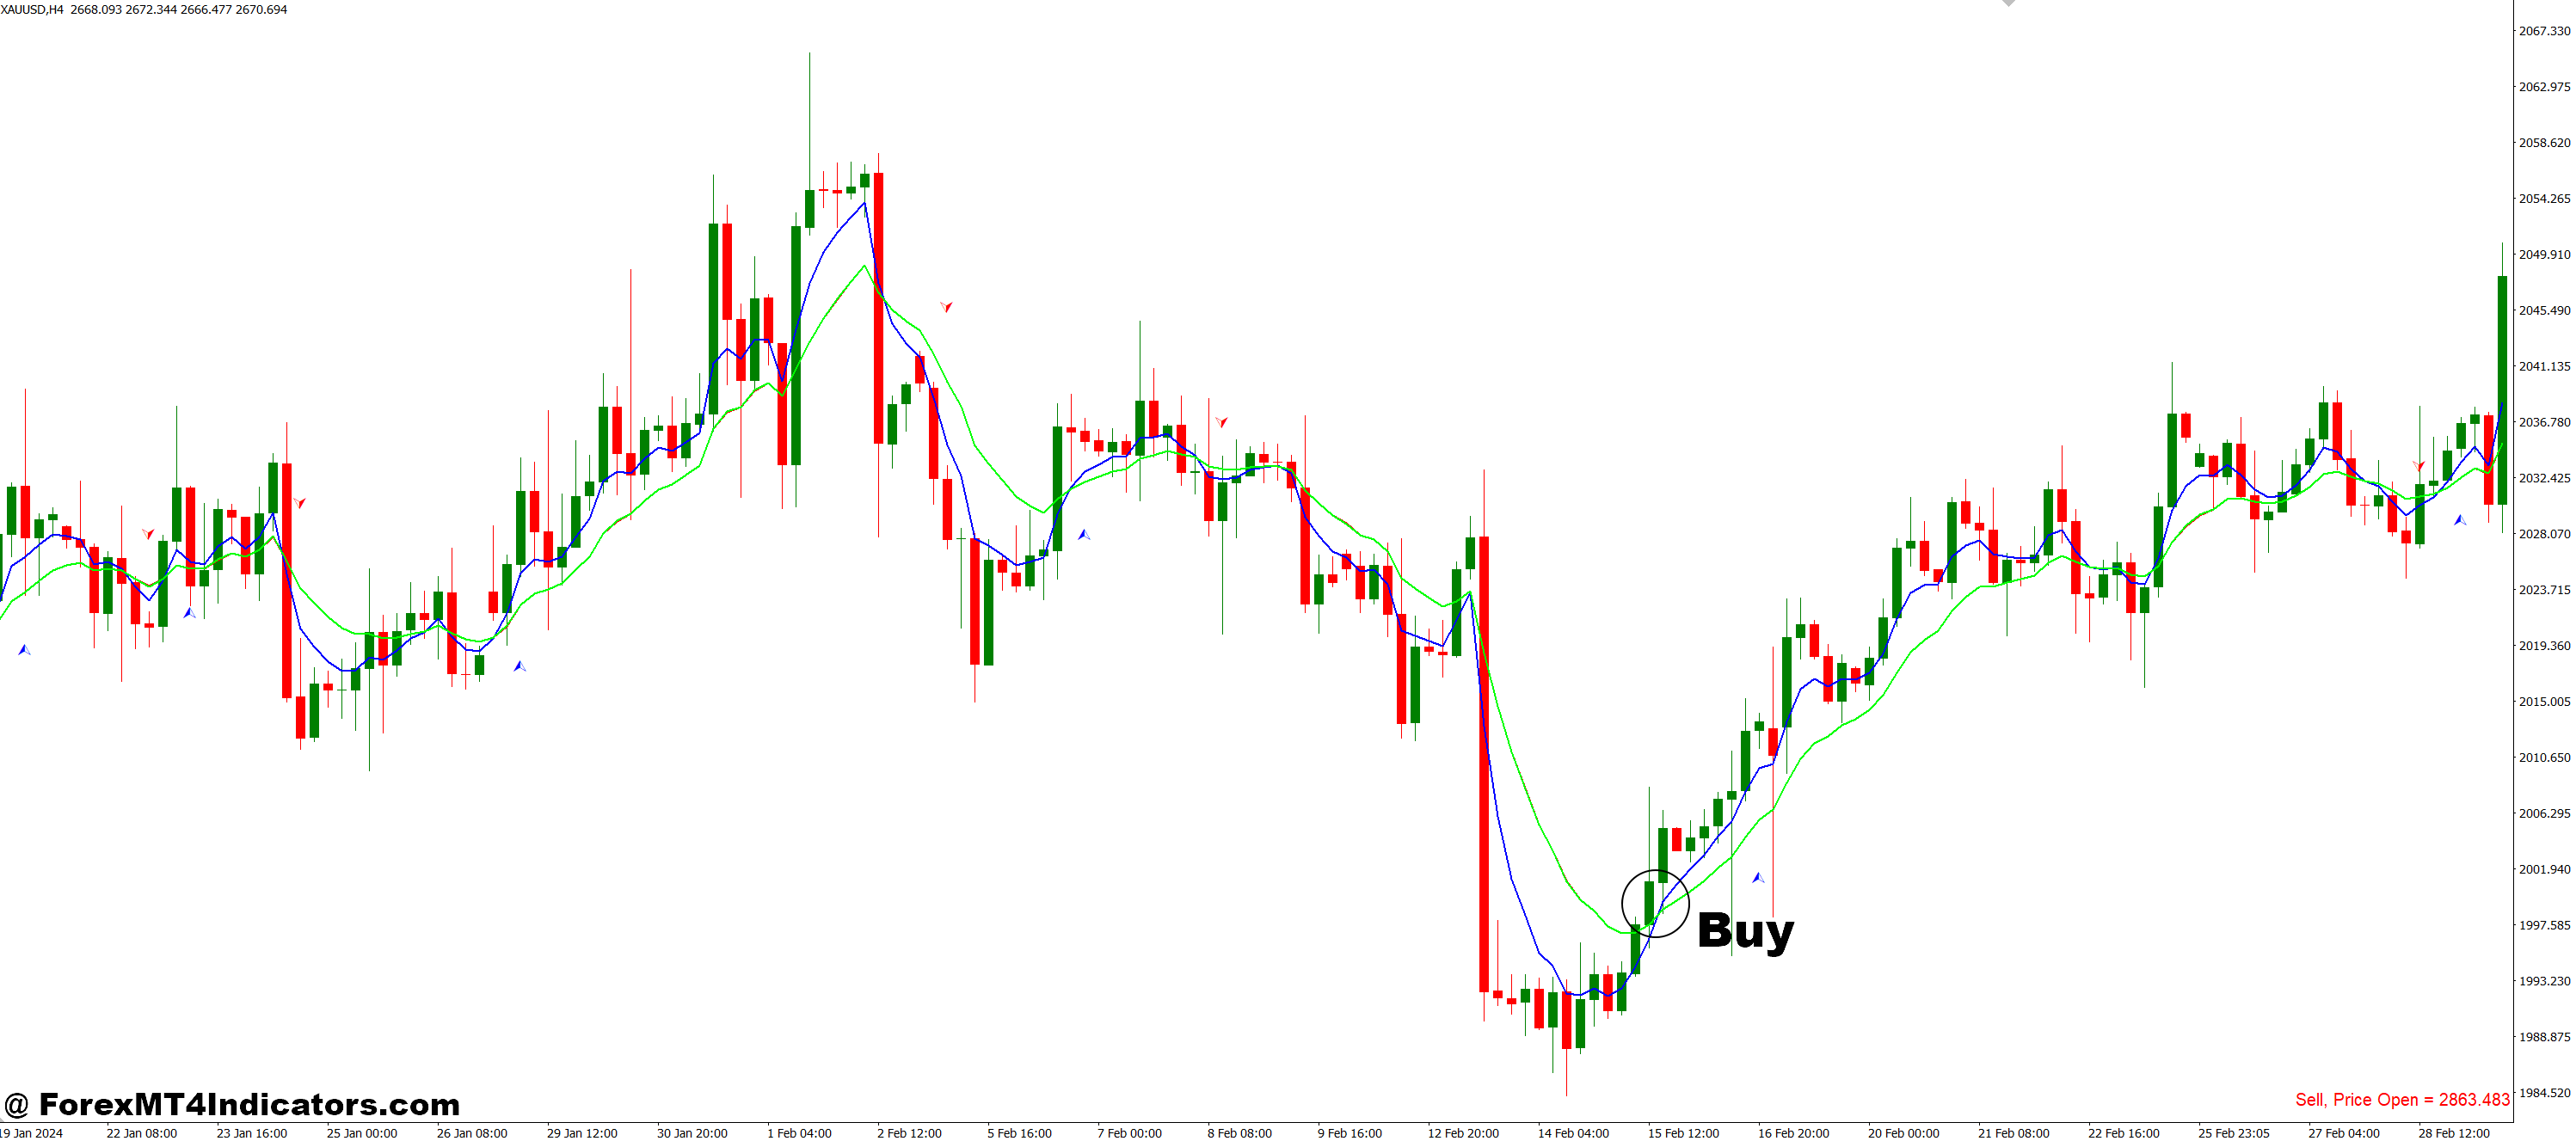
- Wait for the RSI line to cross above the Moving Average line on the indicator.
- Ensure the RSI value is rising from below the 30-50 zone, signaling building bullish momentum.
- Look for a green or upward arrow plotted on the chart (if available).
- Confirm that the price is above the moving average on the main chart (optional filter).
- Enter the buy trade on the candle close after confirmation.
- Set your stop-loss below the recent swing low.
- Take profit at a resistance level or use a trailing stop.
Sell Entry
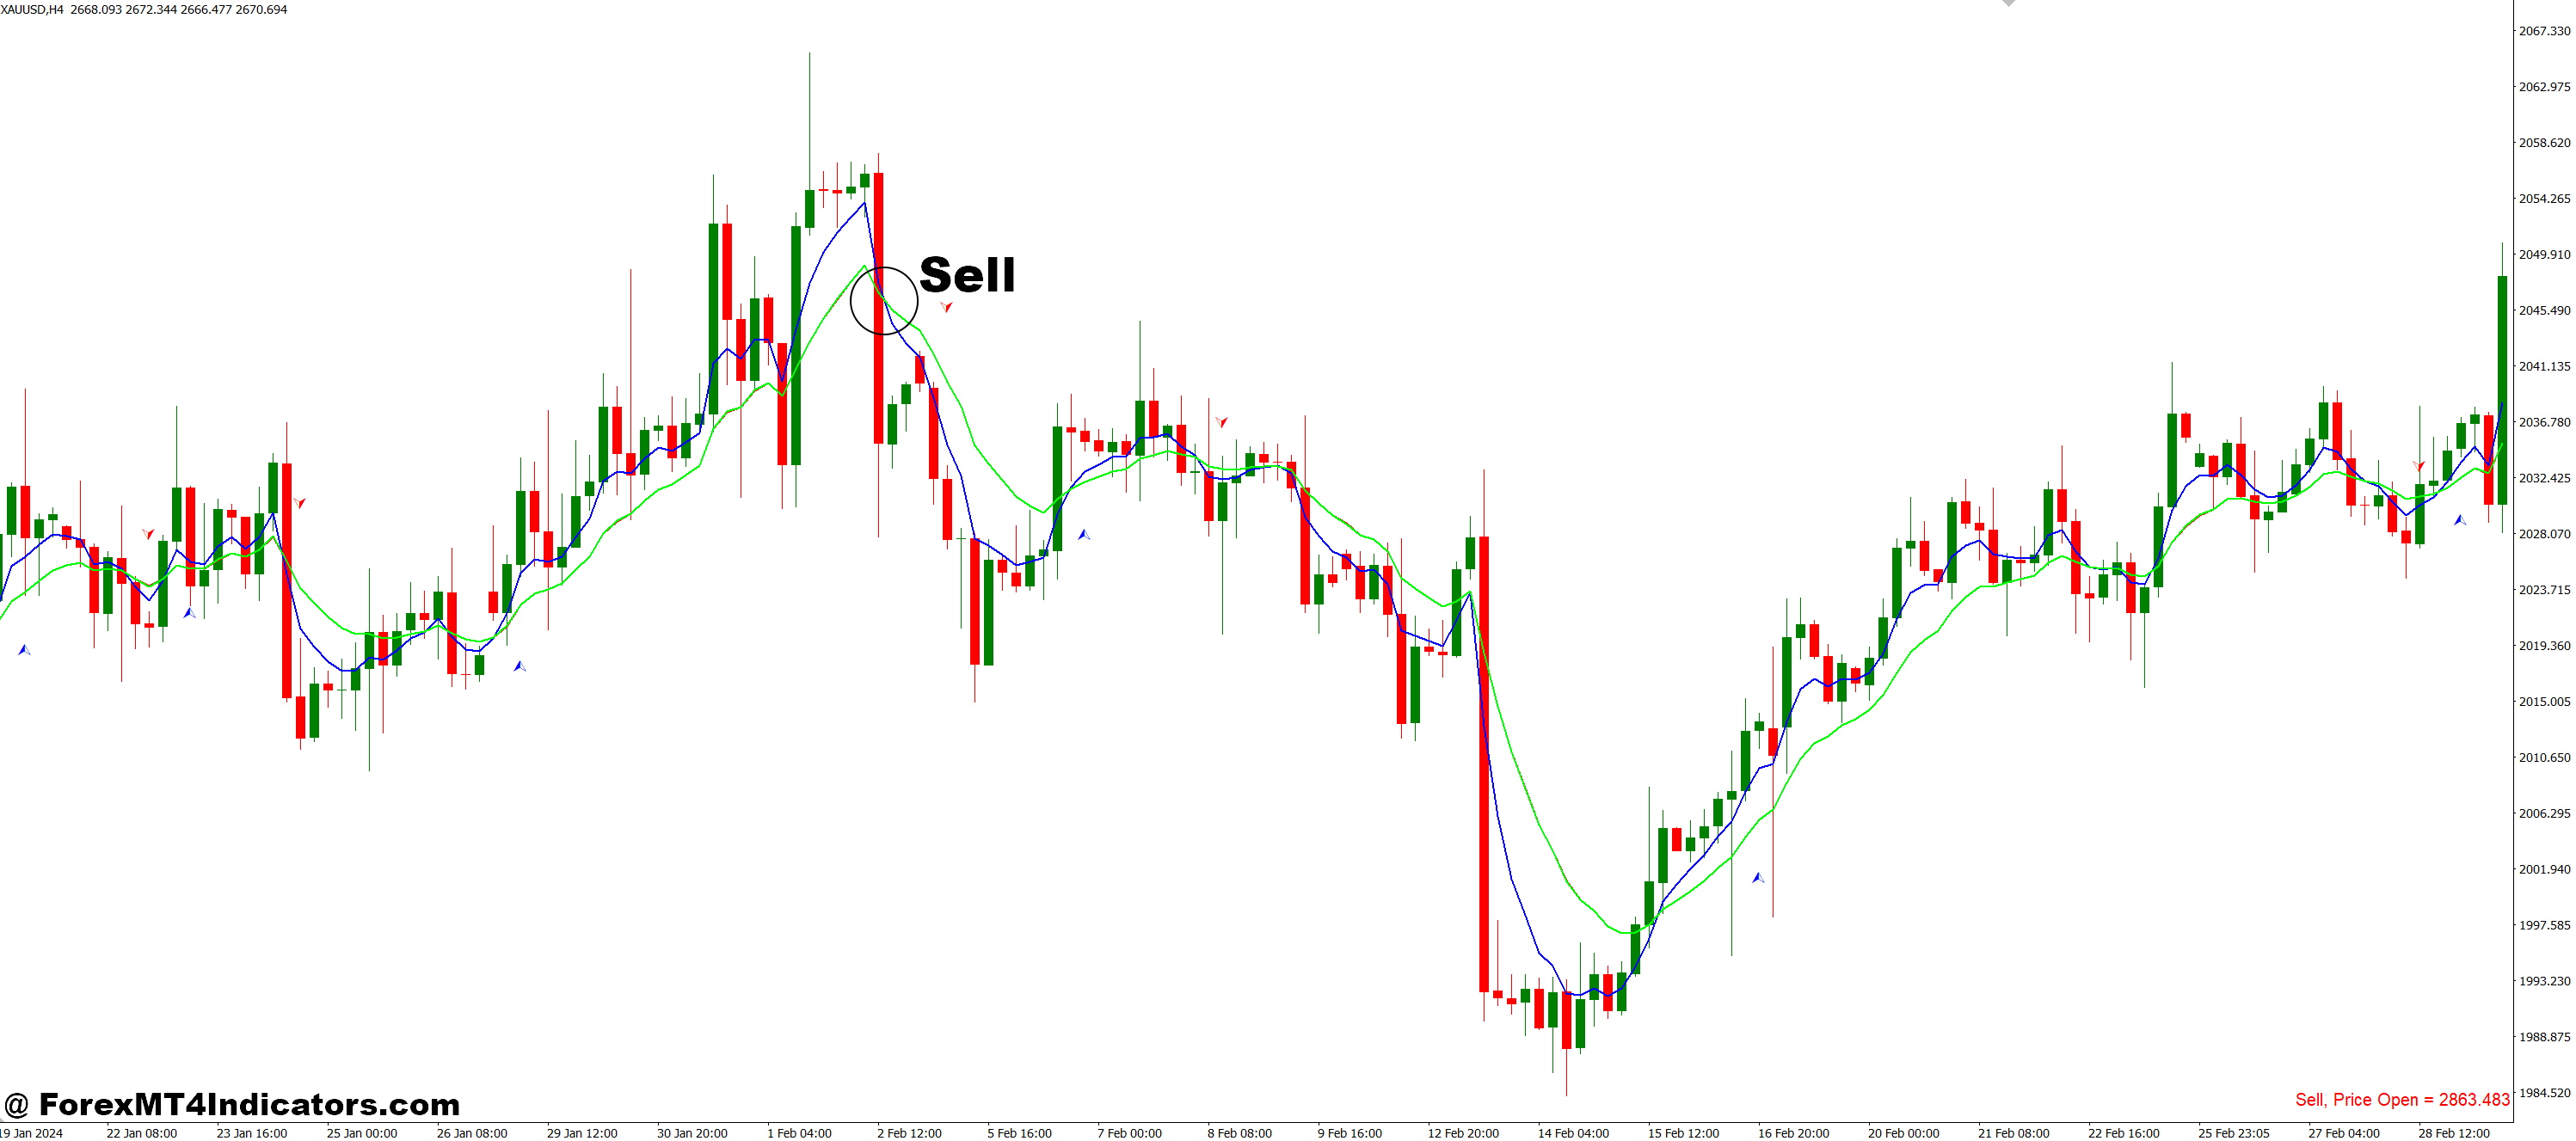
- Wait for the RSI line to cross below the Moving Average line on the indicator.
- Ensure the RSI value is falling from above the 70-50 zone, signaling bearish strength.
- Look for a red or downward arrow on the chart (if included).
- Confirm that the price is below the moving average on the main chart (optional filter).
- Enter the sell trade on the candle close after confirmation.
- Set your stop-loss above the recent swing high.
- Take profit at a support level or use a trailing stop.
- Let me know if you’d like me to format this into a graphic or checklist for your blog!
Conclusion
The RSI MA Trade Sist Chart MT4 Indicator simplifies the trading process by giving clearer, data-backed signals. It takes the strengths of both RSI and MAs and combines them into a tool that helps traders make quicker, smarter decisions. Whether you’re new to trading or already experienced, this indicator can add real value to your strategy. Try it out and see how it improves your chart reading and confidence.
Level up your trading
Learn to read the chart — not just the indicator
eBook · Instant PDF
Video Course · 12 modules
Recommended MT4/MT5 Brokers
- ✓ *FREE *$50 to start (withdrawable)
- ✓ Deposit bonus up to $5,000
- ✓ Negative balance protection
Trading forex and CFDs carries a significant risk of loss and is not suitable for everyone. Broker links are affiliate links — we may earn a commission at no cost to you.
Free MT4 Indicator Download

Enter Your Email Address below, download link will be sent to you.
