

Last updated:
The TTM Squeeze indicator was developed by trader John Carter, and it combines two popular concepts: Bollinger Bands and Keltner Channels. When these two indicators squeeze together, it shows that volatility is dropping and the market is getting tight. Think of it like a rubber band being stretched—the tighter it gets, the harder it snaps back. The indicator displays dots at the bottom of the chart. Red dots mean the squeeze is on, and the market is building pressure. Green dots signal the squeeze has fired, and price is ready to make a move.
How the TTM Squeeze Indicator Works
At its core, the indicator blends two well-known volatility measures:
- Bollinger Bands: Typically calculated using a 20-period moving average with two standard deviations.
- Keltner Channels: Often based on a 20-period exponential moving average and the Average True Range (ATR).
A squeeze forms when the Bollinger Bands contract inside the Keltner Channels. This tells traders volatility is low. When the bands expand back outside the channels, volatility increases, and price often accelerates.
On MT4, many versions also include a momentum histogram. For example, green bars may signal bullish momentum building, while red bars point to bearish pressure. But experienced traders don’t rely on color alone. They watch price structure, recent highs and lows, and session timing.
When testing this on volatile NFP days, traders often notice squeezes forming one to two hours before the release. The breakout doesn’t always respect direction, but the expansion phase is usually sharp.
Reading the Signals
Once traders understand the color-coded dots, they need to look at the histogram bars in the middle of the indicator. These bars tell them which direction the breakout might go. Light blue or green bars going up suggest bullish momentum, while red bars heading down point to bearish pressure. The key is waiting for the squeeze to fire (when dots turn green) and then watching which way the histogram moves. Many traders combine this with price action to confirm their entries. They don’t just jump in blindly—they wait for the right setup.
Why Traders Love This Tool
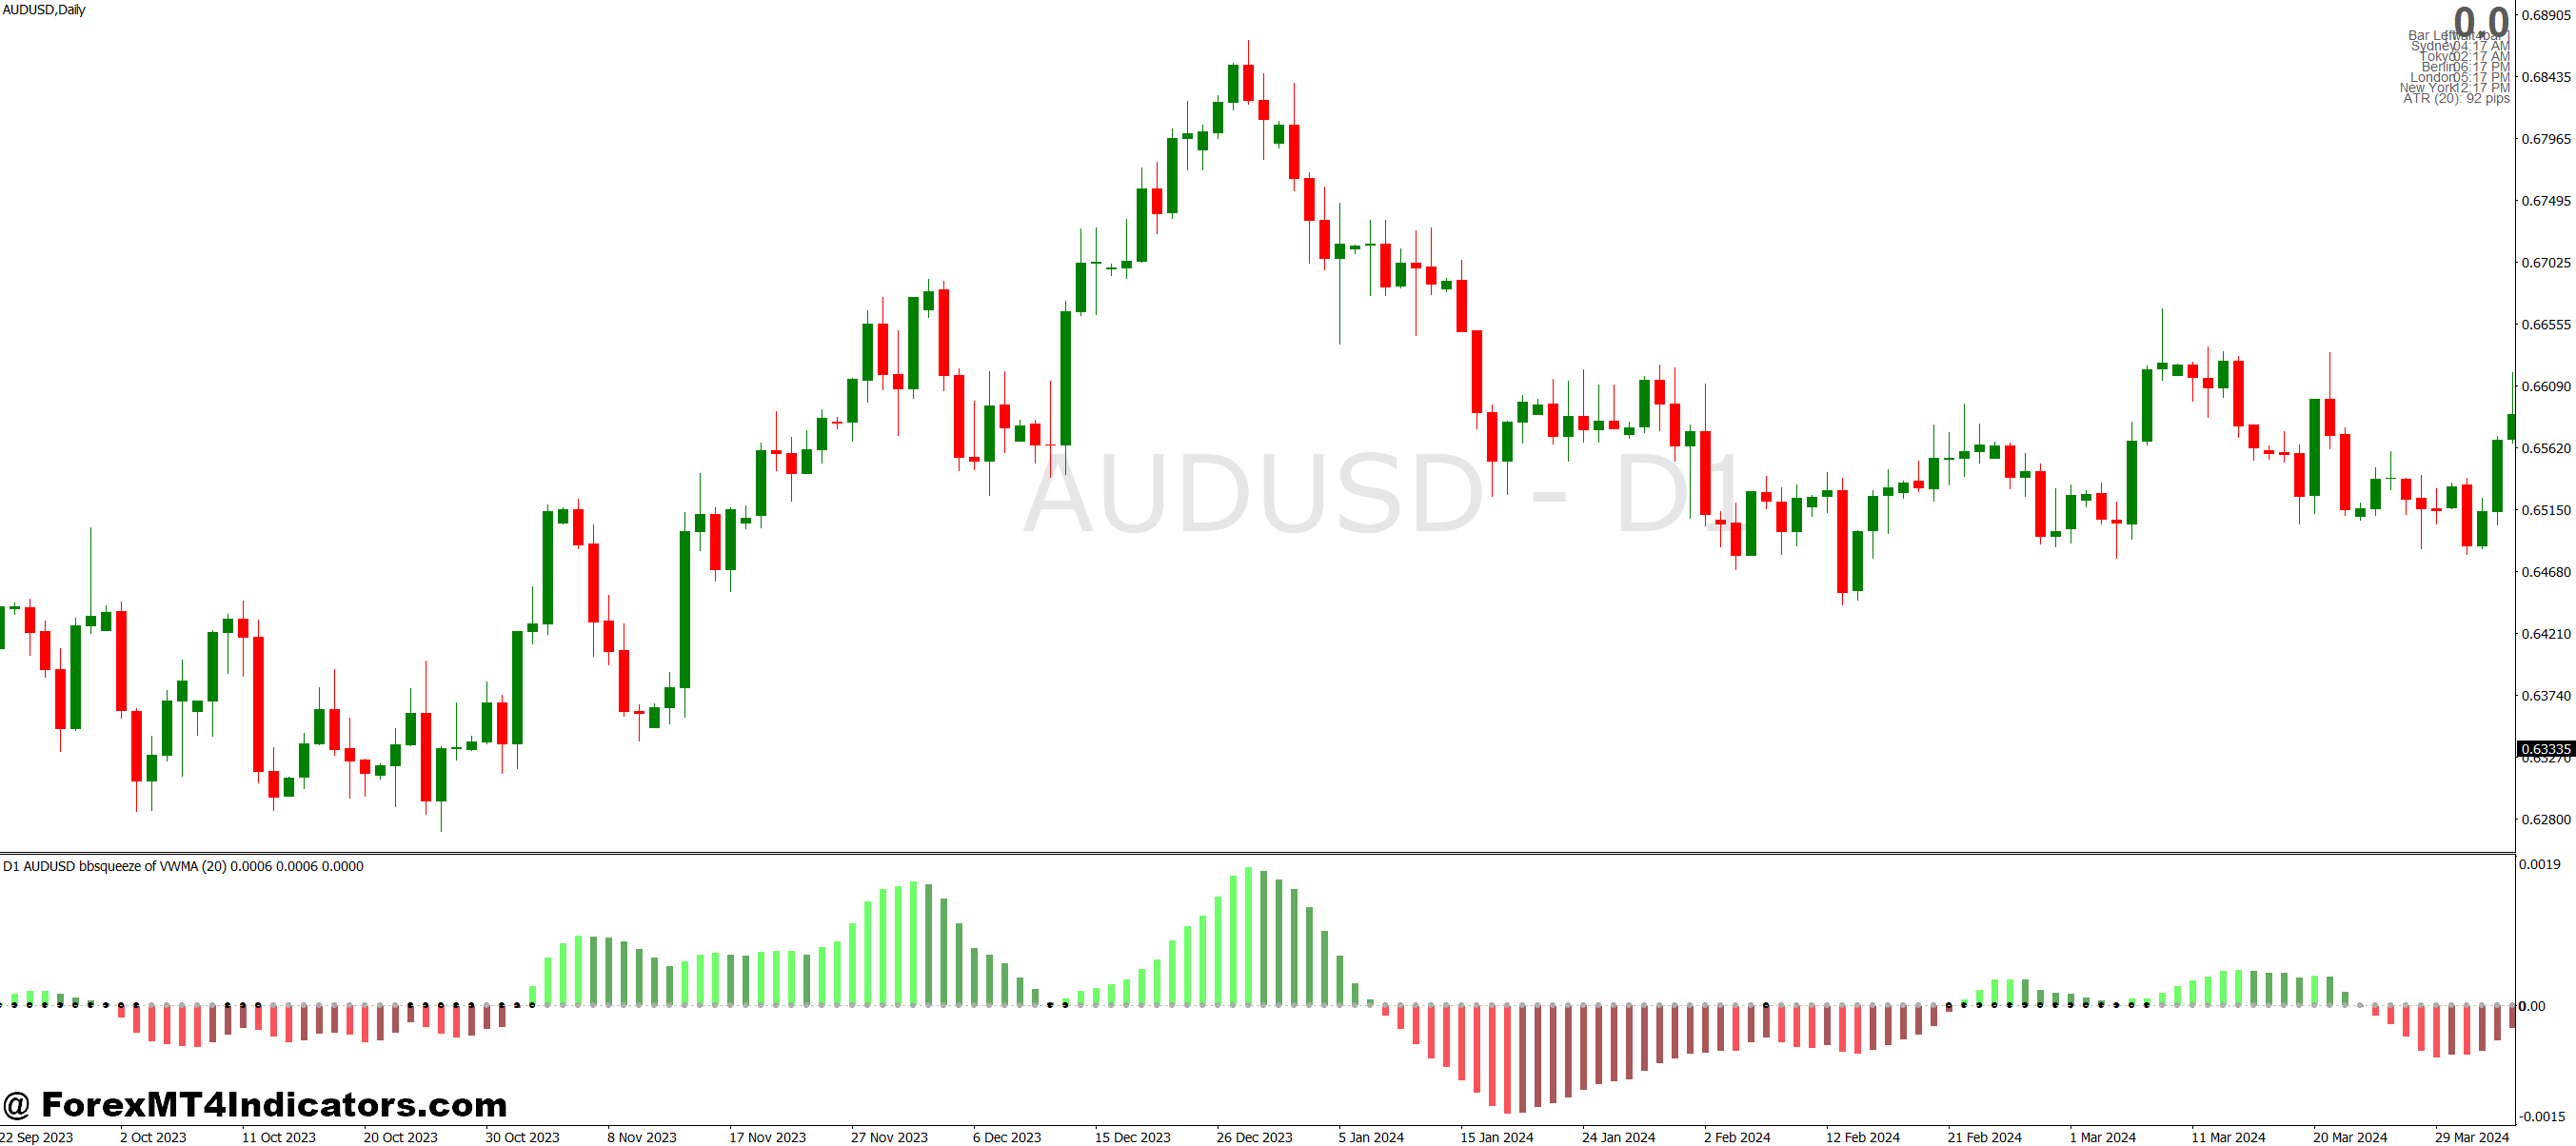
The TTM Squeeze has become popular because it works across different timeframes and markets. Day traders use it on 5-minute charts to catch quick moves. Swing traders apply it to daily charts for bigger trades. It even works on forex pairs, stocks, and commodities. The real advantage is that it keeps traders out of choppy, sideways markets where most people lose money. Instead of grinding through slow periods, they can wait for high-probability setups when the market actually wants to move. This patience often leads to better win rates and less stress.
Settings and Customization MT4
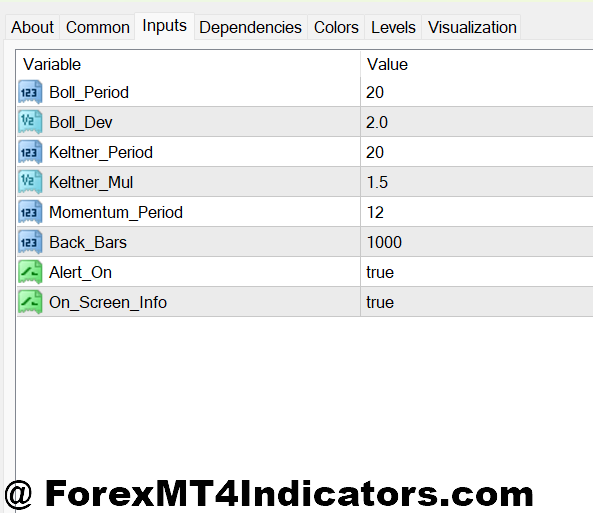
Most MT4 versions of the TTM Squeeze indicator come with adjustable parameters:
- Bollinger Band period: Commonly set to 20
- Standard deviation: Often 2.0
- Keltner Channel multiplier: Usually between 1.5 and 2.0
- Momentum length: Frequently 12 or 14 periods
Short-term traders on the 15-minute chart may tighten settings slightly to catch quicker expansions. Swing traders on the 4-hour chart often leave defaults alone to avoid noise.
One practical tip: test settings during different sessions. A setup that works on EUR/USD London session may feel sluggish on USD/CHF during Asia. Small tweaks can make the indicator fit the pair’s personality.
Advantages, Limitations, and Comparisons
The biggest advantage of the TTM Squeeze indicator MT4 is clarity. It keeps traders out of low-quality trades during tight ranges. It also pairs well with trendlines, moving averages, and support and resistance.
But it has limits. It doesn’t tell direction on its own. In strong trends, squeezes can appear briefly and fail. Traders who enter every release without context often get chopped up.
Compared to indicators like RSI or MACD, the TTM Squeeze focuses on volatility rather than momentum alone. RSI might show overbought conditions while price continues trending. The squeeze, by contrast, warns about timing rather than exhaustion.
Against ATR-based breakout tools, the squeeze is more visual and easier to interpret. Still, ATR gives clearer stop placement guidance. Many seasoned traders combine both.
Trading forex carries substantial risk. No indicator guarantees profits. Losses are part of trading, and risk management matters more than any single tool.
How to Trade with TTM Squeeze MT4 Indicator
Buy Entry
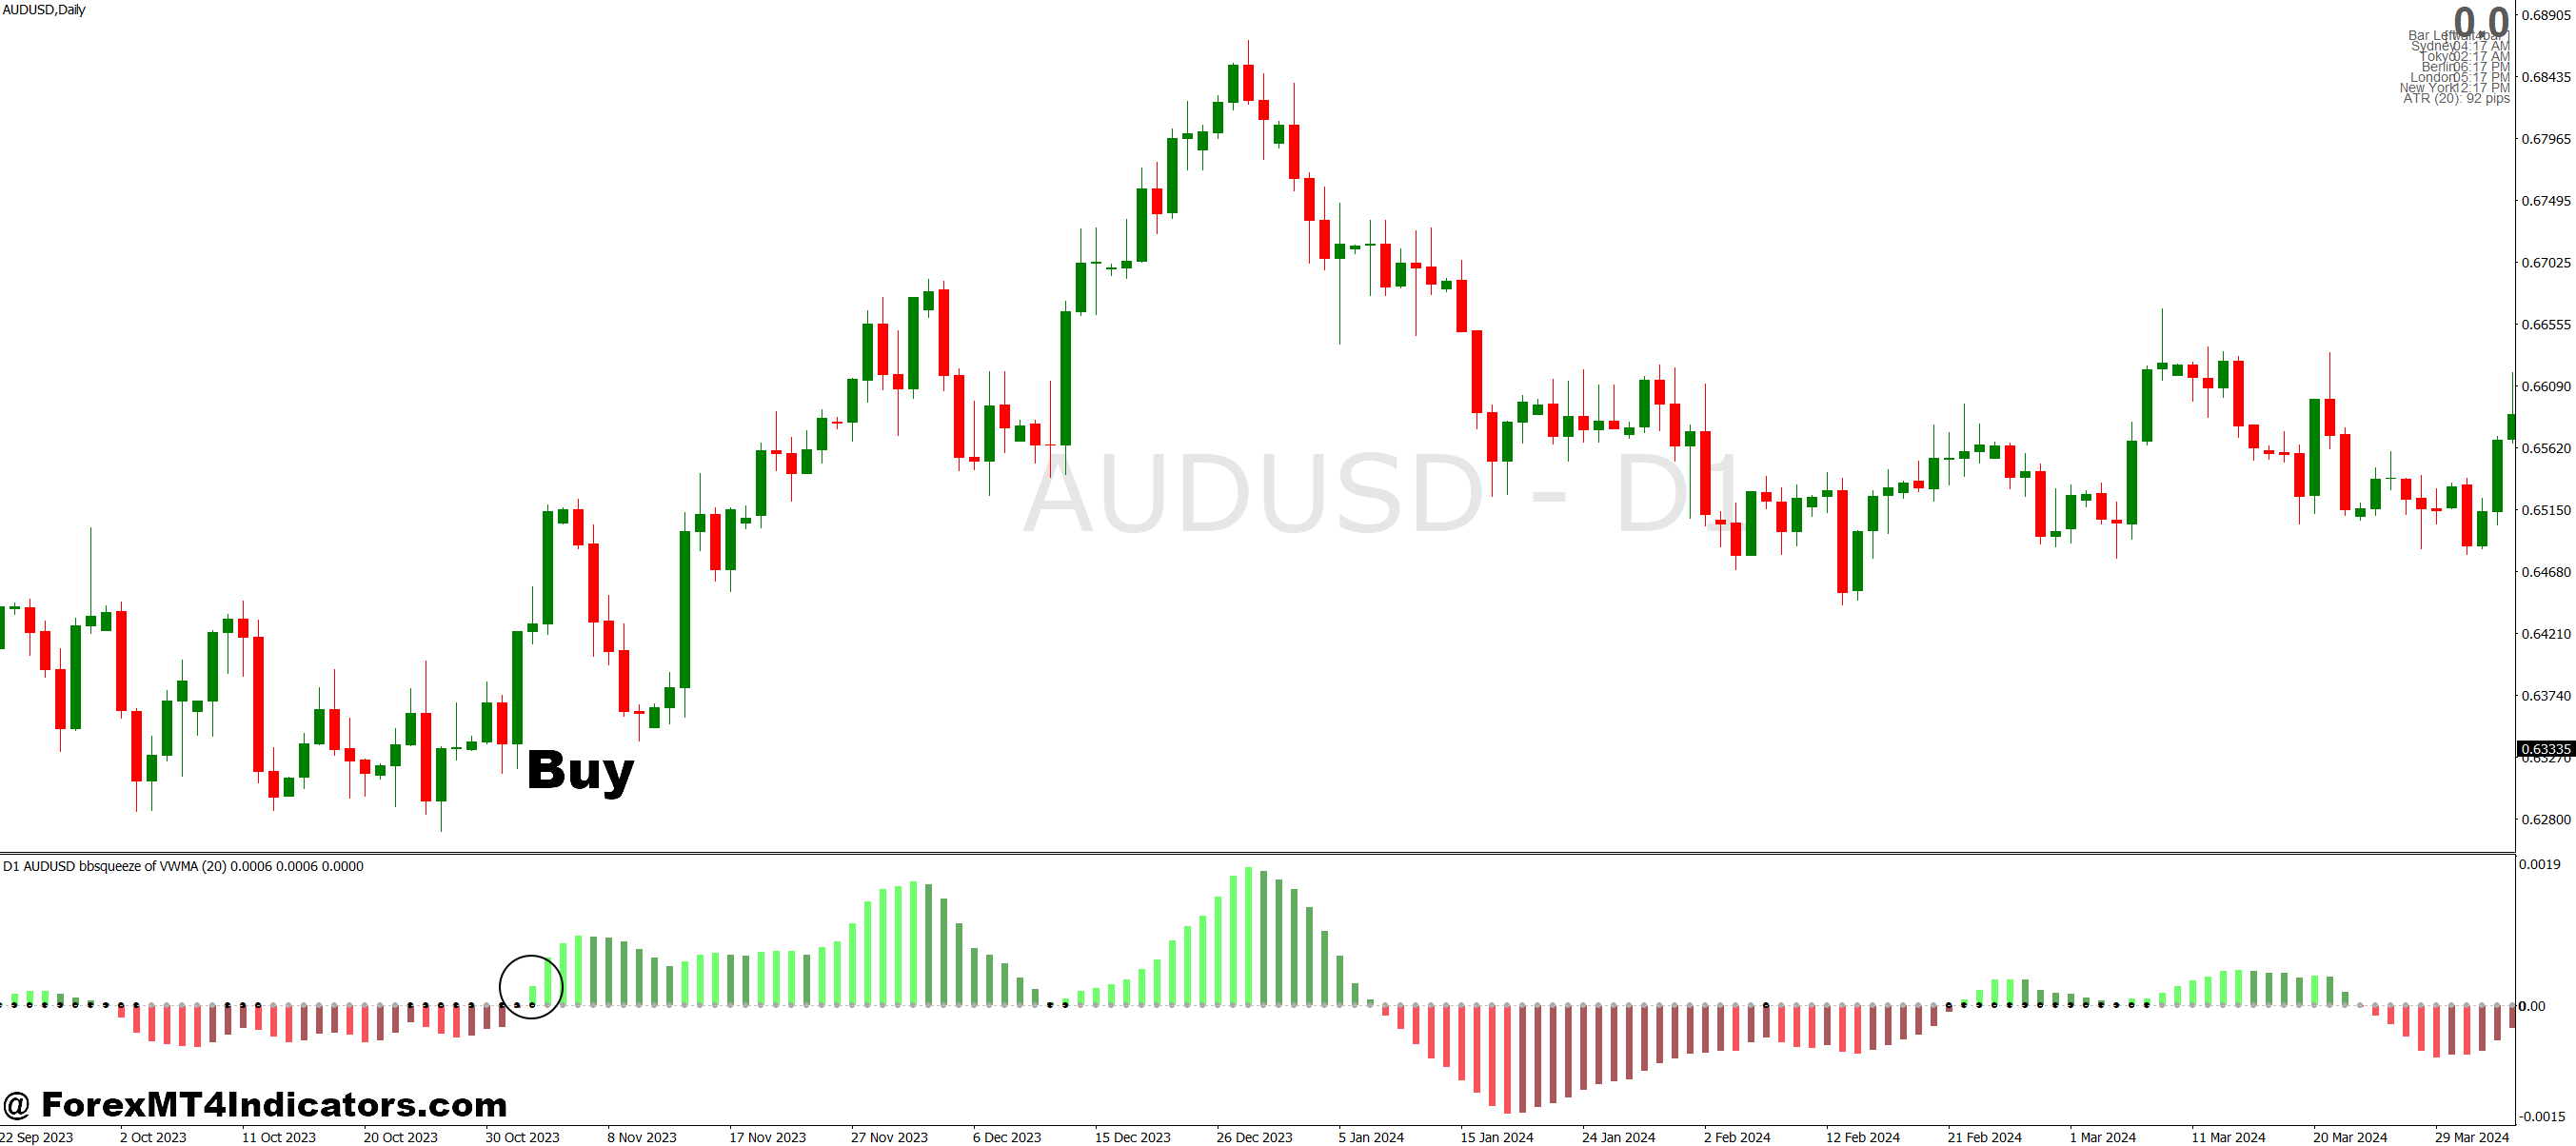
- Wait for the Squeeze – Look for red dots at the bottom of the indicator, showing the market is in a tight squeeze.
- Watch for the Fire – The dots turn from red to green, signaling the squeeze has released.
- Check the Histogram – Make sure the histogram bars are turning light blue or green and pointing upward.
- Confirm the Direction – Price should be breaking above a recent resistance level or moving higher.
- Enter the Trade – Place a buy order once all signals align, and momentum is clearly bullish.
- Set Stop Loss – Put your stop loss below the recent swing low or below the squeeze area.
- Target Profit – Aim for previous resistance levels or let the trade run while the histogram stays positive.
Sell Entry
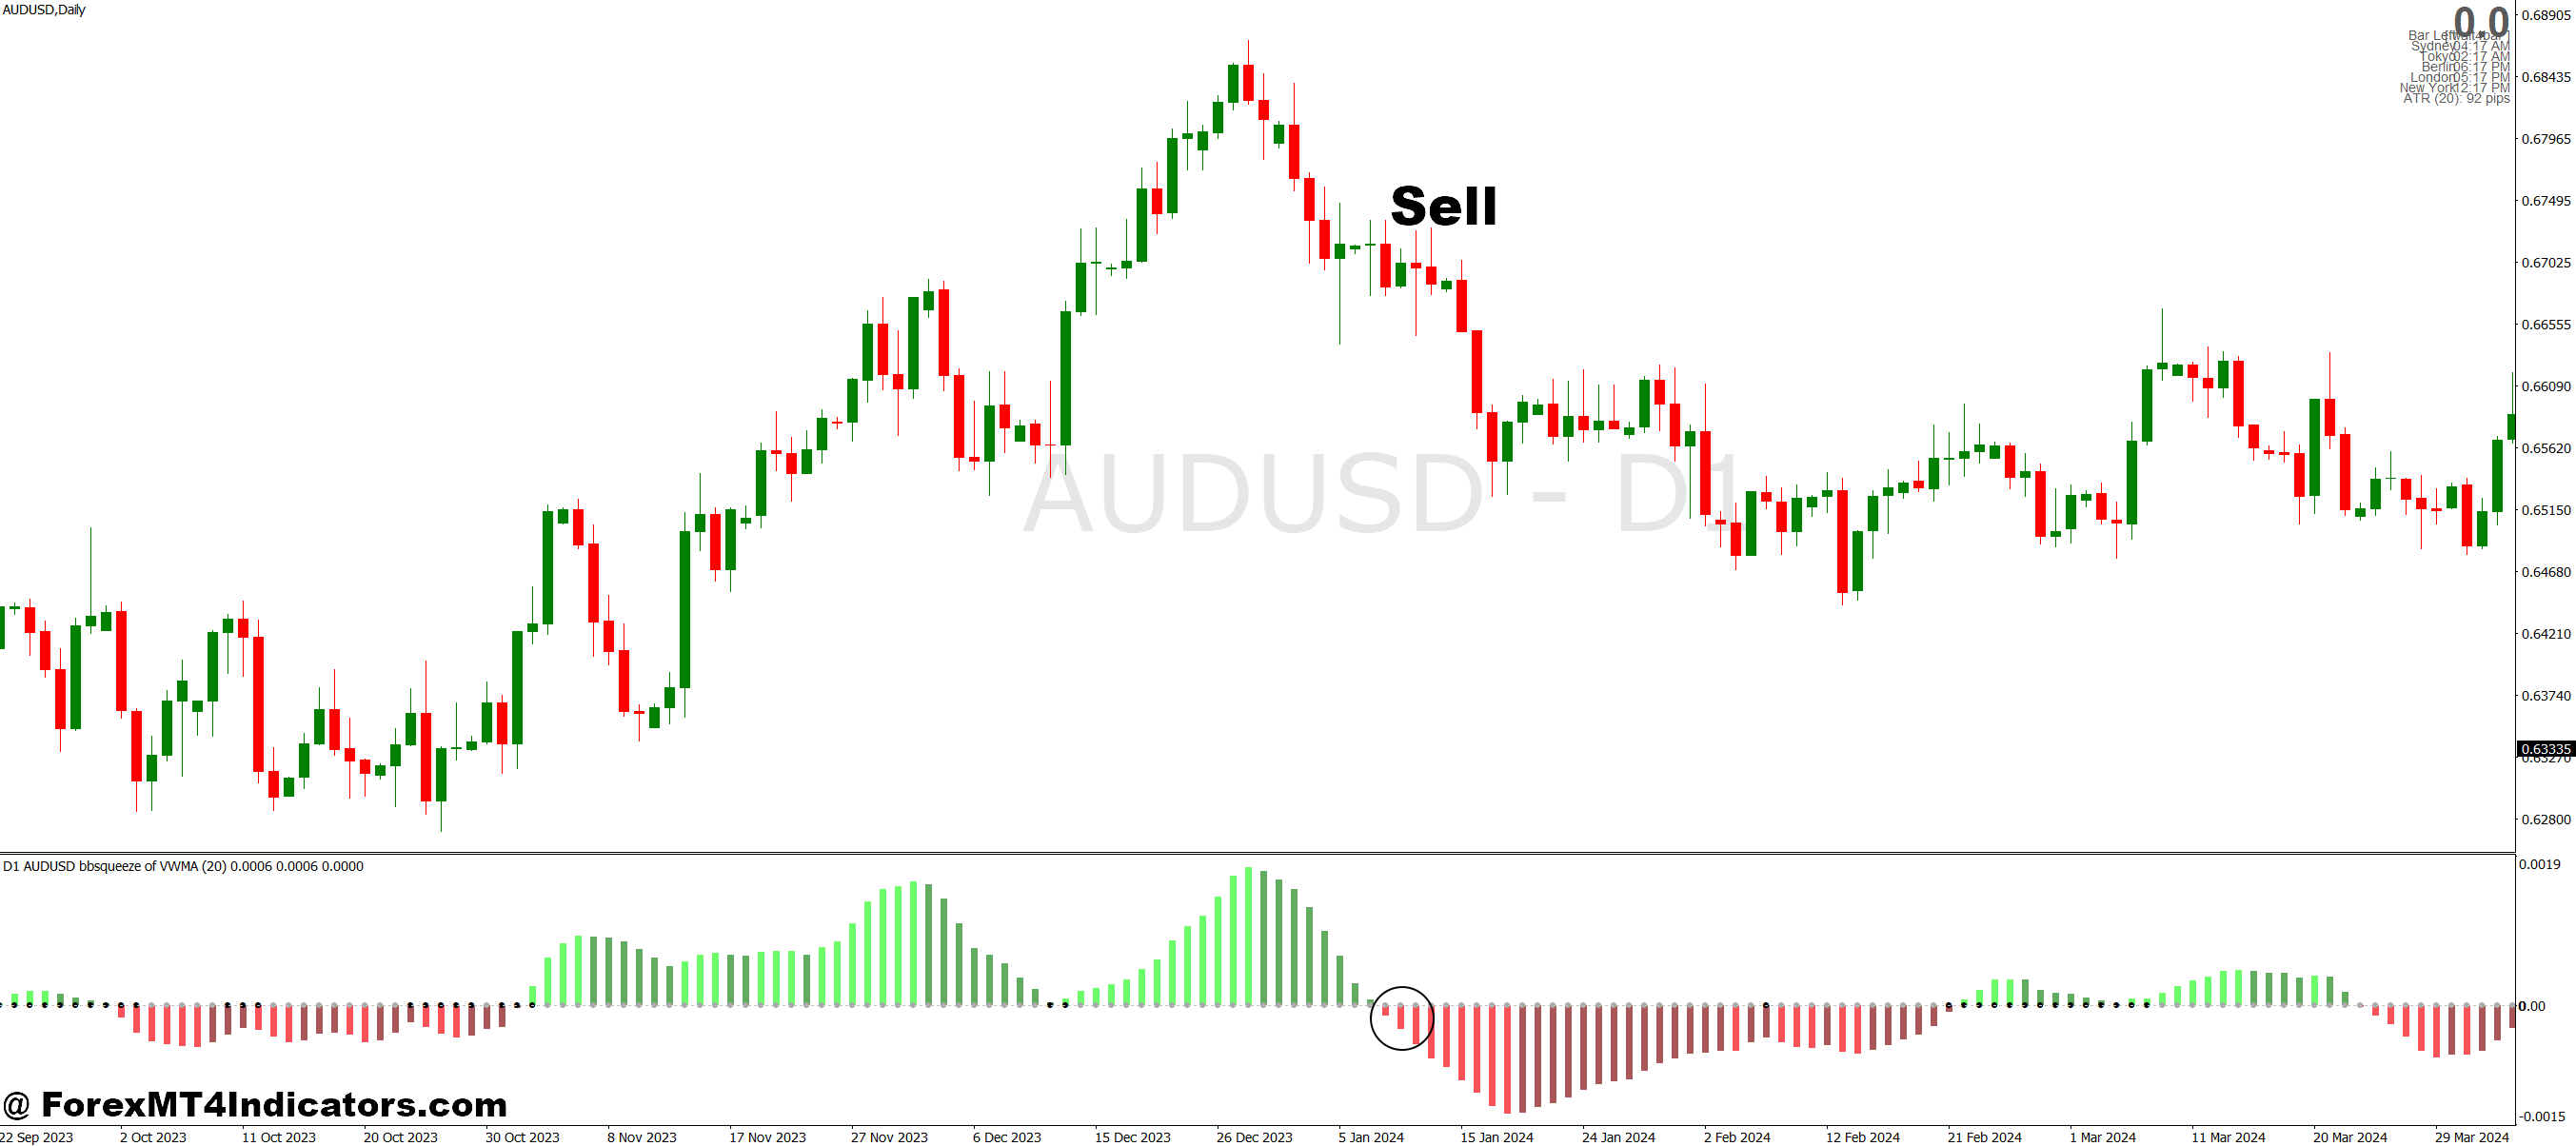
- Wait for the Squeeze – Identify red dots showing the market is compressed and building pressure.
- Watch for the Fire – Dots change from red to green, indicating the squeeze is releasing.
- Check the Histogram – Ensure the histogram bars are turning red or dark and pointing downward.
- Confirm the Direction – Price should be breaking below a recent support level or trending lower.
- Enter the Trade – Place a sell order when all bearish signals come together.
- Set Stop Loss – Position your stop loss above the recent swing high or above the squeeze zone.
- Target Profit – Aim for previous support levels or ride the move while the histogram remains negative.
Conclusion
The TTM Squeeze MT4 Indicator gives traders a clear edge by showing them when markets are coiling up and ready to explode. Instead of guessing when to trade, they get visual signals that highlight the best opportunities. The combination of squeeze dots and momentum bars creates a simple system that even newer traders can understand and use. While no indicator is perfect, the TTM Squeeze helps filter out bad trades and focuses attention on moments when the market has real potential to move. For anyone tired of choppy markets and bad timing, this tool offers a practical solution worth exploring.
Level up your trading
Learn to read the chart — not just the indicator
eBook · Instant PDF
Video Course · 12 modules
Recommended MT4/MT5 Brokers
- ✓ *FREE *$50 to start (withdrawable)
- ✓ Deposit bonus up to $5,000
- ✓ Negative balance protection
Trading forex and CFDs carries a significant risk of loss and is not suitable for everyone. Broker links are affiliate links — we may earn a commission at no cost to you.
Free MT4 Indicator Download

Enter Your Email Address below, download link will be sent to you.
Trading on MetaTrader 5? Get the TTM Squeeze indicator for MT5 instead — same squeeze logic, built for the MT5 platform. It also pairs naturally with the Keltner Channel indicator, since the squeeze itself is measured against Keltner bands.