


Last updated:
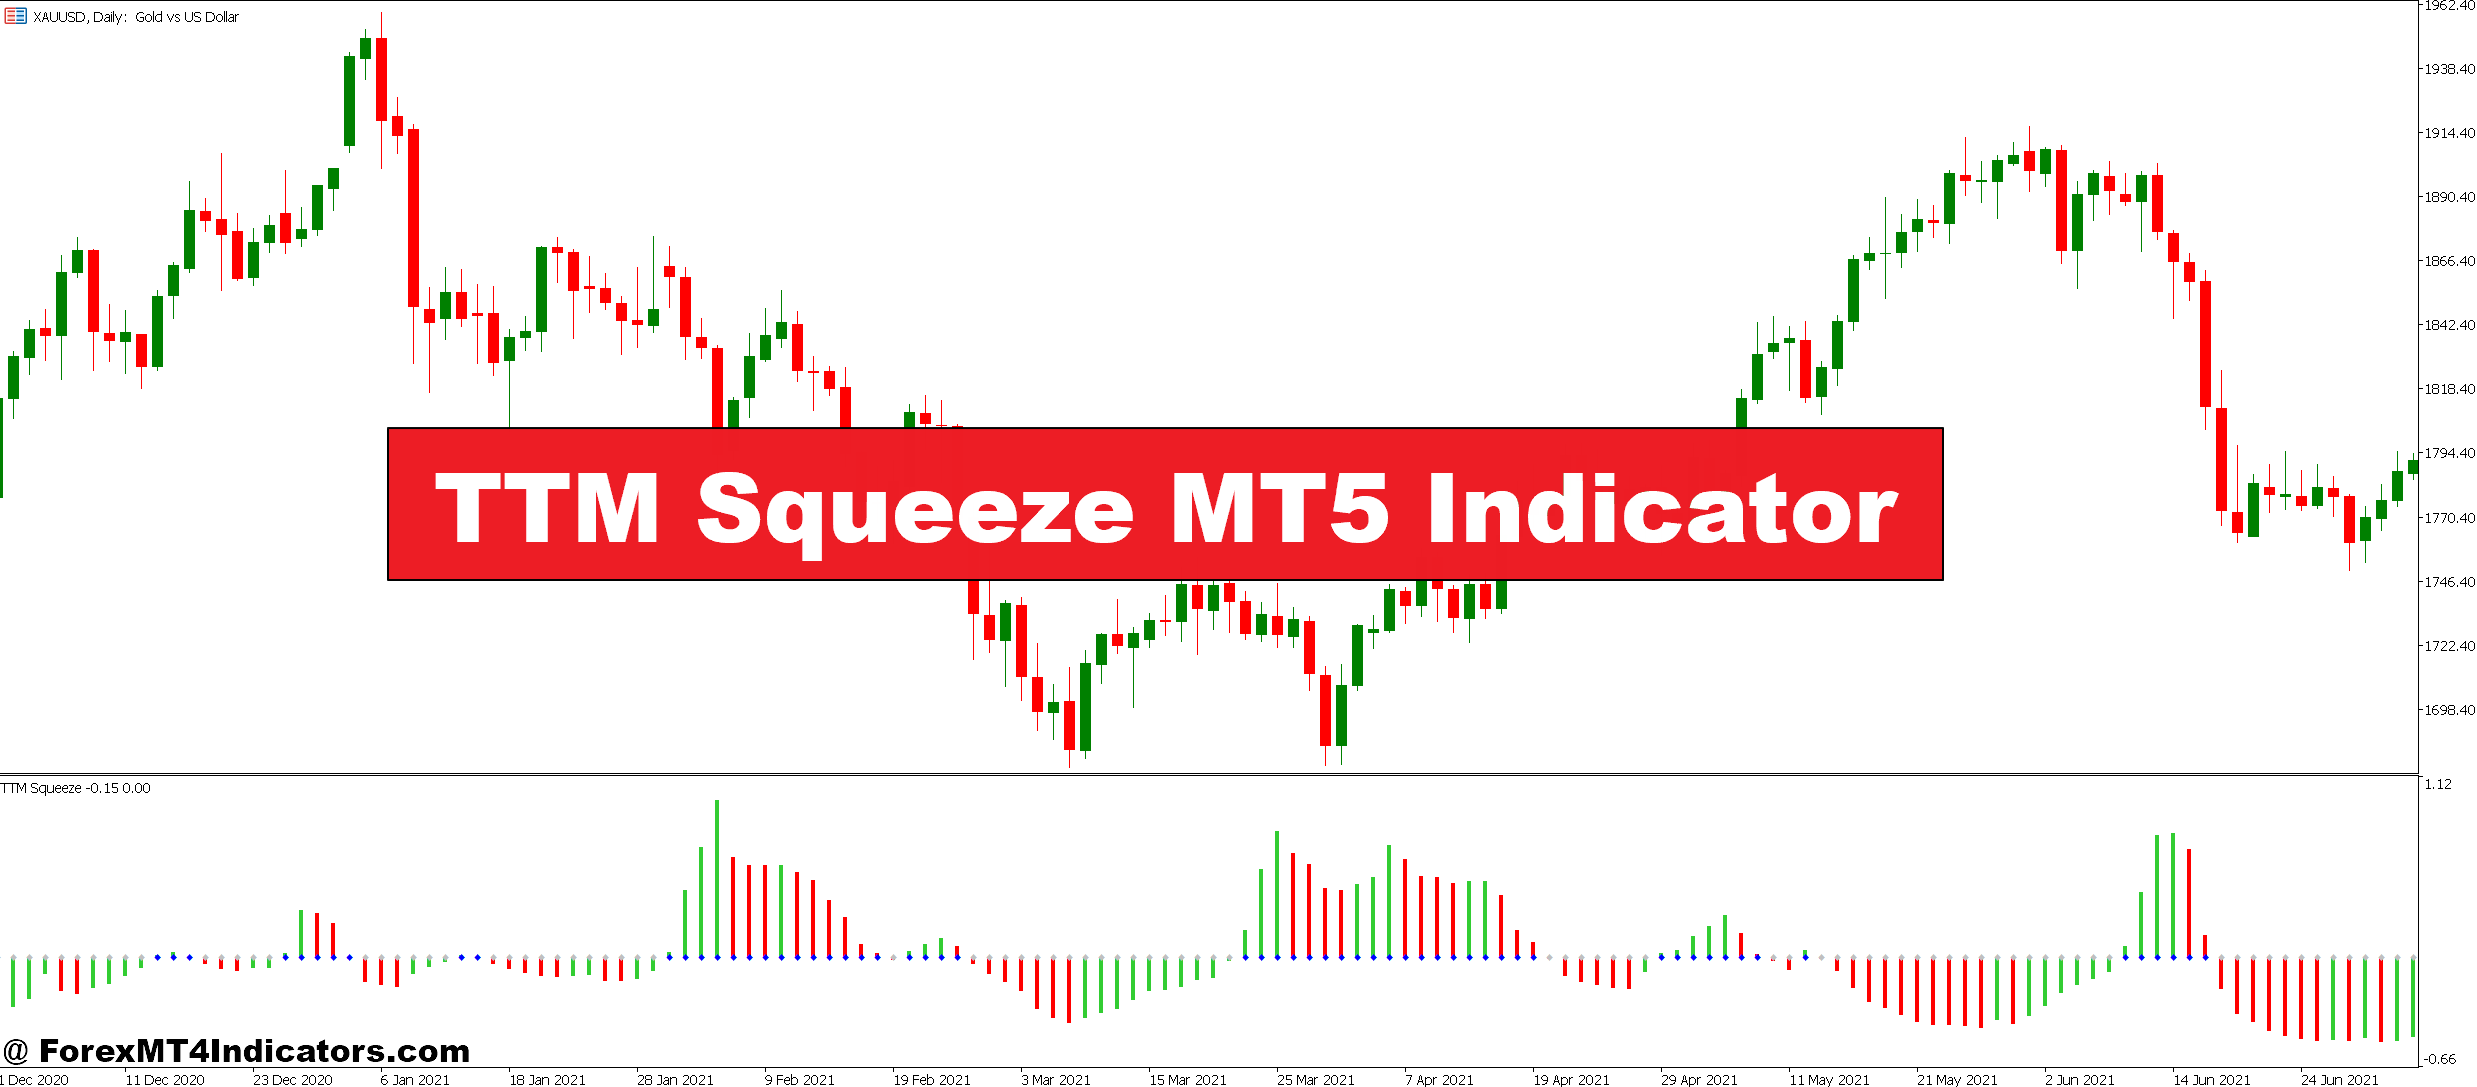
The TTM Squeeze MT5 Indicator works like a pressure gauge for the market. Created by trader John Carter, it watches for periods when price action gets squeezed into a tight range. Think of it like a coiled spring—the tighter it gets, the bigger the release. The indicator combines Bollinger Bands and Keltner Channels to identify these squeeze periods. When the Bollinger Bands move inside the Keltner Channels, a squeeze is happening. Dots on the chart change color to show traders what’s going on. Red dots mean the market is in squeeze mode, while green dots signal the squeeze has fired and movement is starting.
Reading the Signals
The histogram bars that show up with this indicator tell traders which direction momentum is heading. When the bars turn from red to green and start climbing, buyers are taking control. When they flip from green to red and drop, sellers are stepping in. The height of these bars matters too—taller bars mean stronger momentum. Traders watch for the squeeze to fire after a period of consolidation, then use the histogram to confirm which way to trade. It’s not about guessing anymore. The indicator gives clear visual clues about what’s building under the surface.
Using It in Real Trading
Smart traders don’t use the TTM Squeeze alone. They pair it with support and resistance levels, trend lines, or other indicators to confirm their trades. For example, if the squeeze fires with green momentum bars right at a major support level, that’s a strong buy signal. The same logic works in reverse at resistance levels. Day traders and swing traders both find value in this tool because it works on multiple timeframes. Whether someone trades the 5-minute chart or the daily chart, the TTM Squeeze adapts and keeps showing where pressure is building in the market.
Staying Patient Pays Off
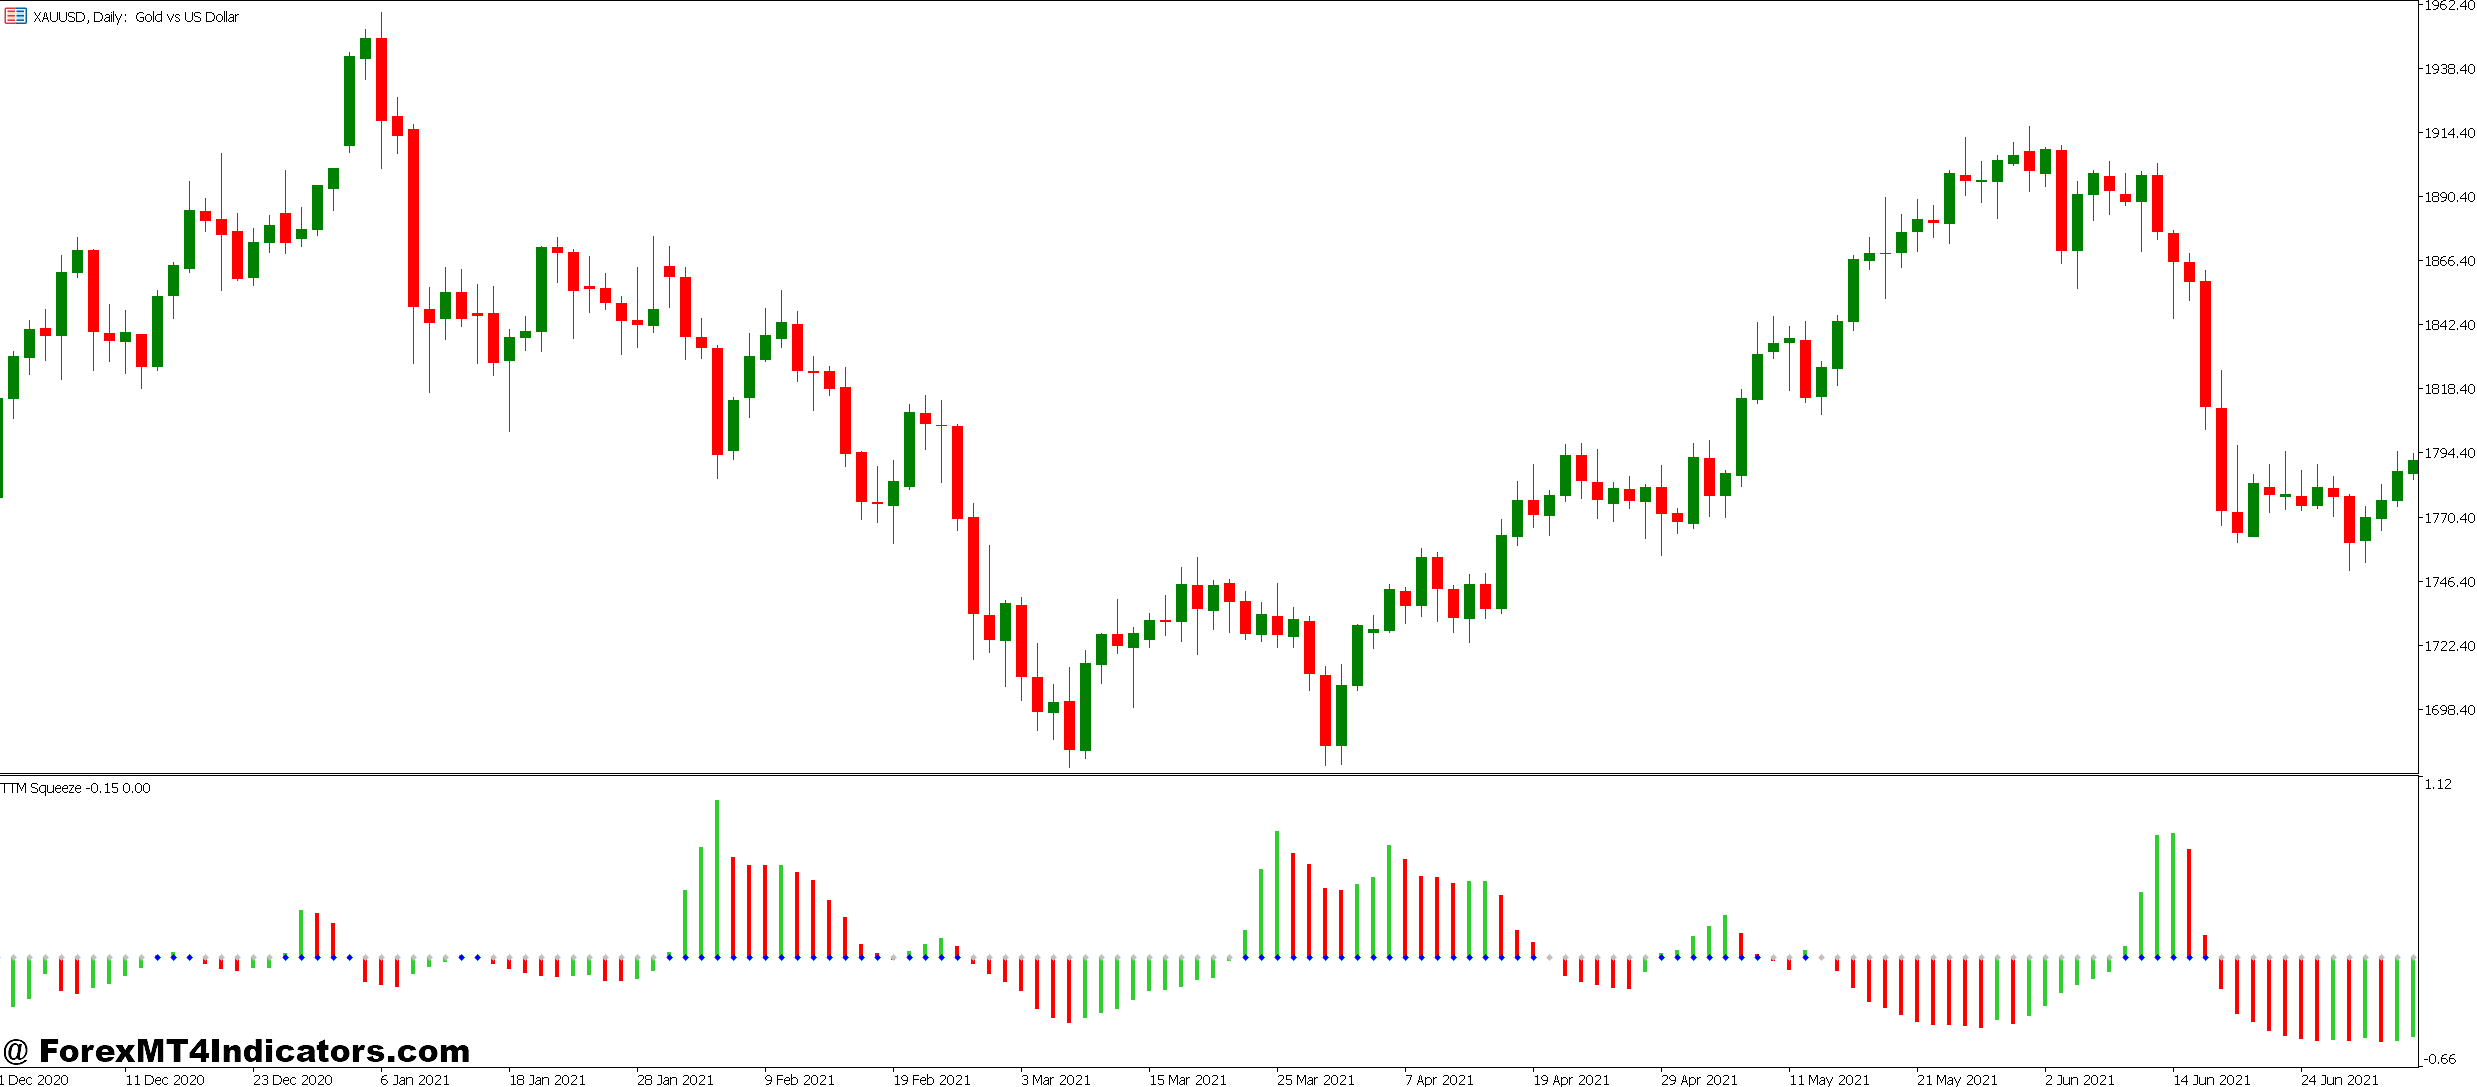
The real power of the TTM Squeeze comes from patience. Not every squeeze leads to a massive breakout, and some false signals happen. That’s just part of trading. But when traders wait for confirmed squeezes and combine them with good risk management, the odds shift in their favor. The indicator filters out a lot of the noise that makes trading stressful. Instead of jumping at every price wiggle, traders can focus on setups that actually have explosive potential.
Settings & Customization
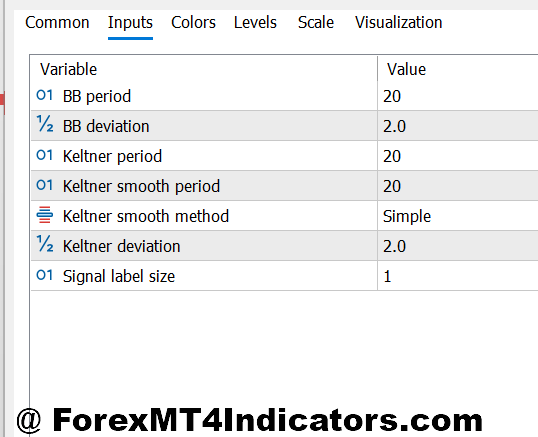
The TTM Squeeze MT5 is highly customizable, allowing traders to tailor it to different pairs and timeframes. Key parameters include:
- Bollinger Band Length: Default 20, but shorter periods (10–15) capture faster moves; longer (30–50) smooths noise for higher timeframes.
- Keltner Channel ATR: Typically 20-period, adjustable for volatility preference.
- Momentum Oscillator: Adjust histogram sensitivity by changing the moving average applied (5–10 periods common).
For EUR/USD on a 1-hour chart, keeping defaults usually works well. On volatile pairs like GBP/JPY, widening the Bollinger Band multiplier slightly reduces false signals. Experienced traders often overlay it with trendlines or pivot points for more precise entries.
Customizing alerts can also help. Many MT5 versions allow push notifications when a squeeze ends, so traders can act promptly without staring at charts all day.
Advantages vs Limitations
Advantages
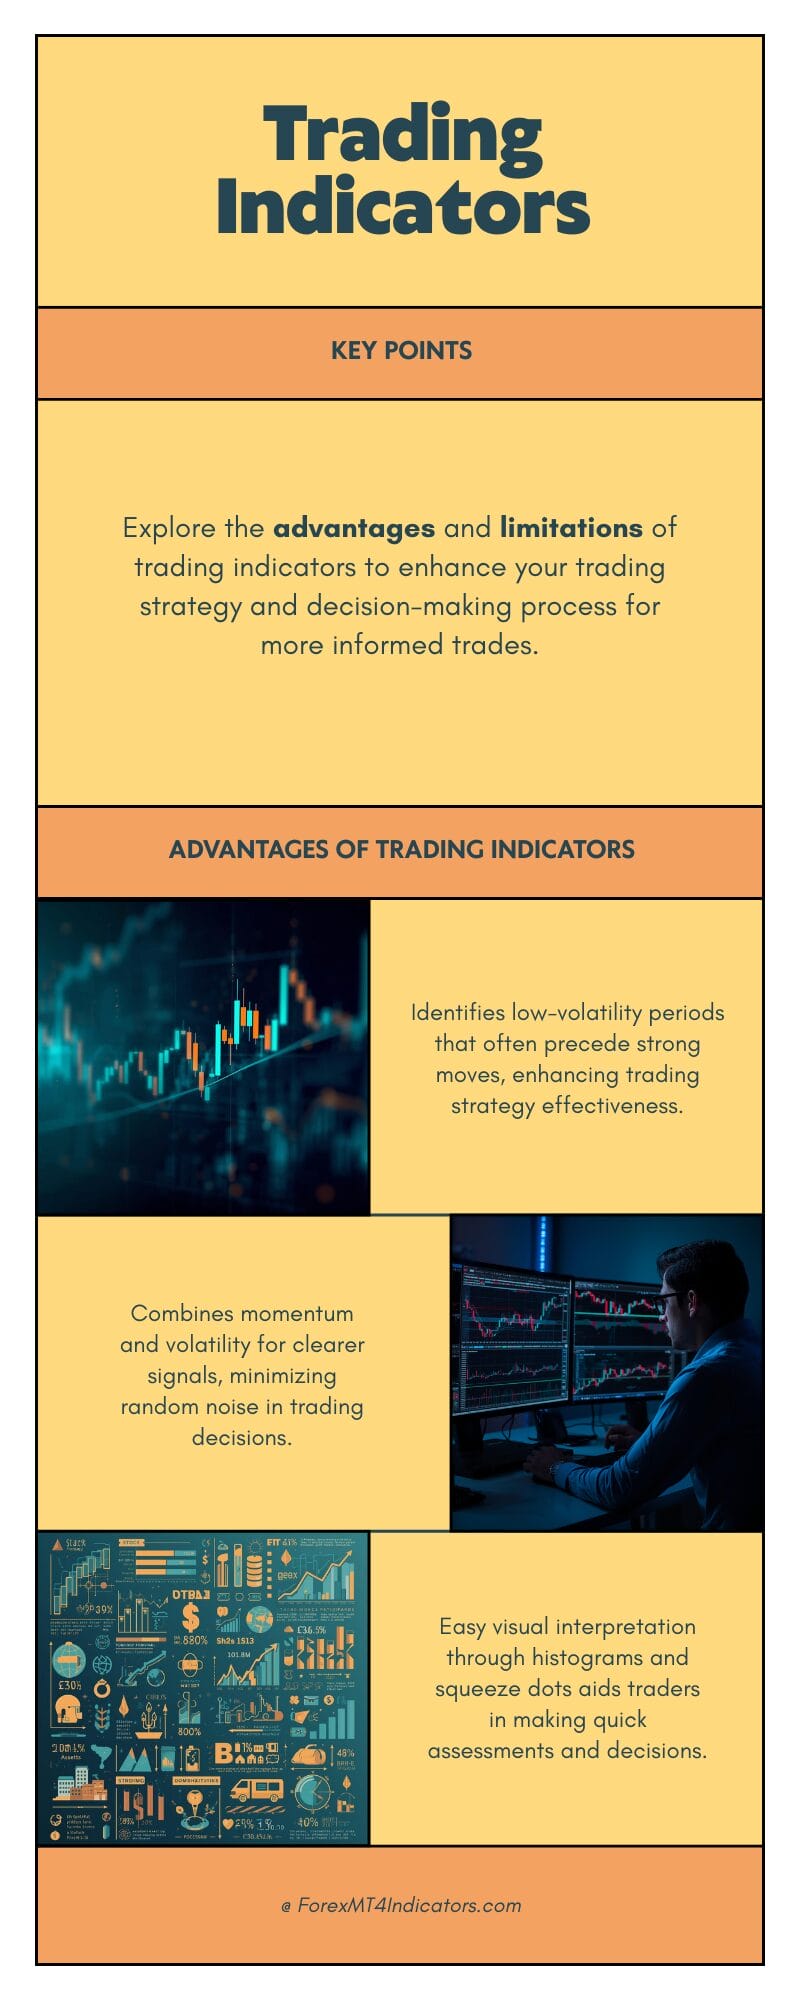
- Identifies low-volatility periods that often precede strong moves.
- Combines momentum and volatility, reducing random signals.
- Versatile across timeframes and asset classes.
- Easy visual interpretation via histogram and squeeze dots.
Limitations
- Does not predict direction alone; requires confirmation from price action.
- Can produce false signals during news spikes or extremely choppy markets.
- Less effective in highly trending markets without consolidations.
Compared with other indicators like RSI or MACD, the TTM Squeeze offers a unique focus on volatility contraction rather than purely momentum, making it particularly useful for breakout-focused strategies.
Comparison with Similar Indicators
Unlike standard Bollinger Bands or ATR-based breakout tools, the TTM Squeeze integrates both volatility and momentum. For instance:
- Bollinger Bands alone show only contraction and expansion but don’t indicate direction.
- ATR Breakout Strategies signal volatility but lack momentum confirmation.
- RSI Divergence detects overbought/oversold conditions but often misses the timing of consolidation breakouts.
By combining these concepts, the TTM Squeeze provides a clearer setup without requiring multiple separate indicators cluttering the chart. Traders benefit from a single visual tool that highlights both opportunity and potential momentum.
How to Trade with TTM Squeeze MT5 Indicator
Buy Entry
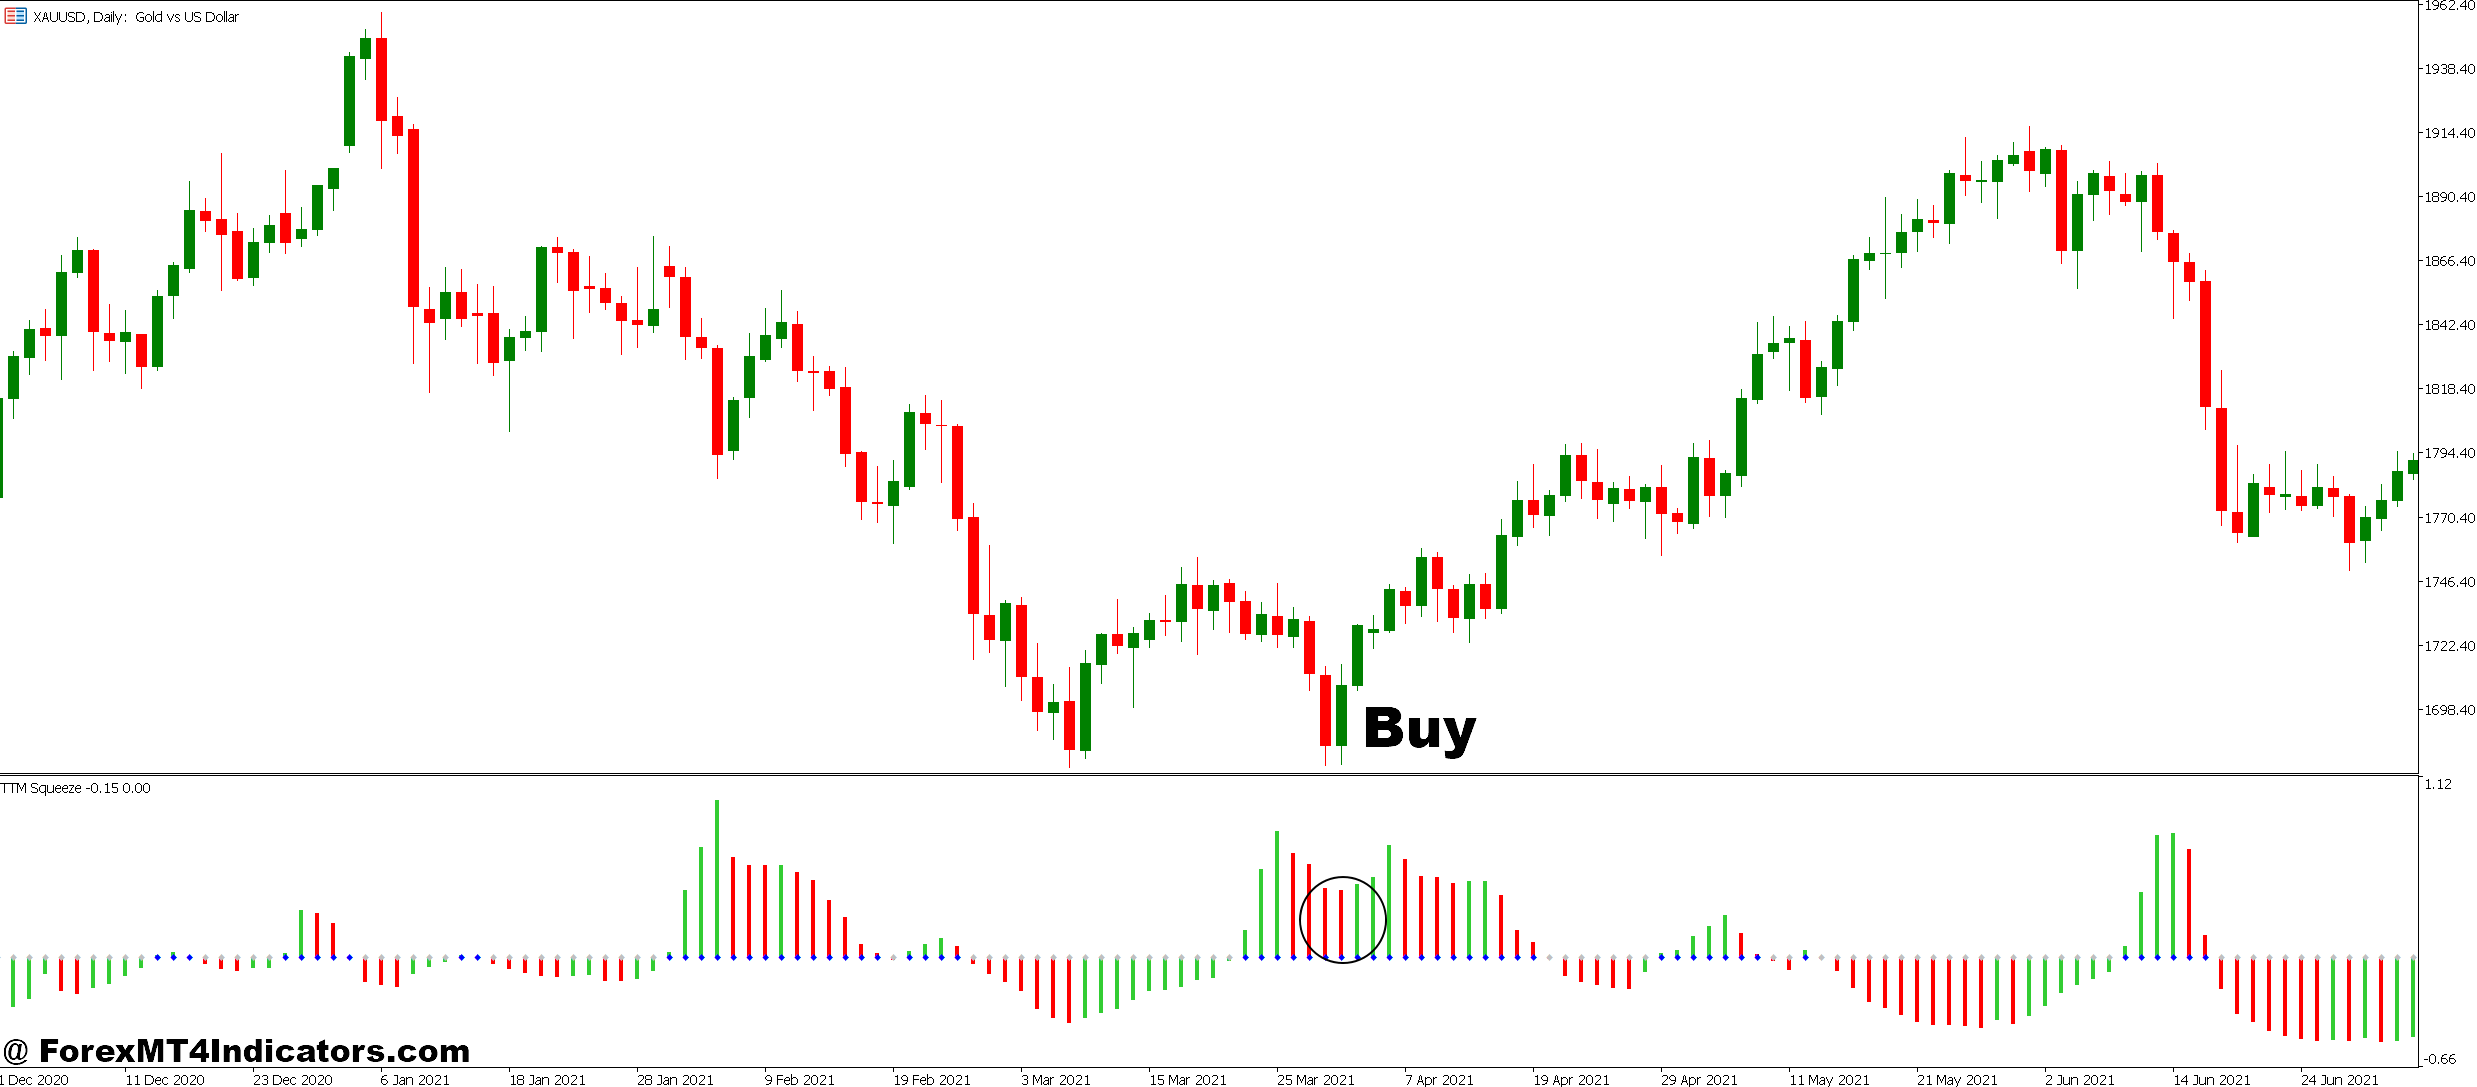
- Wait for the squeeze dots to turn from red to green – This shows the consolidation period has ended, and momentum is starting.
- Check that the histogram bars are green and rising – Green bars above the zero line confirm bullish momentum is building.
- Look for the first or second green bar after the squeeze fires – Early entries often capture the strongest part of the move.
- Confirm the breakout happens above a key support level or trend line – This adds extra confirmation to the trade setup.
- Make sure the price is moving upward when you enter – Don’t fight the direction the indicator is showing.
- Place your stop loss below the recent swing low – This protects you if the breakout fails.
- Target previous resistance levels or use a 2:1 or 3:1 risk-reward ratio – Lock in profits at logical exit points.
Sell Entry
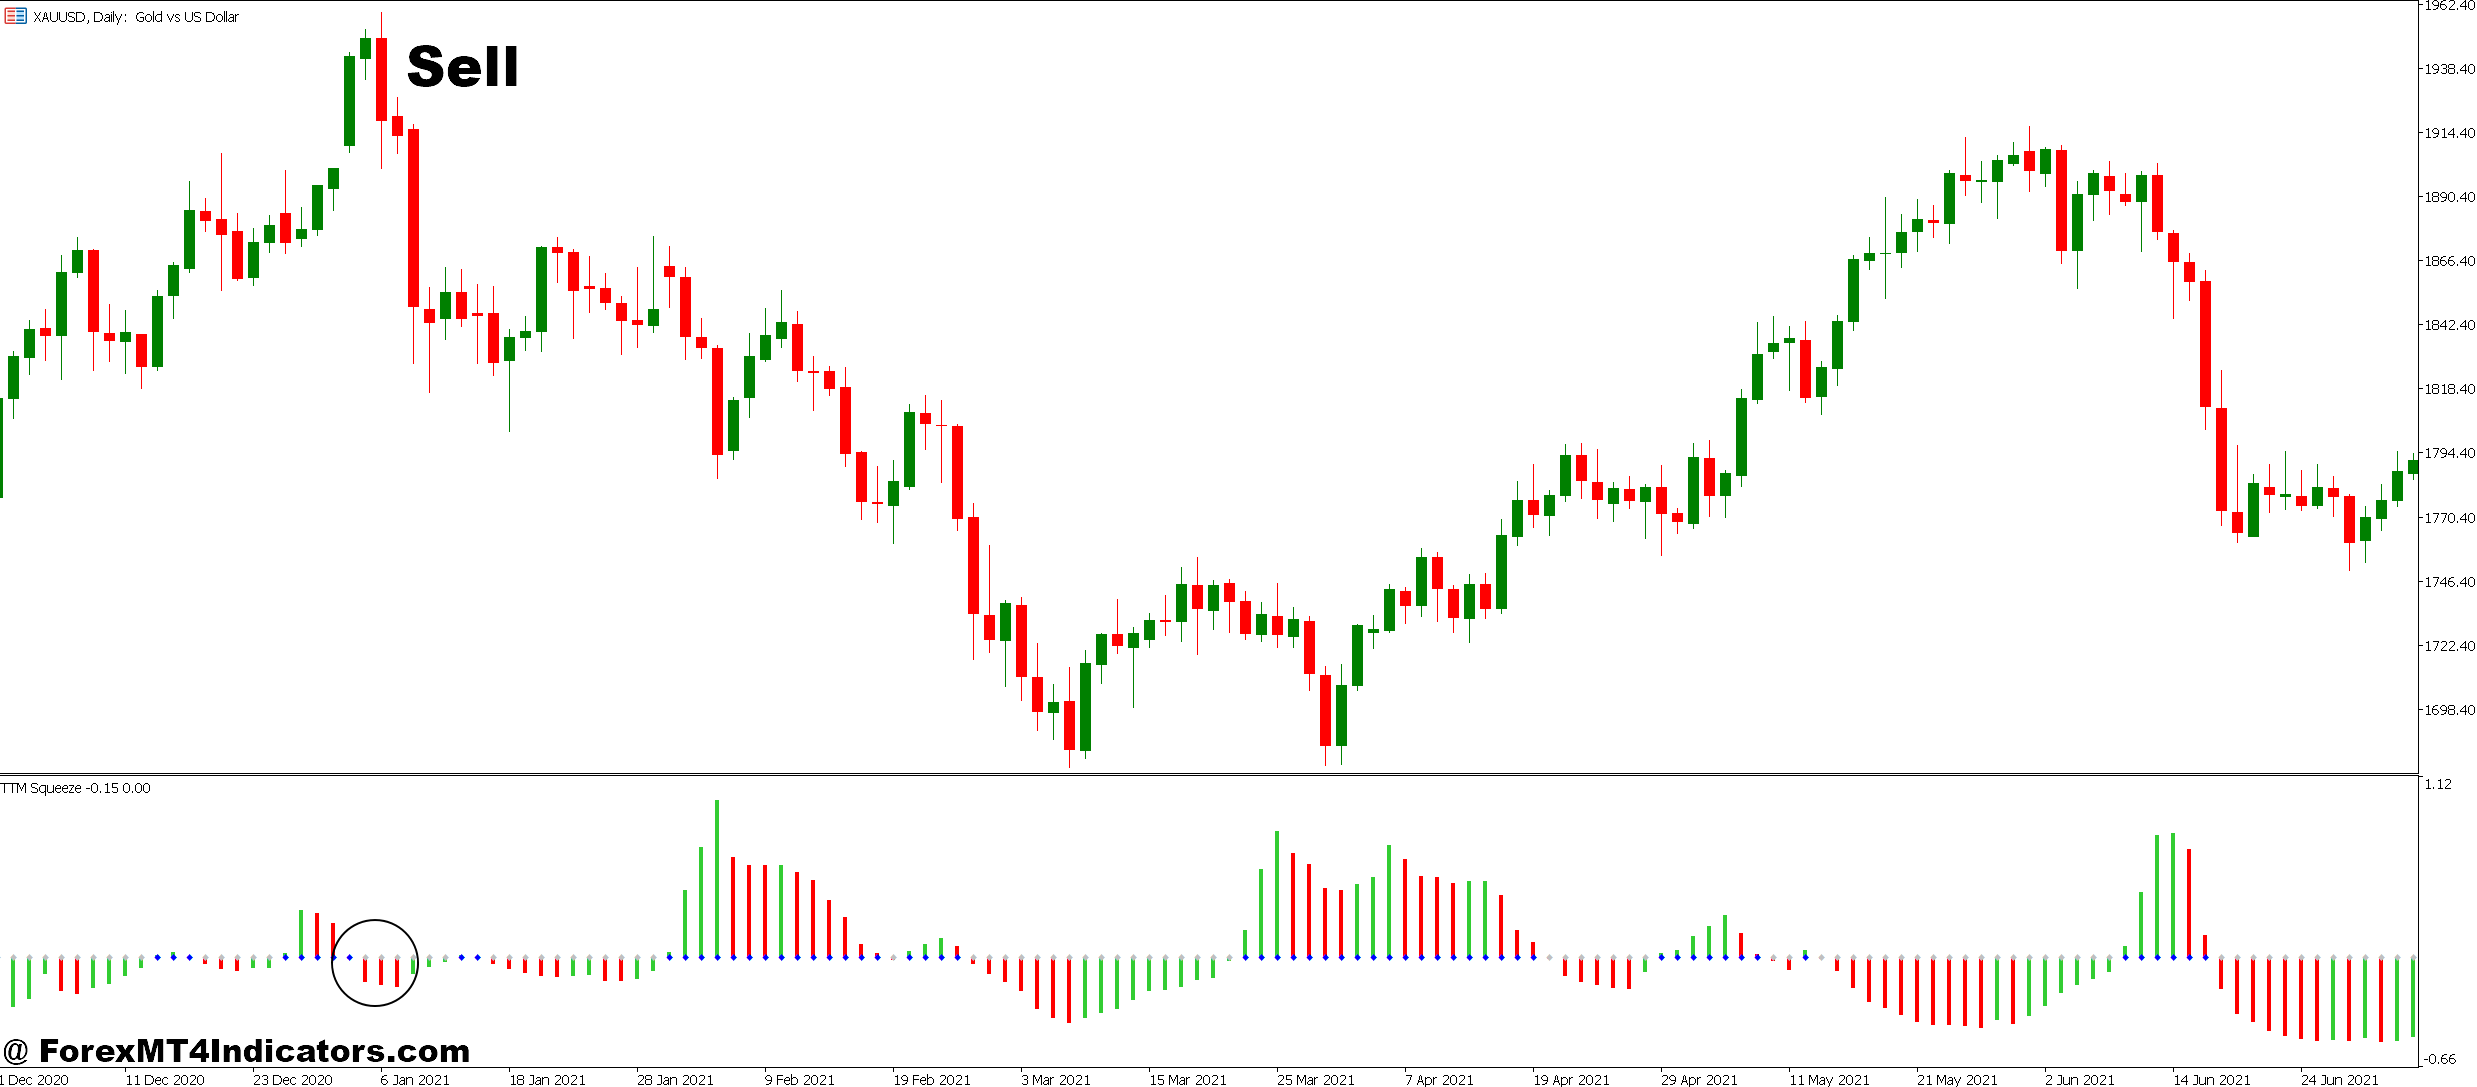
- Wait for the squeeze dots to turn from red to green – The squeeze has released, and movement is beginning.
- Check that the histogram bars are red and falling – Red bars below the zero line confirm bearish momentum is taking over.
- Look for the first or second red bar after the squeeze fires – Enter early to catch the strongest downward movement.
- Confirm the breakdown happens below a key resistance level or trend line – This validates the sell signal.
- Make sure the price is moving downward when you enter – Follow the momentum direction the indicator shows.
- Place your stop loss above the recent swing high – This limits your risk if the trade goes wrong.
- Target previous support levels or use a 2:1 or 3:1 risk-reward ratio – Take profits at areas where the price might bounce.
Conclusion
The TTM Squeeze MT5 Indicator gives traders a straightforward way to spot high-probability trading opportunities. It takes the guesswork out of consolidation periods and shows when the market is about to make its move. While no indicator is perfect, the TTM Squeeze has earned its reputation by helping traders find those moments when risk is low and reward potential is high. Anyone serious about improving their trading should spend time learning how this tool works and testing it on their favorite markets.
Level up your trading
Learn to read the chart — not just the indicator
eBook · Instant PDF
Video Course · 12 modules
Recommended MT4/MT5 Brokers
- ✓ *FREE *$50 to start (withdrawable)
- ✓ Deposit bonus up to $5,000
- ✓ Negative balance protection
Trading forex and CFDs carries a significant risk of loss and is not suitable for everyone. Broker links are affiliate links — we may earn a commission at no cost to you.
Free MT4 Indicator Download

Enter Your Email Address below, download link will be sent to you.
Trading on MetaTrader 4? Get the TTM Squeeze indicator for MT4 — the same squeeze concept, packaged for MT4. To see the volatility channels behind the squeeze, check the Keltner Channel indicator for MT5.
