

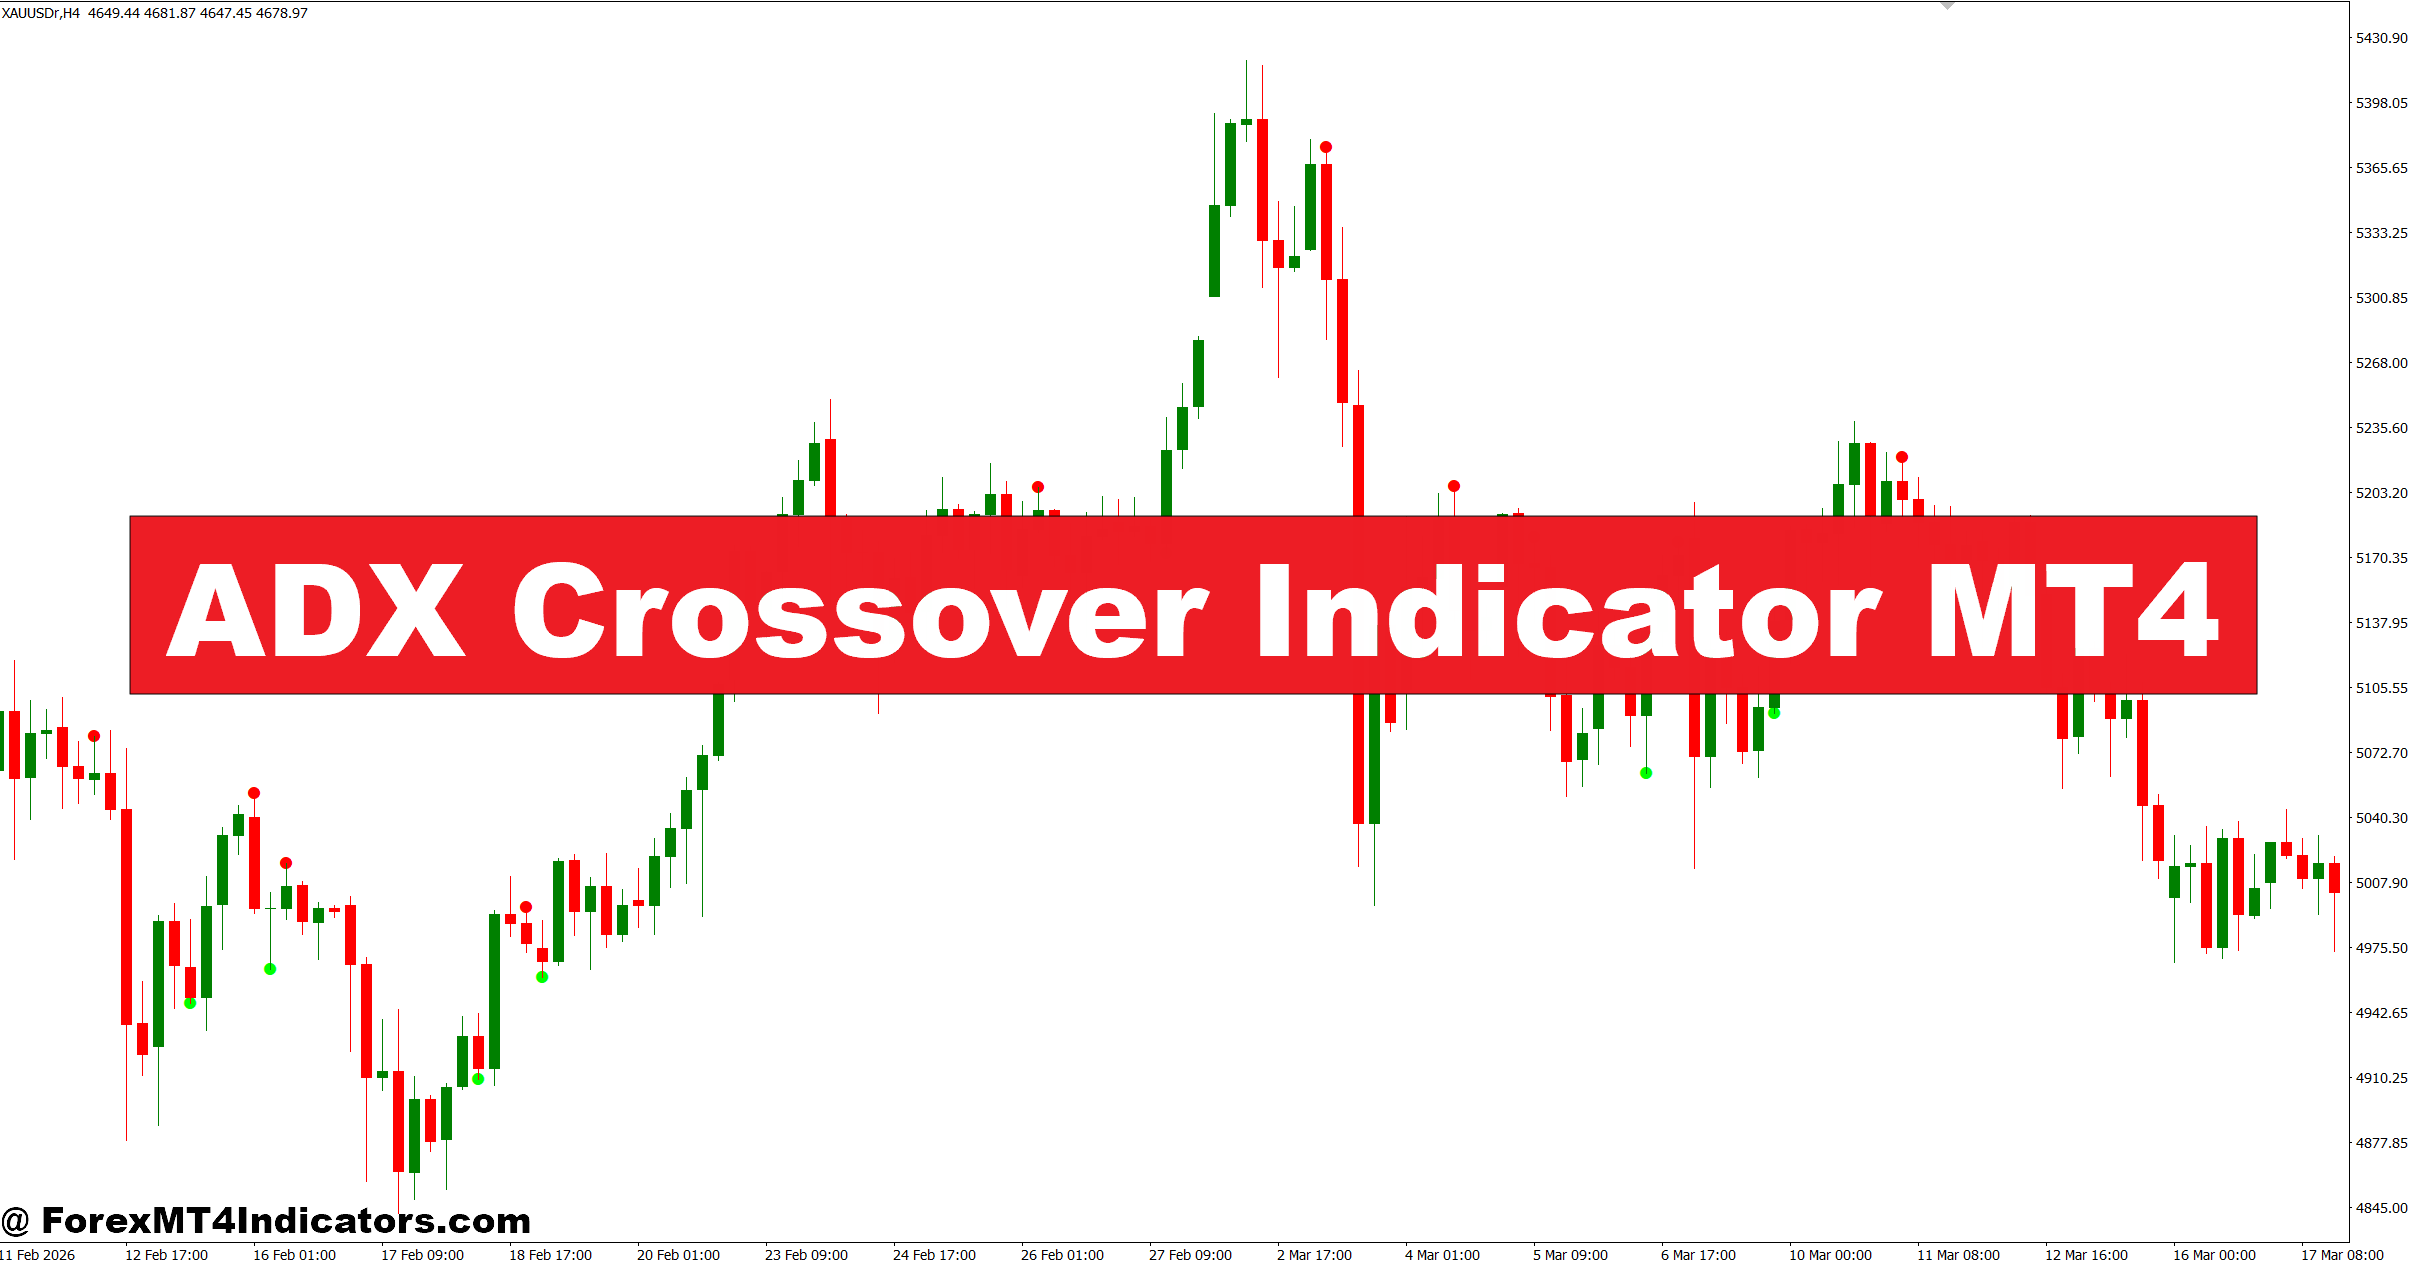
The ADX Crossover Indicator MT4 was designed to help solve that problem. Instead of focusing only on price direction, it measures trend strength while using directional crossovers to highlight possible buying and selling opportunities. When combined with price action and proper risk management, it can help traders filter out low-quality setups and improve timing. Before adding it to a trading plan, it’s worth understanding exactly how it works and where it performs best.
Understanding the ADX Crossover Indicator MT4
The ADX Crossover Indicator MT4 is a trend-following technical tool based on the Average Directional Index (ADX) developed by J. Welles Wilder. Unlike moving averages that simply follow price, the ADX measures the strength of a trend regardless of whether the market is rising or falling.
The indicator combines three important components:
- ADX line, which measures trend strength.
- Positive Directional Indicator (+DI), showing bullish pressure.
- Negative Directional Indicator (-DI), showing bearish pressure.
A trading signal appears when the +DI and -DI lines cross each other. The ADX line acts as a filter. Many traders ignore crossover signals when the ADX remains below 20 because weak trends often produce unnecessary whipsaws.
For example, if EUR/USD on the 1-hour chart shows the +DI crossing above the -DI while the ADX rises from 18 to 28, the market may be entering a stronger bullish phase rather than another short-lived bounce.
How the Indicator Calculates Trend Strength
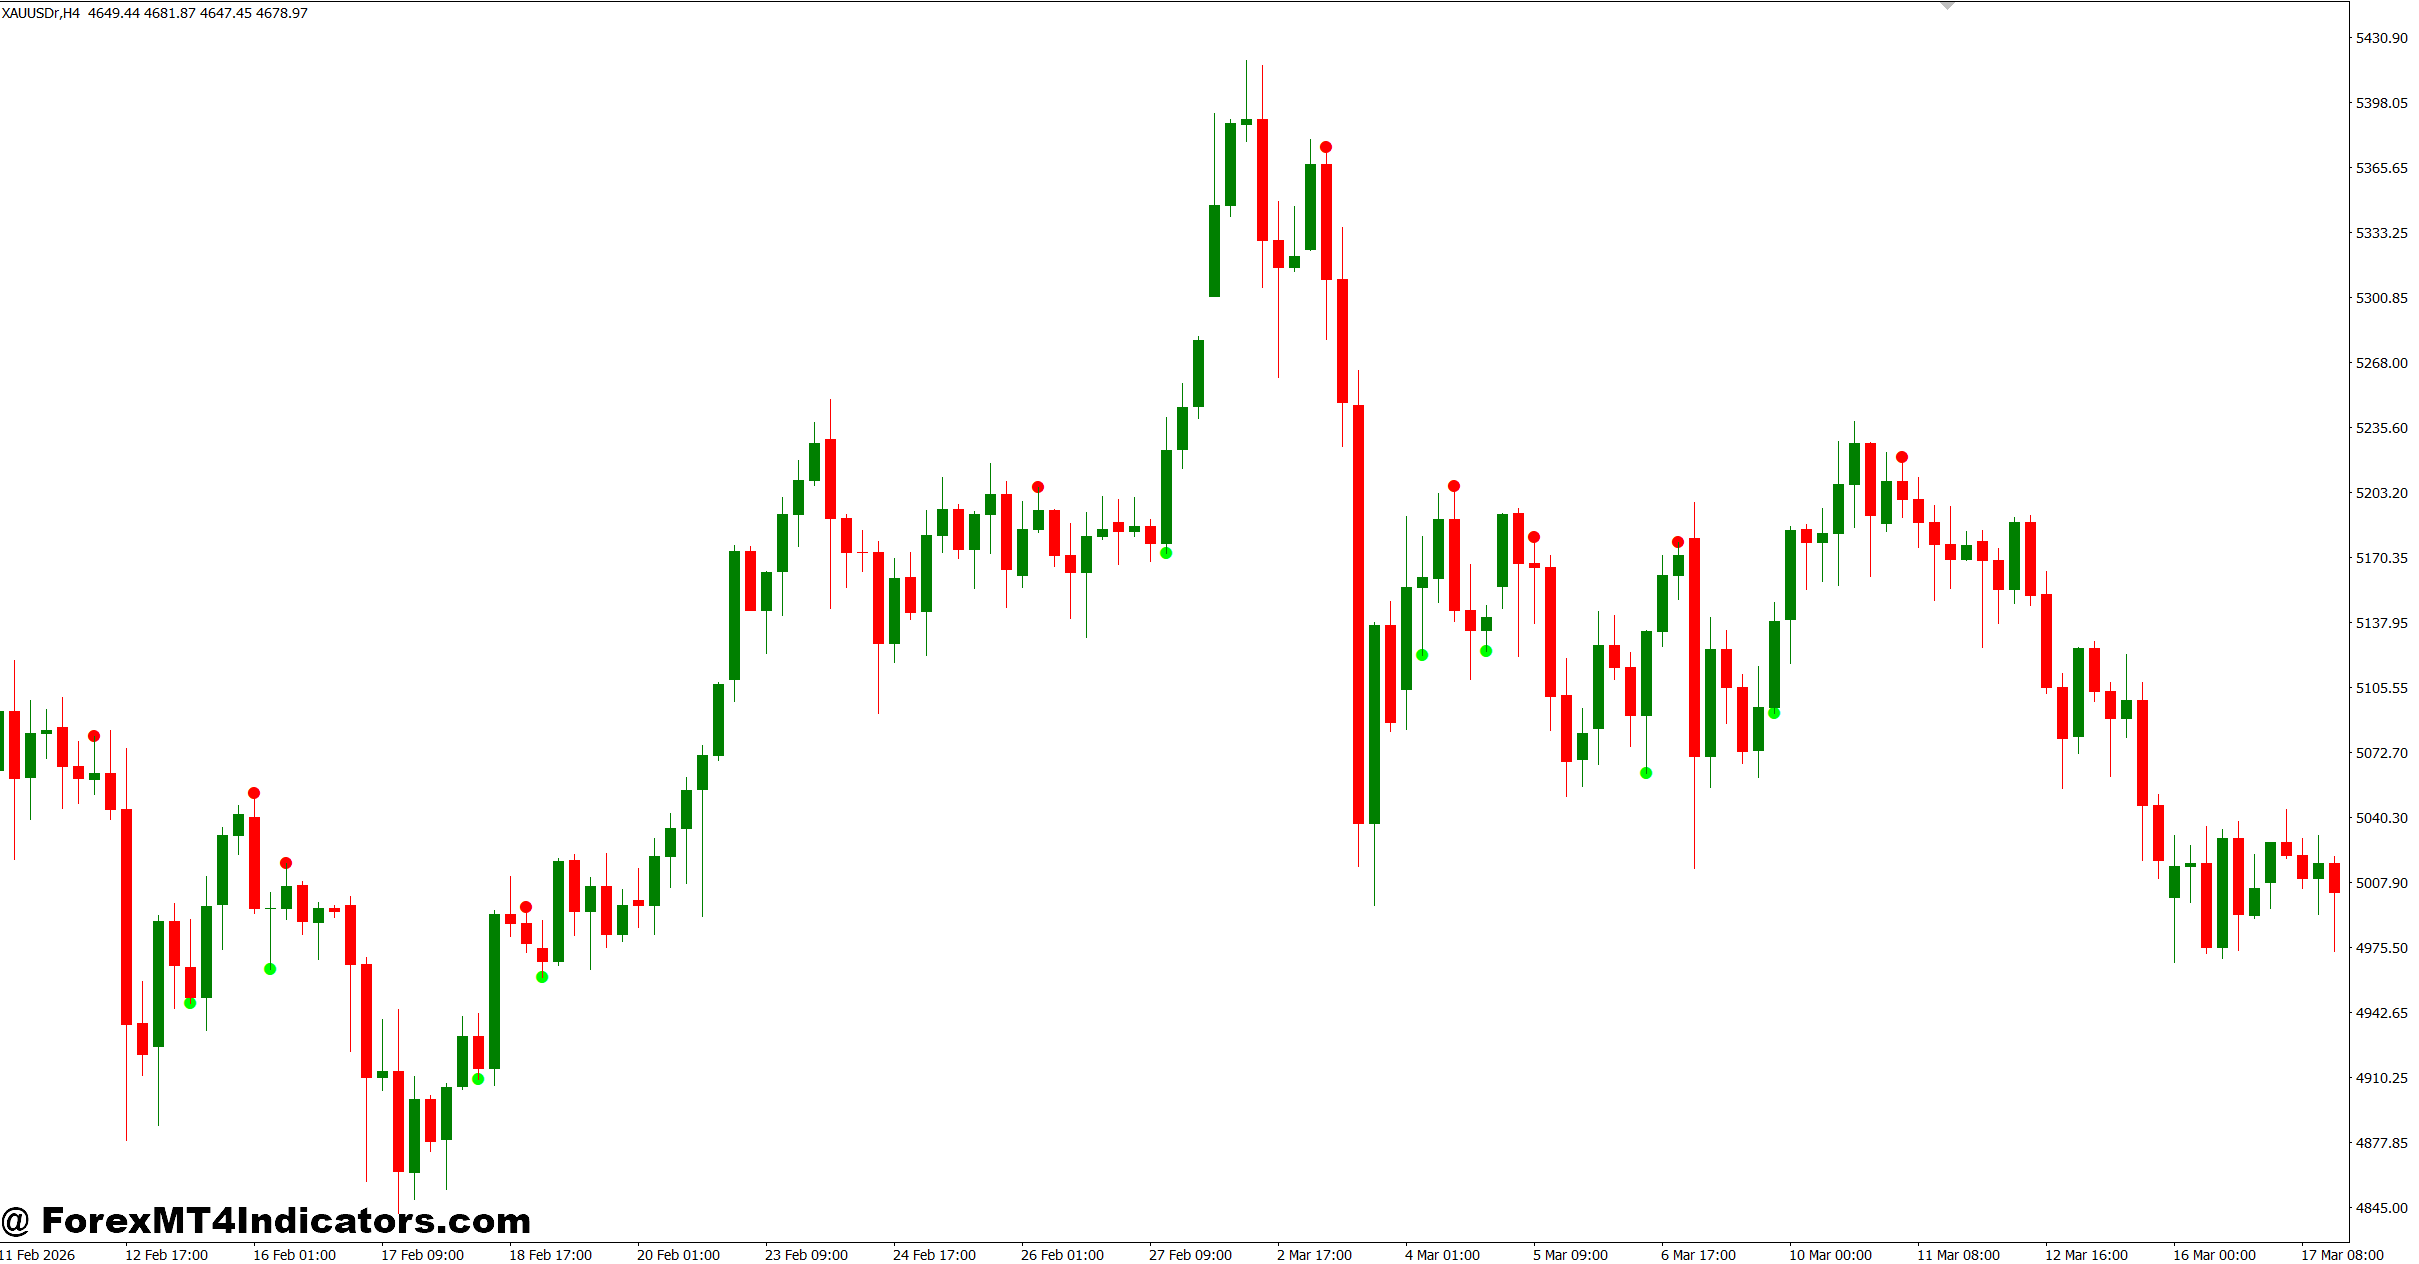
The indicator starts by comparing each candle’s high and low with the previous candle. From those price movements, it calculates positive and negative directional movement.
These values are then smoothed over a selected period, with 14 periods being the standard setting. The ADX itself does not tell traders whether to buy or sell. Instead, it measures how strong the current trend has become.
Here’s a practical interpretation many traders use:
- ADX below 20 suggests a weak or ranging market.
- ADX between 20 and 25 indicates a developing trend.
- ADX above 25 often confirms stronger momentum.
- ADX above 40 signals a very strong trend, although entries may already be extended.
During testing on GBP/USD after major London session breakouts, stronger trades usually appeared when the ADX climbed above 25 shortly after the crossover. Signals generated while the ADX remained below 18 produced noticeably more fake-outs.
One detail experienced traders often notice is that the ADX can continue rising even after the market begins slowing. That happens because the calculation measures trend strength rather than current momentum. Looking at recent support, resistance, and candlestick behavior helps avoid late entries.
Using the ADX Crossover Indicator in Real Trading
The indicator performs best when traders use it as a confirmation tool instead of relying on crossover signals alone.
Imagine USD/JPY trading on the 4-hour chart. Price breaks above a resistance level that has held for several days. At nearly the same time, the +DI crosses above the -DI while the ADX increases from 21 to 31.
Rather than entering immediately, many disciplined traders wait for the breakout candle to close. The next candle confirms buying pressure, providing a higher-probability entry. A stop-loss may be placed 30 to 40 pips below the recent swing low, while the profit target follows a 1:2 risk-to-reward ratio.
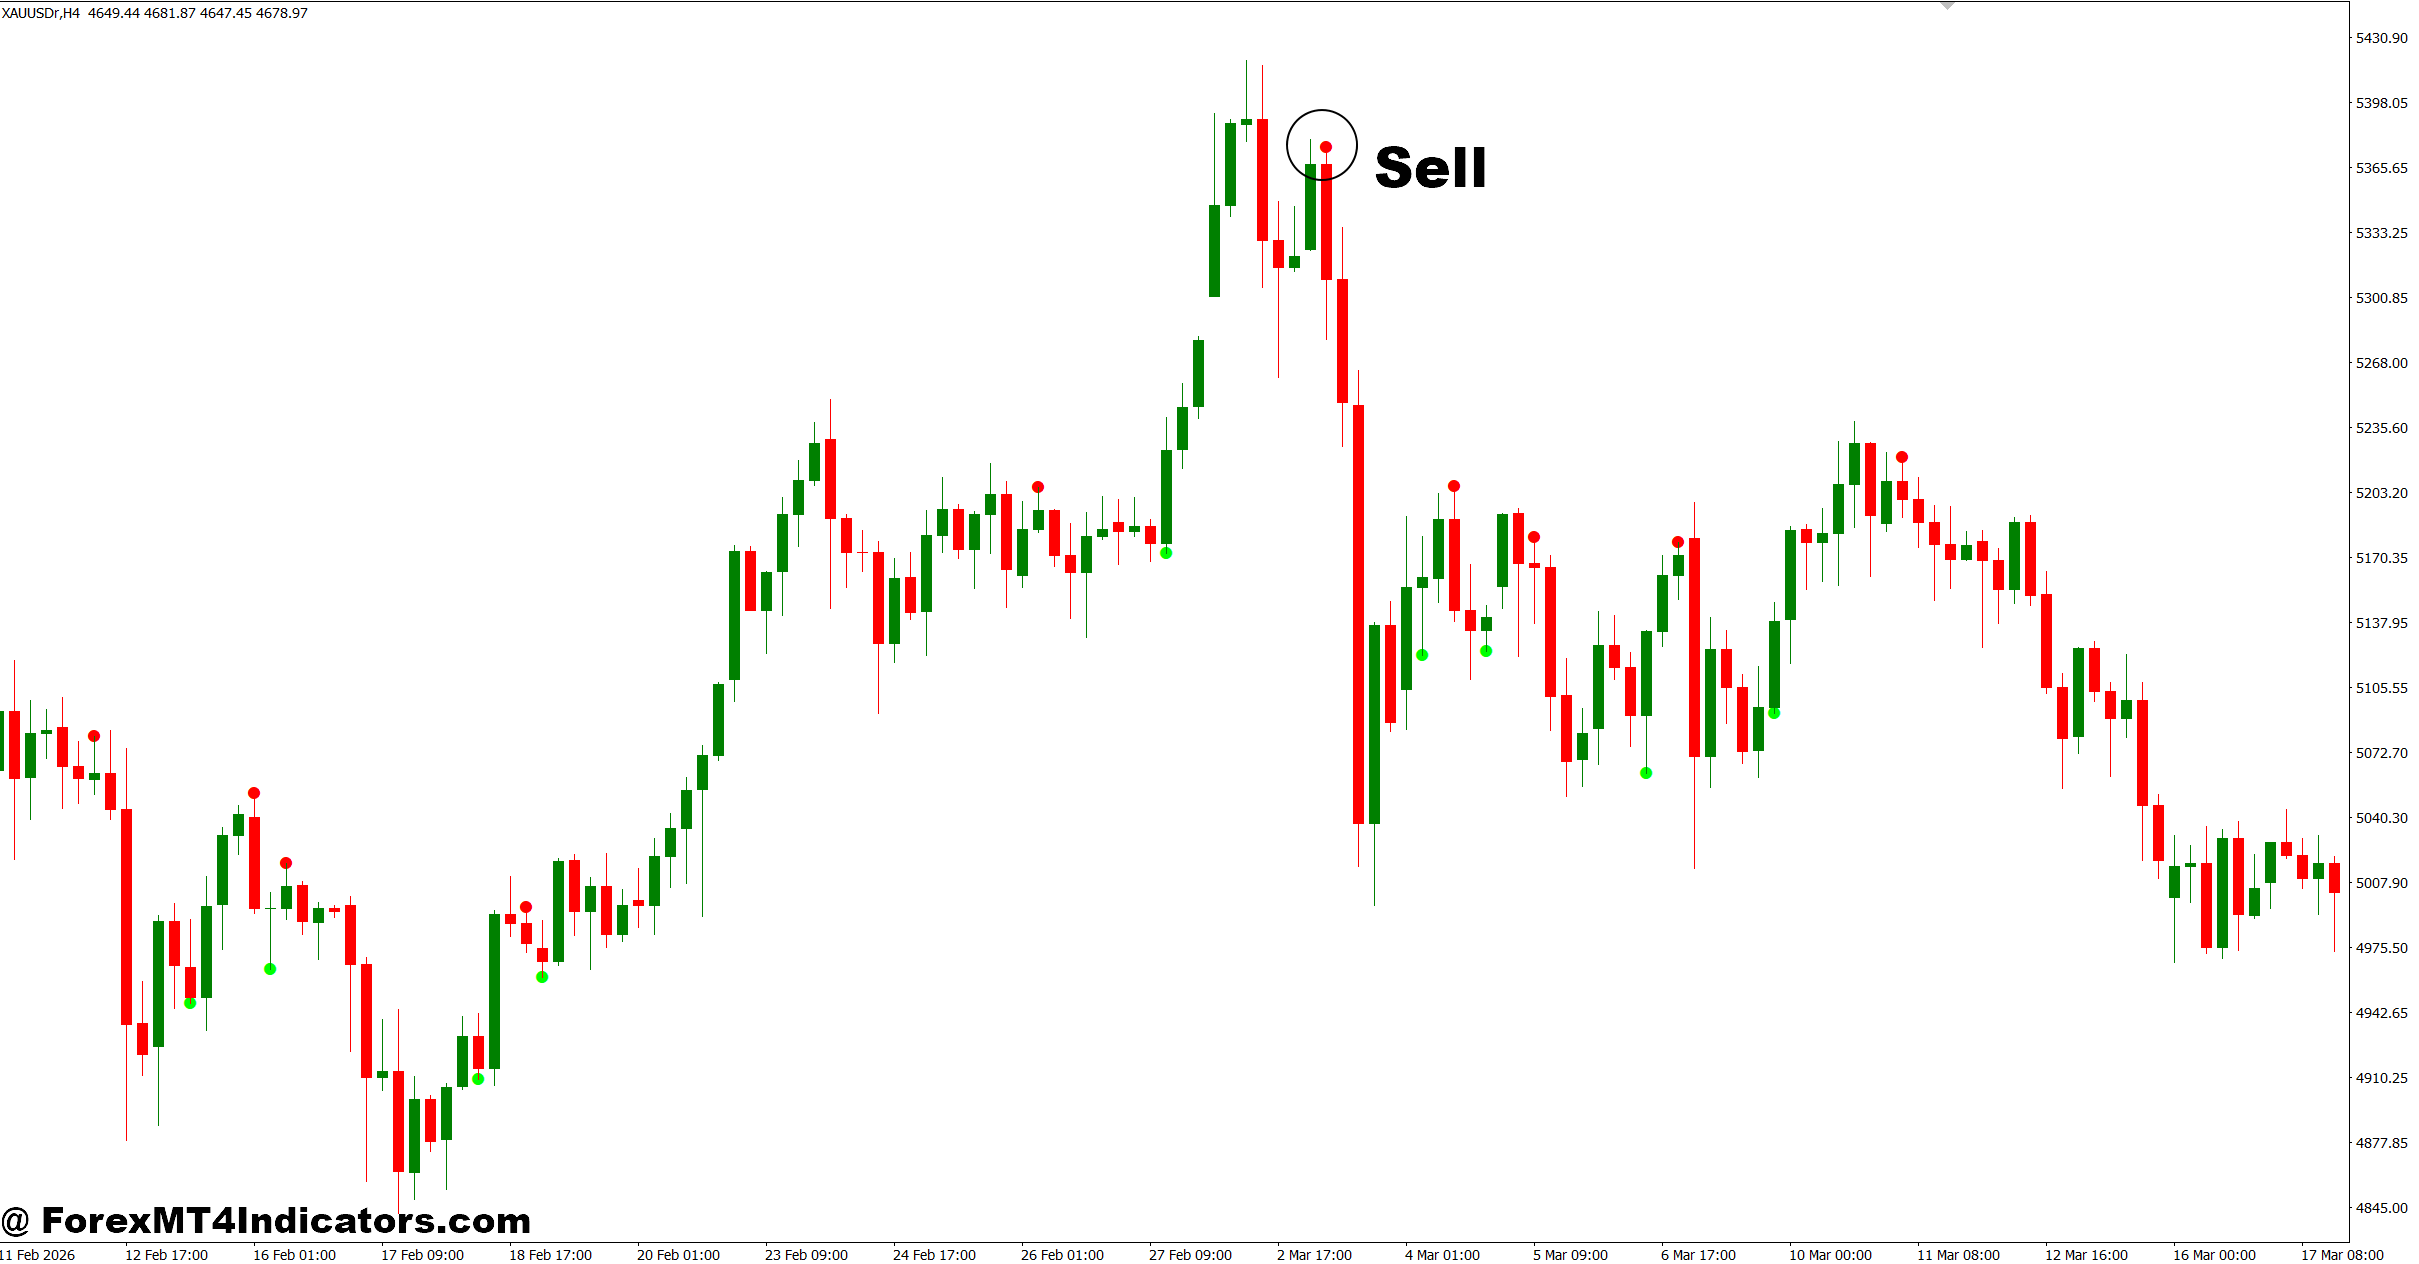
The opposite applies during bearish setups. If the -DI crosses above the +DI while the ADX climbs above 25 after a support breakdown, the trend may have enough strength to continue lower.
When testing this on volatile Non-Farm Payroll (NFP) trading days, crossover signals often appeared quickly but sometimes reversed within minutes because of sudden price spikes. Waiting until the first hour of volatility settled reduced unnecessary entries.
No indicator should replace proper trade management. Trading forex carries substantial risk. No indicator guarantees profits.
Best Settings and Customization
Most MT4 versions of the ADX Crossover Indicator use the classic 14-period calculation. Still, traders often adjust settings depending on market conditions.
Short-Term Trading
Scalpers trading the 5-minute or 15-minute charts sometimes reduce the ADX period to 7 or 10. The indicator reacts faster but also generates more false signals during market chop.
Swing Trading
For the 1-hour and 4-hour charts, the standard 14-period setting offers a balanced approach. It captures developing trends without becoming overly sensitive.
Position Trading
Daily chart traders occasionally increase the period to 20 or even 28. Signals appear less frequently, but trend confirmation becomes stronger for longer-term positions.
Some traders combine the ADX Crossover Indicator with:
- 200-period Exponential Moving Average for trend direction.
- RSI to avoid buying overbought markets.
- ATR for setting realistic stop-loss distances.
- Support and resistance zones for better entry timing.
The indicator tends to perform better during trending sessions like London and New York overlap than during quiet Asian trading hours, where ranging conditions are more common.
Strengths, Weaknesses, and How It Compares
One reason traders continue using the ADX Crossover Indicator MT4 is its ability to filter trend quality instead of simply following price.
Its biggest strengths include:
- Measures trend strength instead of direction alone.
- Filters many weak crossover signals.
- Works across multiple currency pairs and timeframes.
- Easy to combine with existing trading systems.
- Helps traders stay out of flat markets.
Still, no tool is perfect.
The indicator is slightly lagging because it relies on historical price data. Strong trends may already be underway before the crossover appears. During sideways markets, repeated crossovers can create several losing trades before a genuine trend develops.
Compared with a Moving Average Crossover, the ADX Crossover Indicator usually provides better trend confirmation because of the ADX strength filter. A Moving Average system often reacts sooner but produces more false entries during consolidation.
Compared with the MACD, ADX focuses almost entirely on trend strength, while MACD combines momentum and trend direction. Many experienced traders actually use both together to build stronger confirmation before entering the market.
Here’s the thing: the best results rarely come from one indicator alone. Price structure, support and resistance, market sessions, and disciplined risk management still play a major role in long-term trading performance.
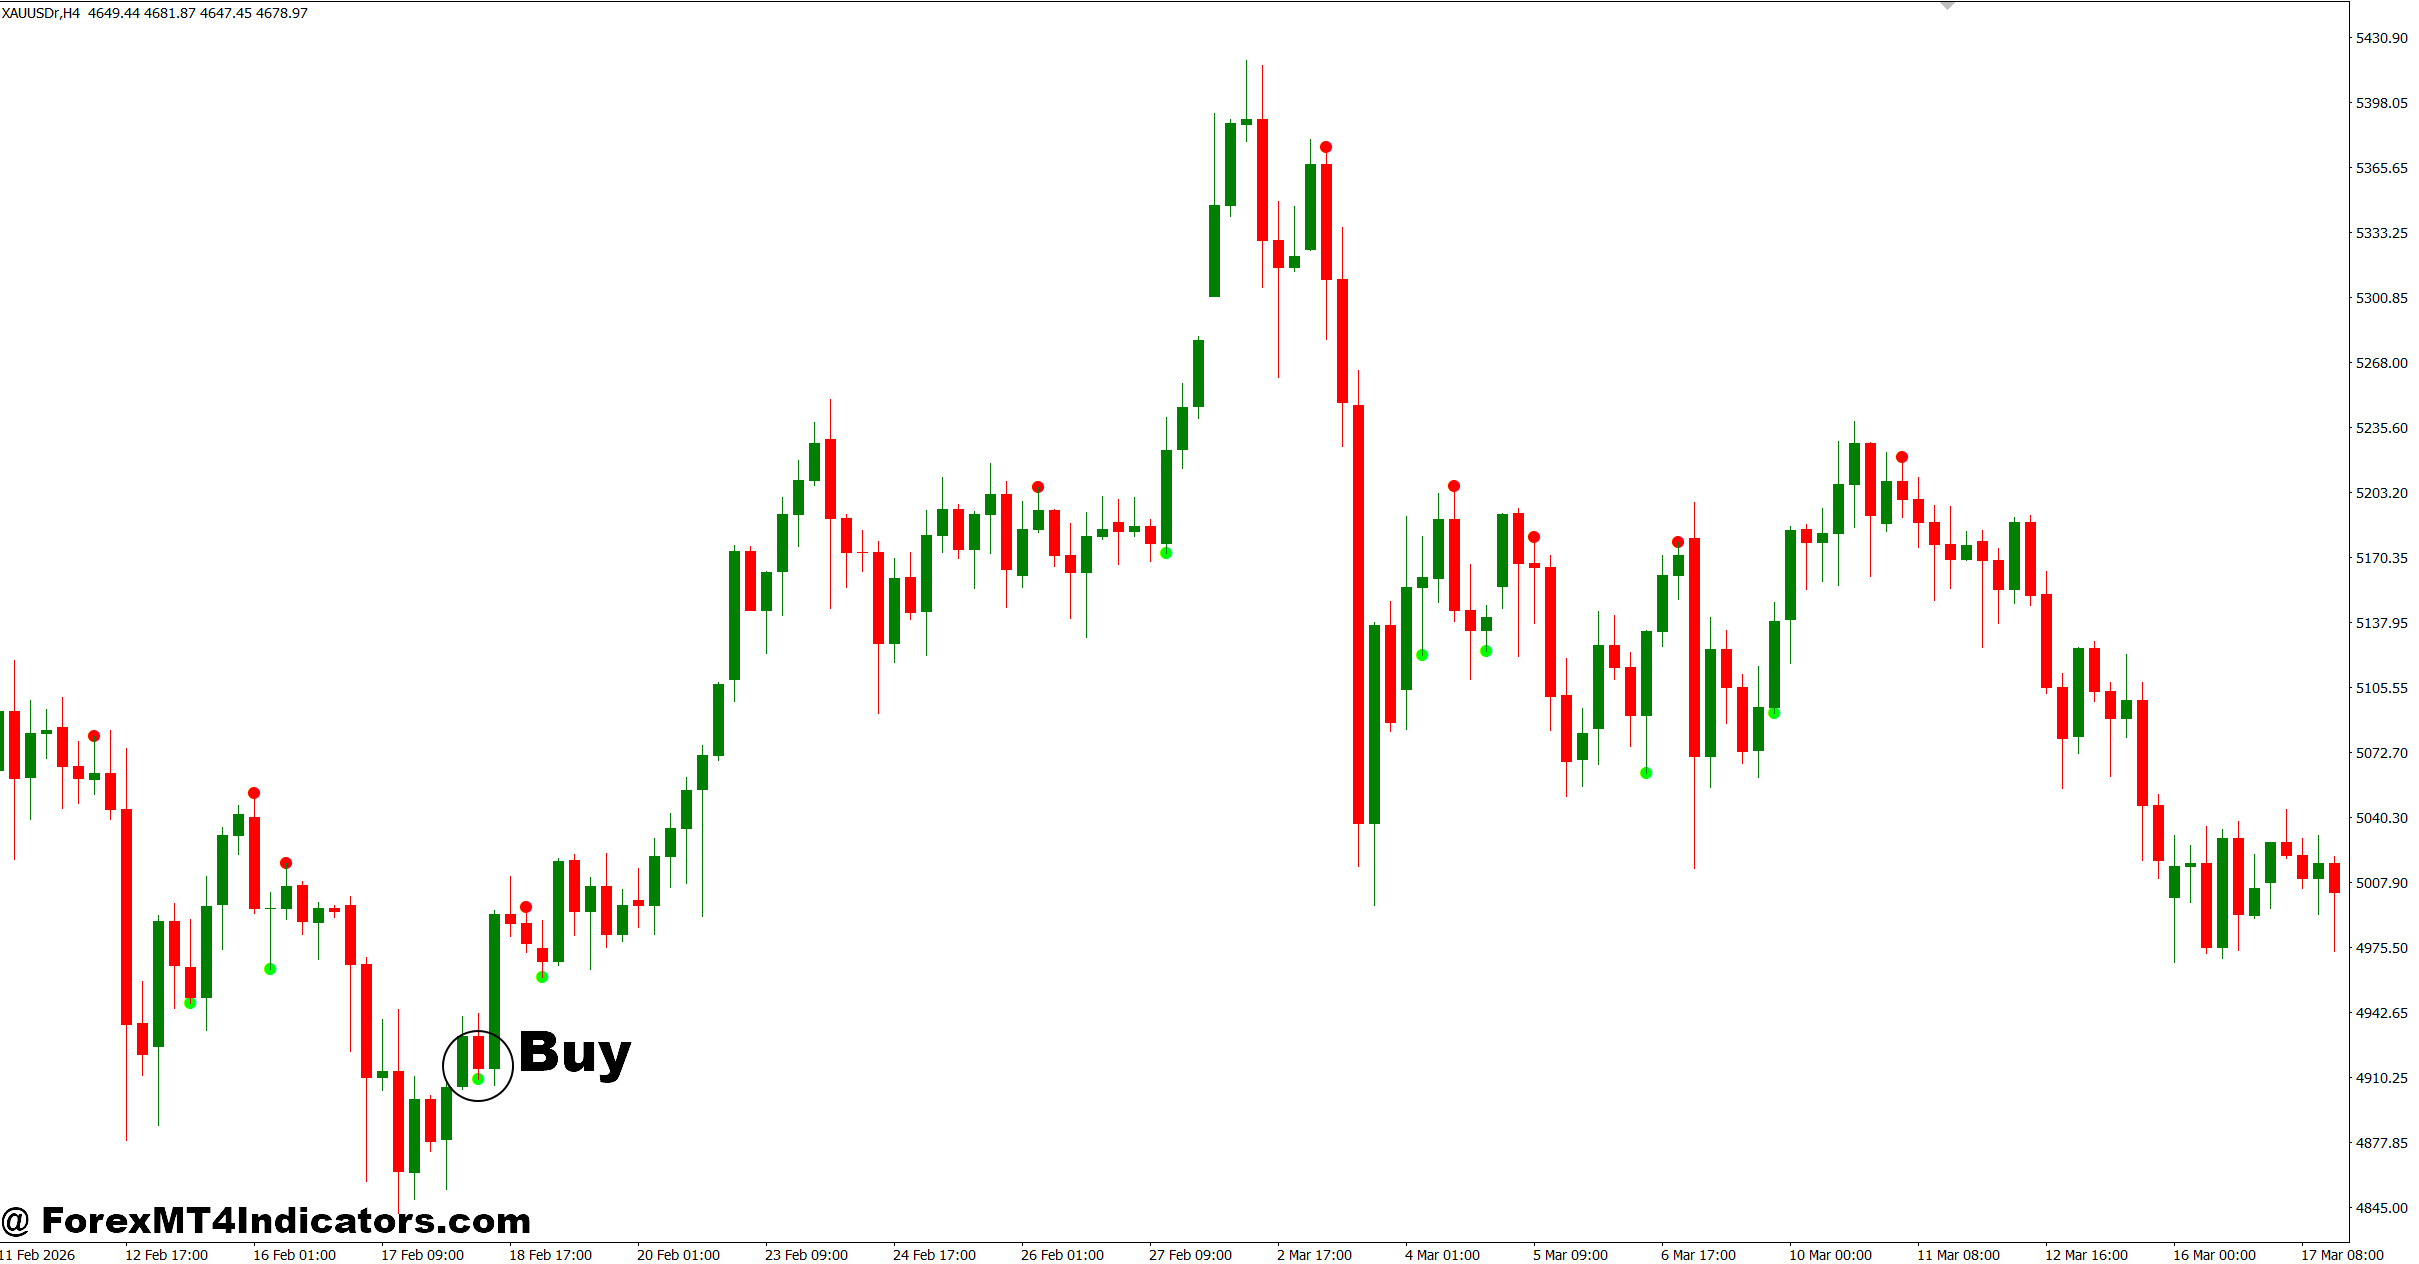
How to Trade With ADX Crossover Indicator MT4

Final Thoughts
The ADX Crossover Indicator MT4 offers traders a practical way to judge both trend direction and trend strength. Its biggest advantages include filtering weak market conditions, confirming stronger momentum, and working well alongside price action rather than replacing it. Traders should also remember that it reacts to completed price movement, meaning some signals arrive after a trend has already started. Combining it with support and resistance, sound money management, and realistic expectations creates a far more reliable trading approach. The ADX Crossover Indicator MT4 is a useful addition to many trading strategies, but consistent results still depend on patience, discipline, and continuous chart practice rather than any single indicator.
Level up your trading Learn to read the chart — not just the indicator eBook · Instant PDF Video Course · 12 modules Trading forex and CFDs carries a significant risk of loss and is not suitable for everyone. Broker links are affiliate links — we may earn a commission at no cost to you.Recommended MT4/MT5 Brokers
Free MT4 Indicator Download

Enter Your Email Address below, download link will be sent to you.
