


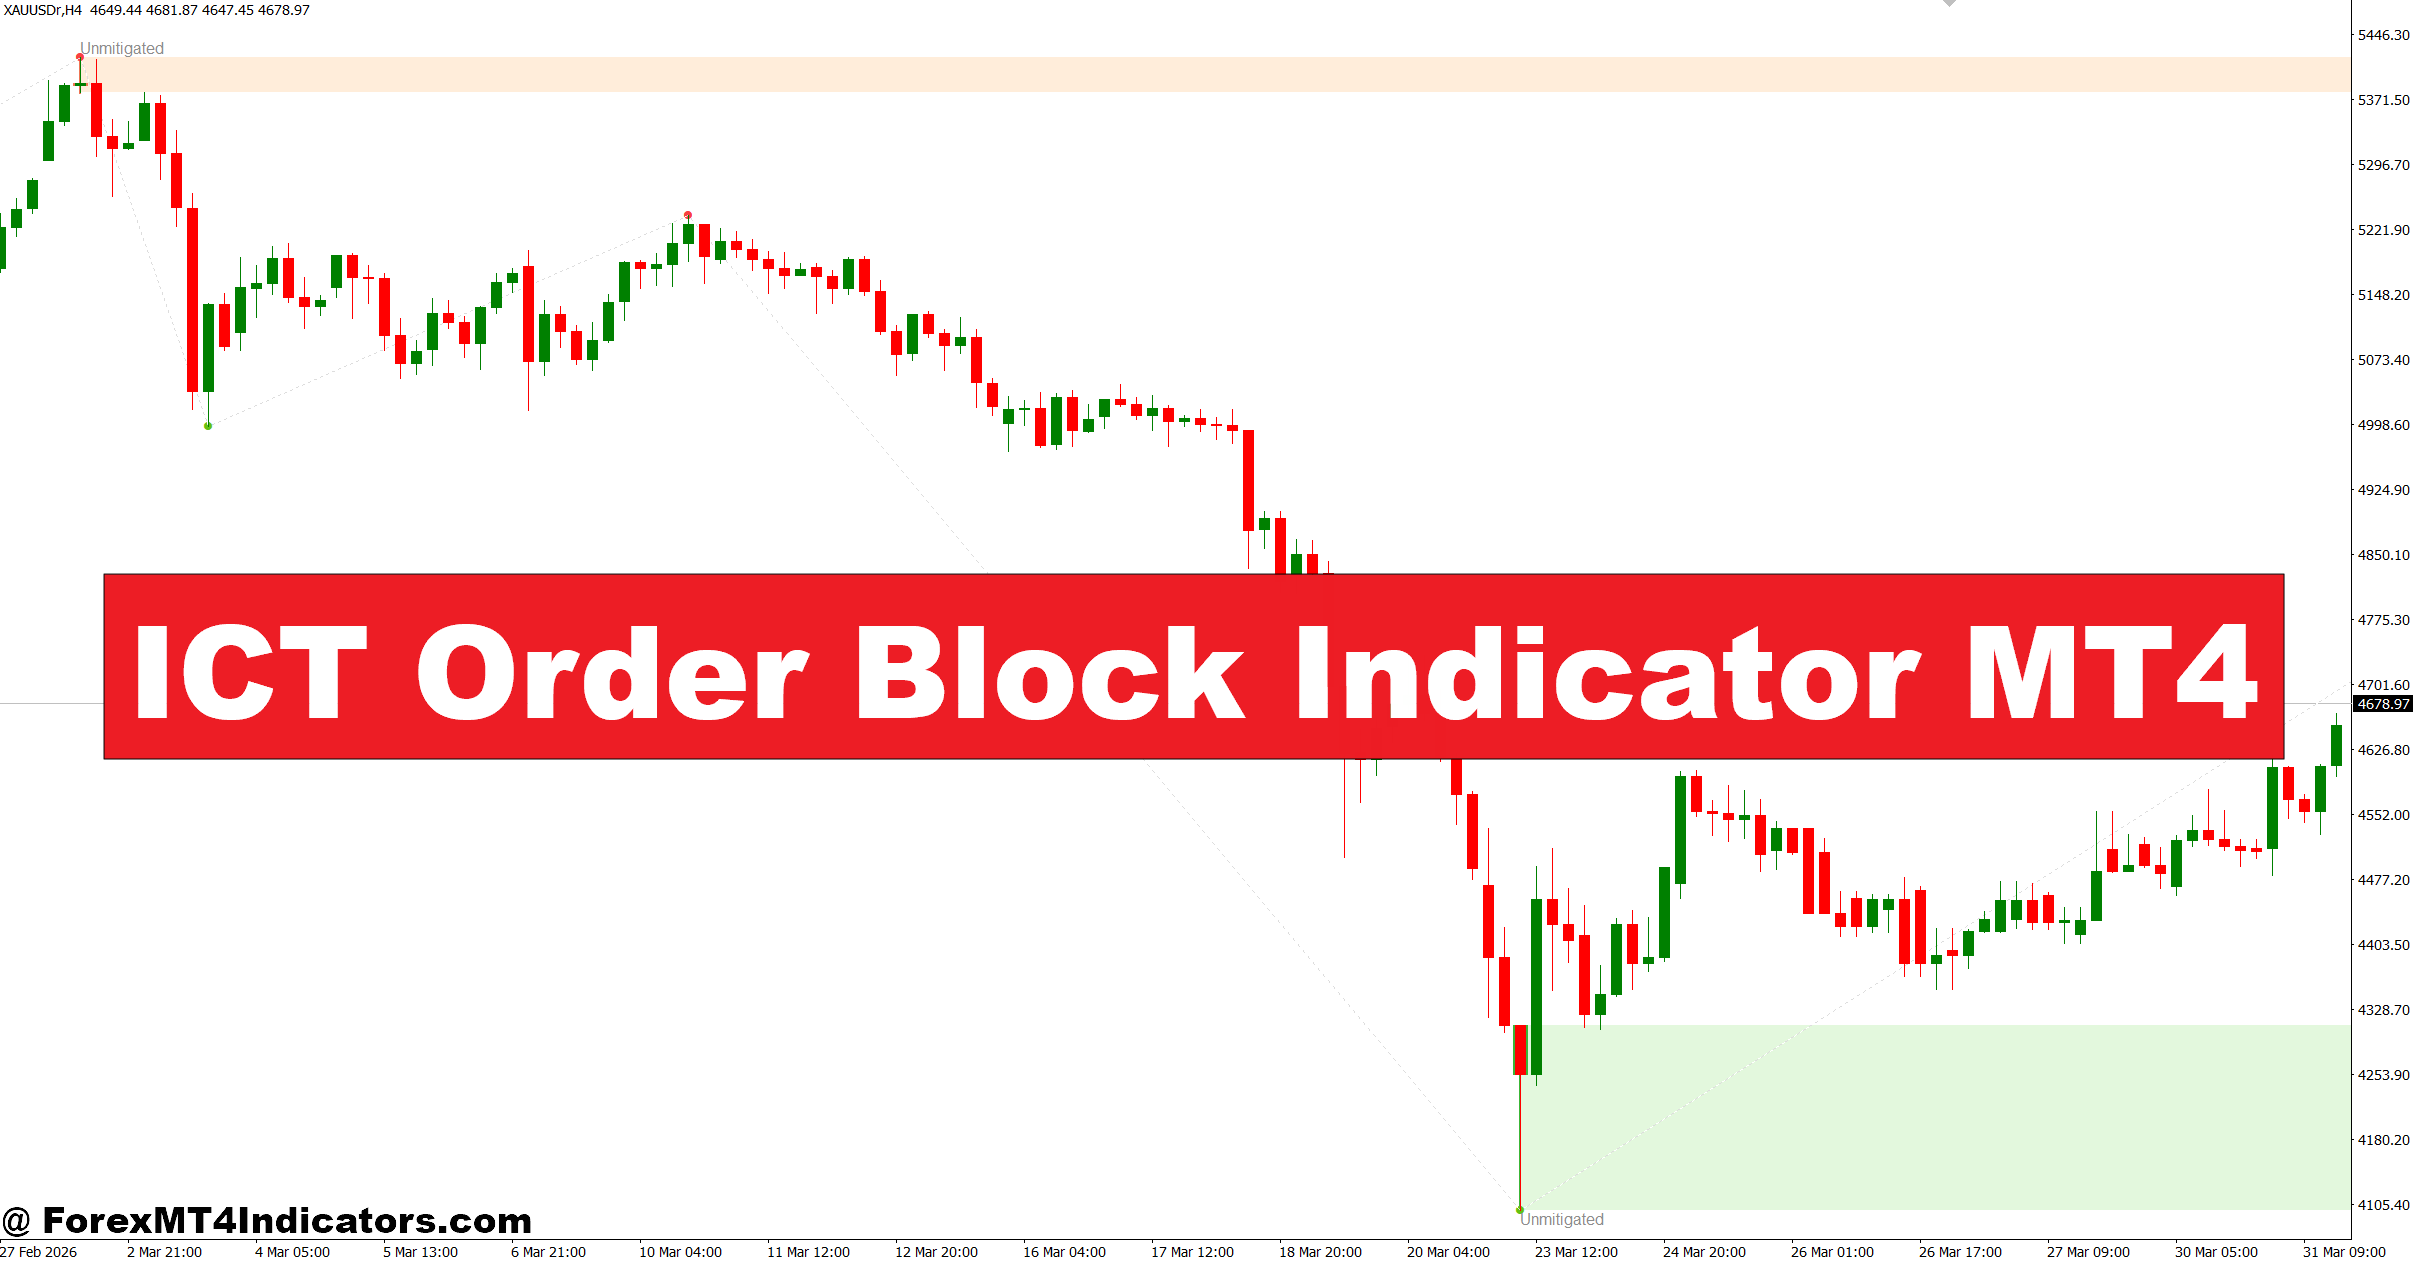
The ICT Order Block Indicator MT4 helps traders focus on areas where institutional buying and selling may have taken place instead of chasing every breakout. It highlights potential order blocks that often act as strong support or resistance zones. Rather than guessing where large market participants entered the market, traders can use these highlighted zones to improve timing and avoid weak entries. That doesn’t remove risk, but it can make decision-making more structured. The following sections explain how this indicator works, where it performs best, and how traders can include it in a disciplined trading plan.
What Is the ICT Order Block Indicator MT4?
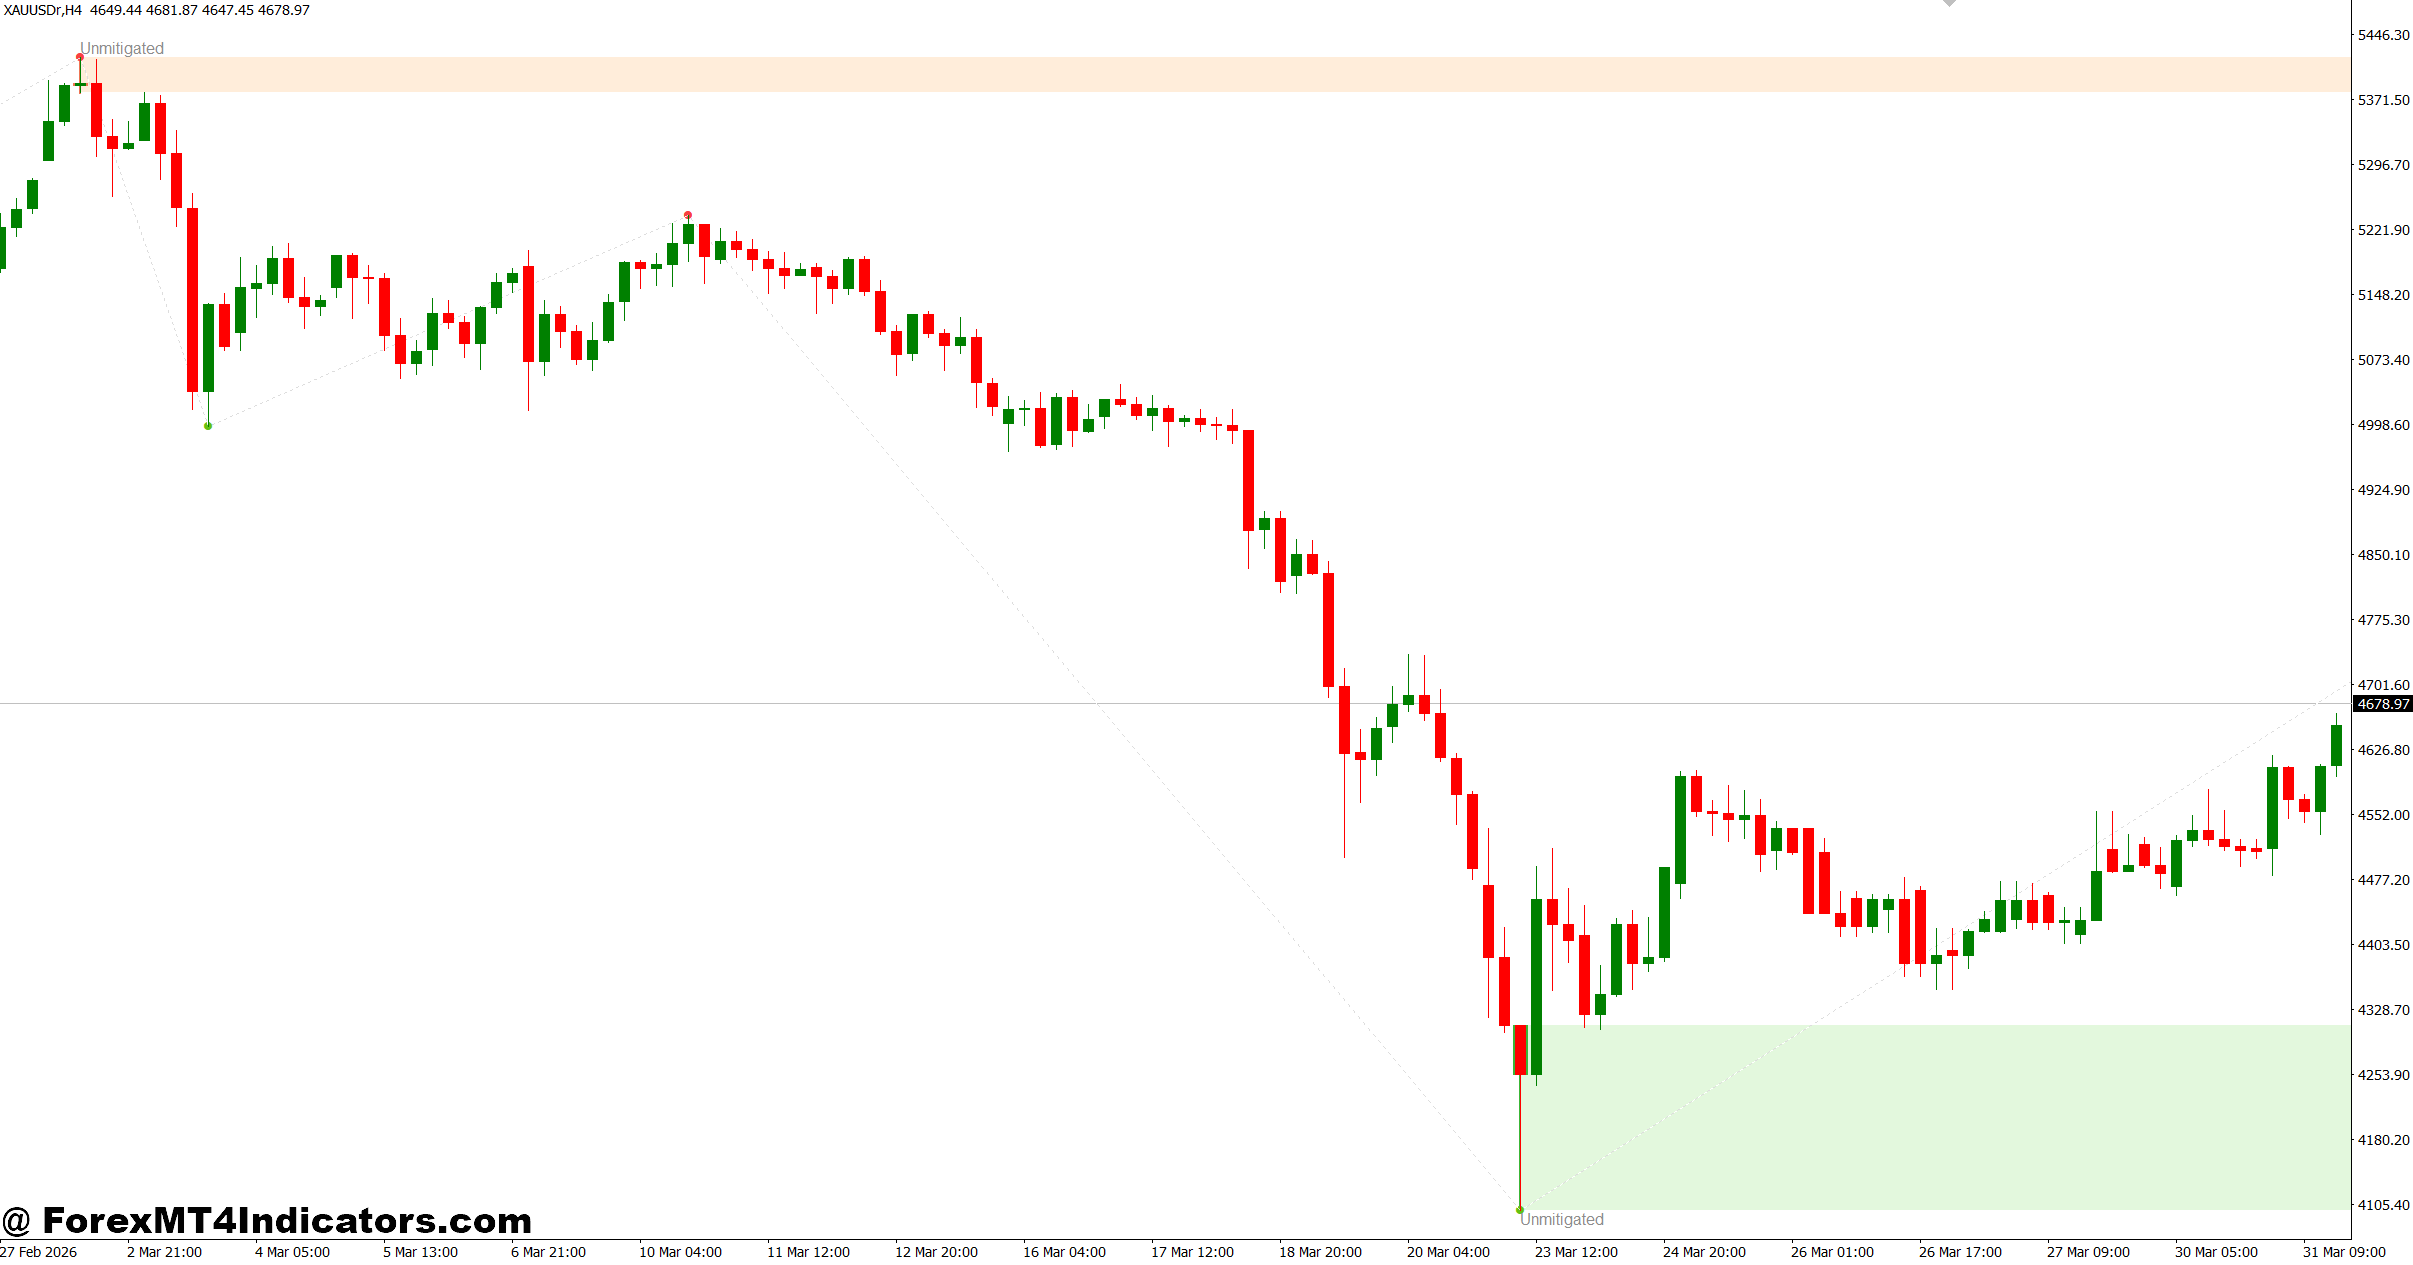
The ICT Order Block Indicator MT4 is a price action tool built around the Inner Circle Trader (ICT) trading methodology. It identifies bullish and bearish order blocks by scanning historical candles that formed before strong impulsive price moves. These areas often represent points where larger market participants accumulated or distributed positions.
Unlike moving averages or oscillators that rely mainly on mathematical calculations, this indicator studies market structure and candle behavior. It marks zones instead of single price levels, giving traders a broader area to watch for reactions.
Many traders combine order blocks with concepts such as market structure breaks, liquidity grabs, fair value gaps, and support or resistance. The indicator does not create trade signals on its own. Instead, it highlights areas where traders should pay closer attention to future price action.
How the Indicator Works in Live Market Conditions
The indicator searches for candles that appear before a strong directional move. When price leaves an area with significant momentum, that candle or group of candles becomes a potential order block.
For example, suppose EUR/USD is trading on the 1-hour chart. Price forms a bearish candle before rallying nearly 120 pips over the next trading session. The indicator marks that bearish candle as a bullish order block. If price later retraces into that zone and forms a bullish engulfing candle, many traders see it as a possible buying opportunity.
The opposite applies to bearish setups. If GBP/USD creates a strong downward impulse after a bullish candle, the indicator highlights that candle as a bearish order block. When price revisits the zone and selling pressure returns, traders may consider short positions after confirming market structure.
Here’s the thing: not every marked order block will hold. Strong news releases, unexpected central bank comments, or sudden shifts in market sentiment can break these zones without much warning.
During several trading tests on volatile NFP Fridays, many order blocks failed within the first few minutes after the data release. Waiting until market volatility settled often produced cleaner setups than entering immediately after the news.
Using ICT Order Blocks in Real Trading
Trend Continuation Entries
Many traders first determine the overall trend using higher timeframes such as the 4-hour or daily chart. After identifying an uptrend, they wait for price to retrace into a bullish order block on the 1-hour or 15-minute chart.
Imagine USD/JPY trending upward for several days. Price pulls back around 55 pips into a previously identified bullish order block. A bullish rejection candle appears while the trend remains intact. This combination gives traders additional confidence before entering a long position.
Reversal Opportunities
Order blocks can also help identify possible market reversals after liquidity sweeps.
For example, EUR/GBP briefly breaks above a recent swing high, attracting breakout buyers. Minutes later, price falls back into a bearish order block while creating a lower high. That fake-out often signals weakening buying pressure, making the bearish order block more relevant.
Still, experienced traders usually wait for confirmation such as a break of market structure rather than selling immediately after price reaches the zone.
Risk Management Matters
Trading forex carries substantial risk. No indicator guarantees profits.
Many traders place stop-loss orders 10 to 20 pips beyond the order block depending on market volatility. Profit targets are often set using previous swing highs or lows, or by maintaining at least a 1:2 risk-to-reward ratio.
Best Settings and Customization
Most versions of the ICT Order Block Indicator MT4 work well using default settings, but traders often adjust parameters based on their preferred trading style.
Scalpers on the 5-minute chart may reduce the lookback period to identify more recent order blocks. Swing traders using the daily chart usually increase historical scanning so stronger institutional zones remain visible.
Some traders also filter weak order blocks by requiring a minimum impulsive move after the originating candle. This reduces chart clutter and keeps attention on higher-quality setups.
For currency pairs:
- EUR/USD and GBP/USD often produce cleaner reactions during the London and New York sessions.
- USD/JPY may perform better when combined with trend analysis because momentum can remain strong for extended periods.
- XAU/USD (Gold) frequently respects order blocks but requires wider stop-loss placement due to higher volatility.
Testing different settings in a demo account before applying them to live trading is always a practical approach.
ICT Order Block Indicator MT4 Compared With Other Indicators
Traditional indicators such as Moving Averages, RSI, or MACD mainly react to historical price movement. They help measure trend strength or momentum but rarely identify institutional trading zones.
The ICT Order Block Indicator MT4 focuses on price structure instead of lagging calculations. This allows traders to prepare for potential reactions before price reaches the area.
Compared with supply and demand indicators, ICT order blocks are usually more selective because they rely on specific market structure concepts rather than simply identifying every imbalance.
That said, combining this indicator with an Average True Range (ATR) indicator can improve stop-loss placement. Some traders also use volume indicators or fair value gaps to strengthen trade confirmation.
One limitation deserves attention. During ranging markets with heavy chop, the indicator may produce multiple overlapping order blocks. In these conditions, waiting for a confirmed breakout or structure shift often reduces false entries.
How to Trade with ICT Order Block Indicator MT4
Buy Entry
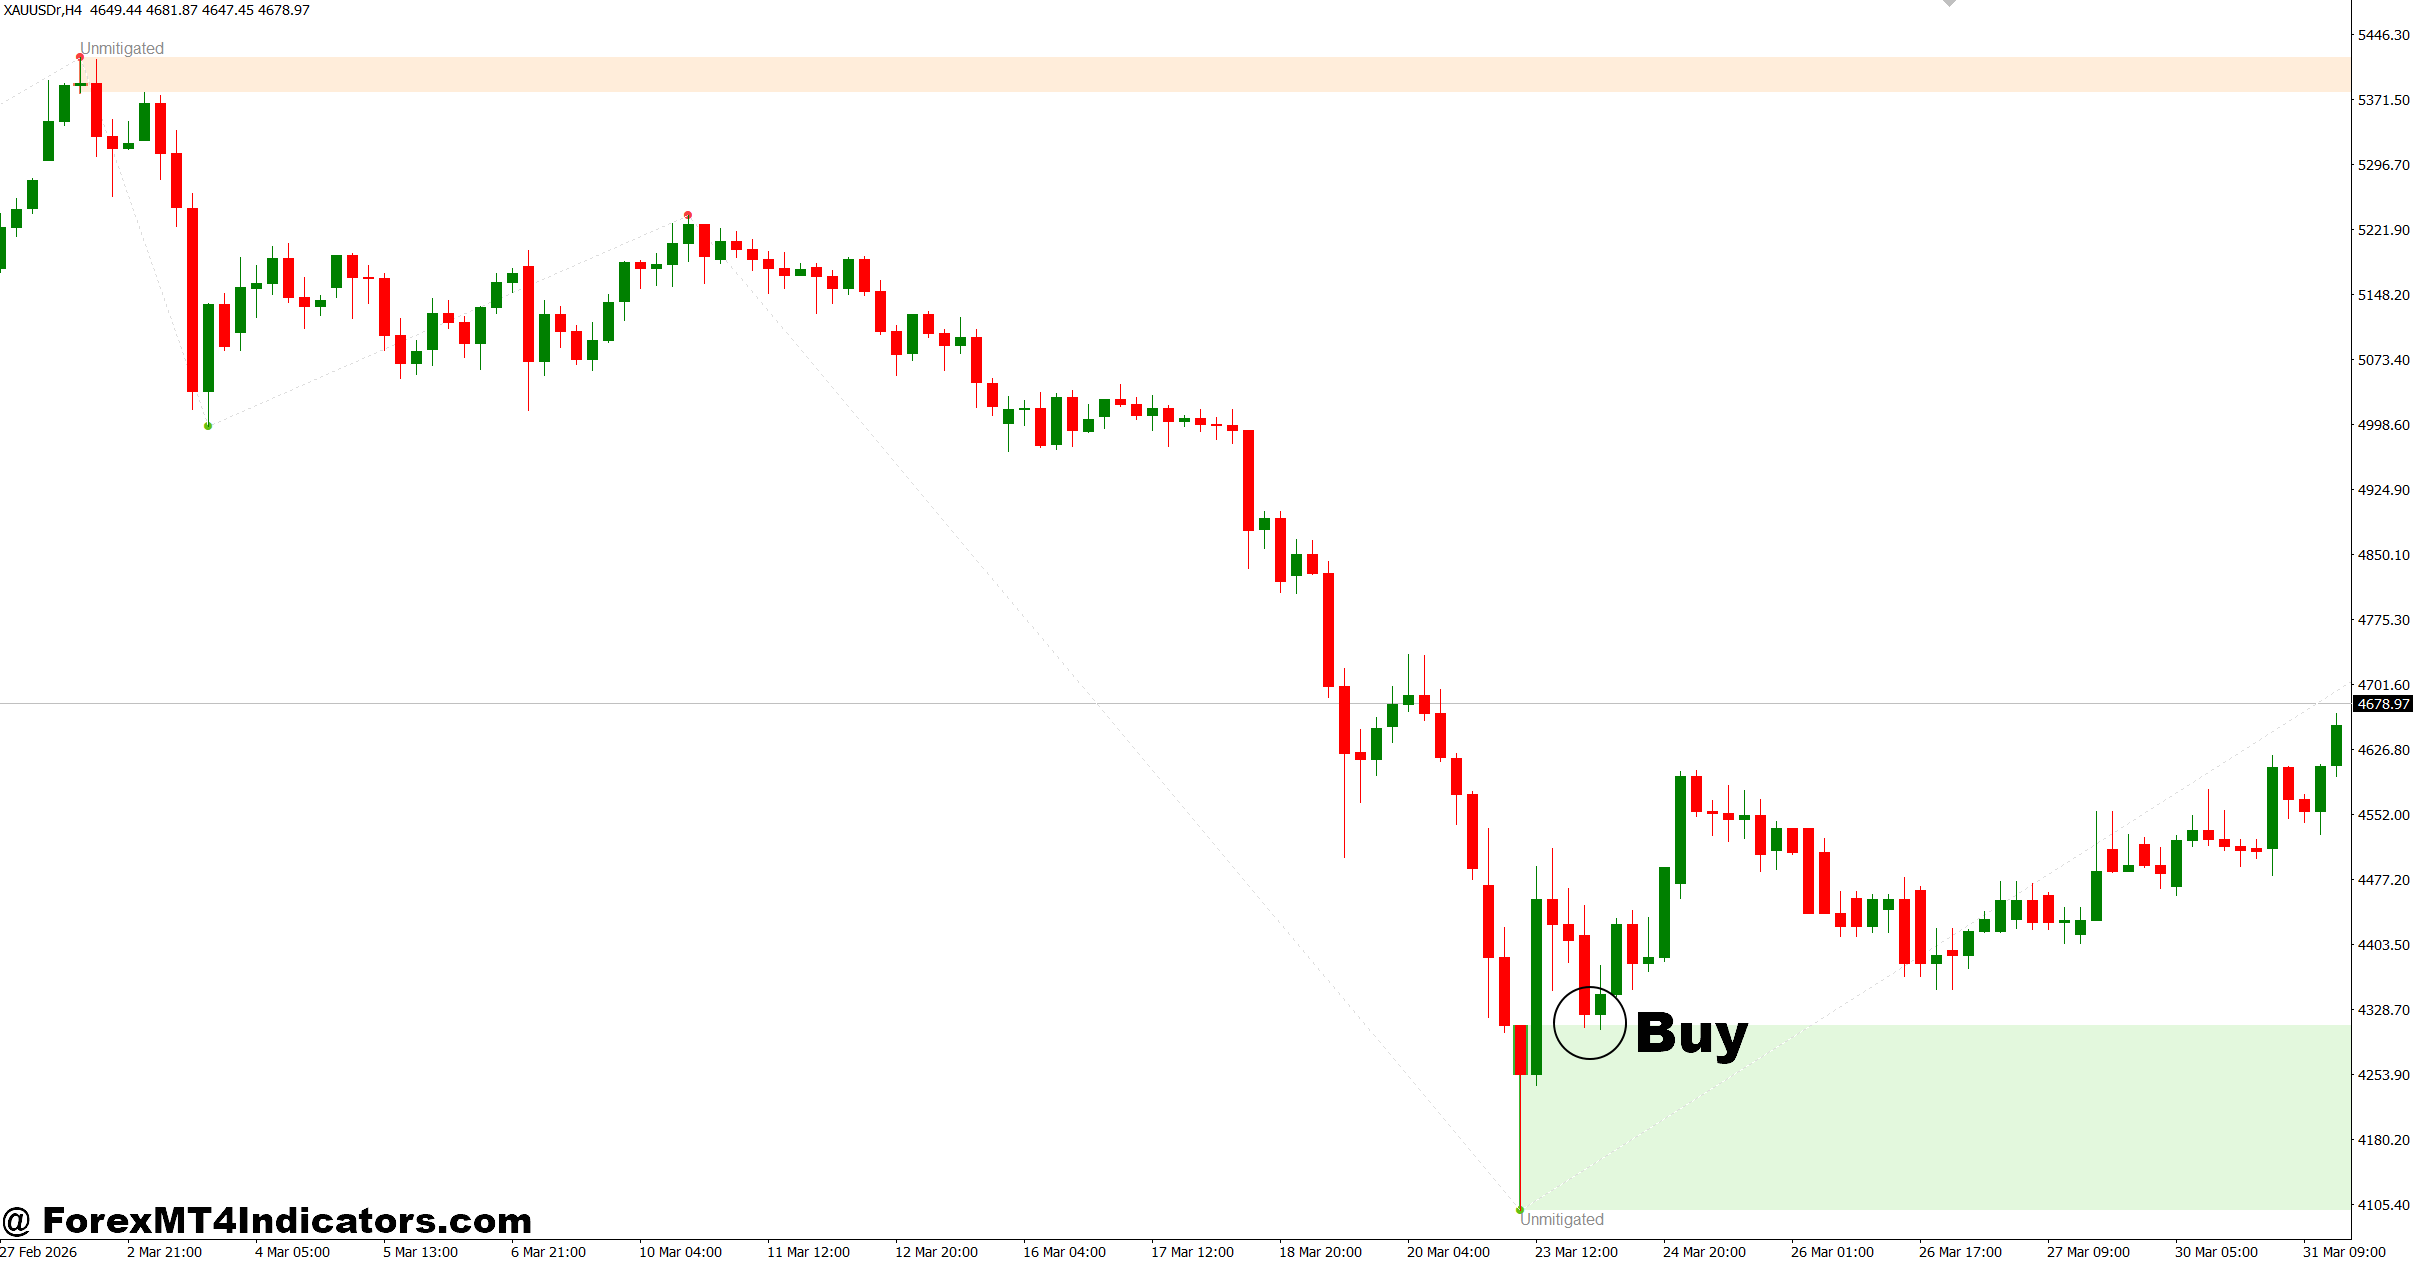
- Wait for a bullish order block – Enter after price revisits a bullish zone on the 1-hour chart and forms a bullish rejection candle.
- Confirm market structure – Buy only after a higher high forms above the order block for added confirmation.
- Trade with the higher trend – Use the 4-hour trend to filter entries and avoid counter-trend trades.
- Place a tight stop-loss – Keep the stop 10-20 pips below the order block to control risk.
- Target a healthy reward – Aim for at least a 1:2 risk-to-reward ratio or the next resistance level.
- Focus on major pairs – EUR/USD and GBP/USD often provide cleaner order block reactions during London sessions.
- Avoid major news events – Skip buy entries 15-30 minutes before high-impact economic releases.
- Manage position size – Risk only 1-2% of account balance on each buy setup.
Sell Entry
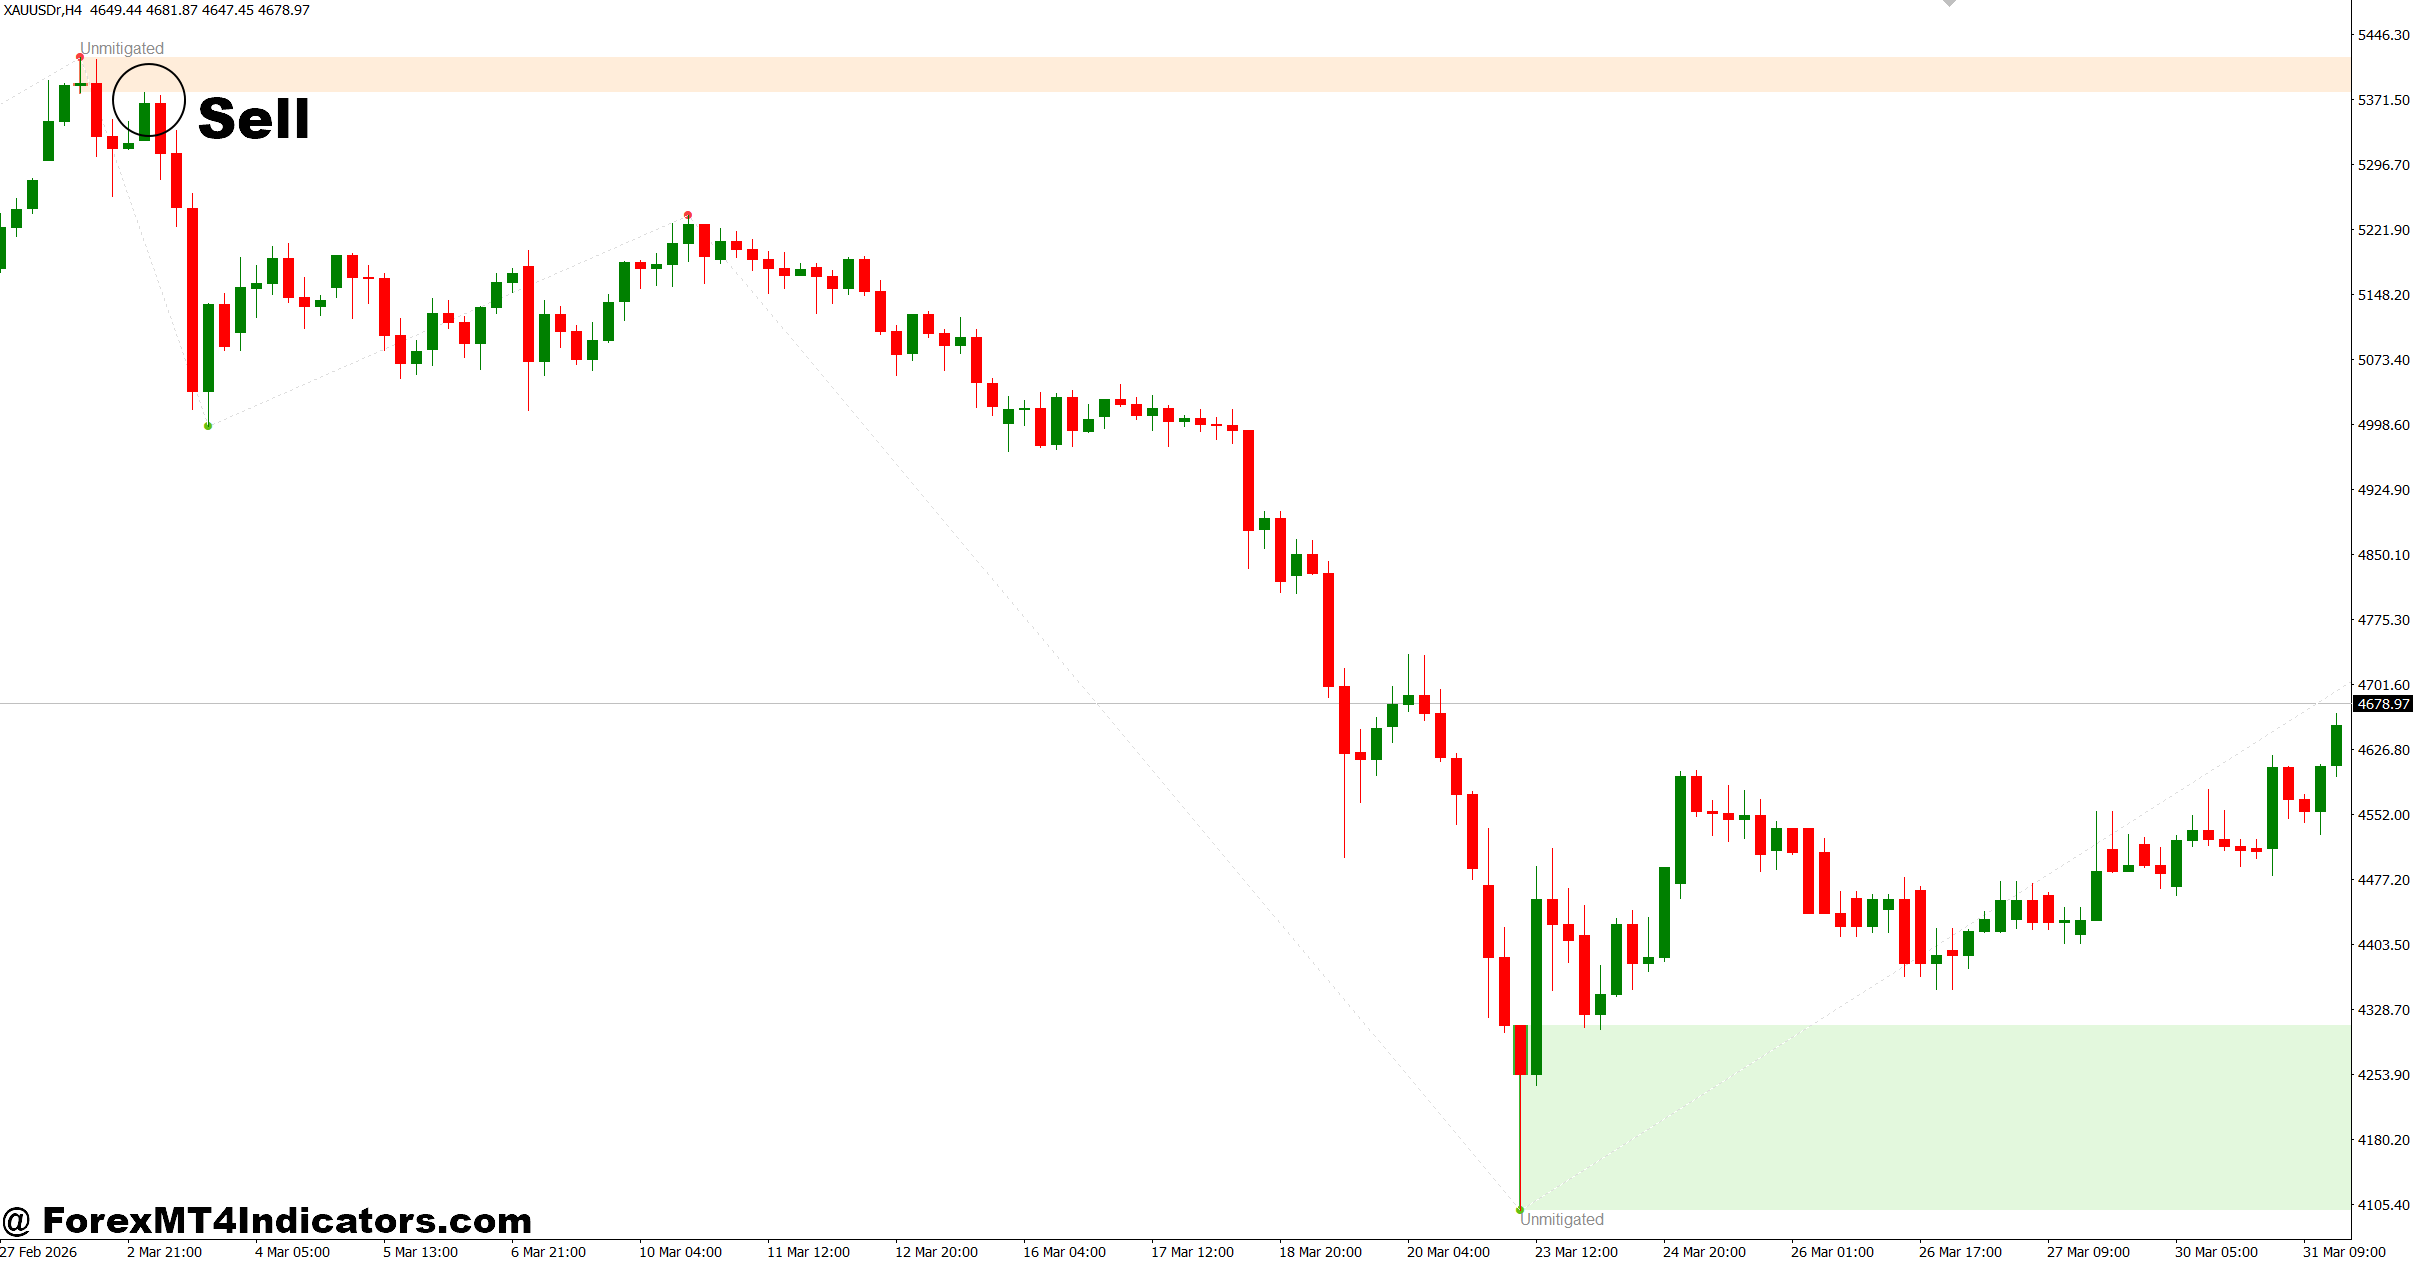
- Wait for a bearish order block – Sell after price retests a bearish zone and prints a bearish rejection candle.
- Confirm a lower low – Enter only after market structure shifts to the downside on the 1-hour chart.
- Trade with the main trend – Follow the 4-hour or daily bearish trend for higher-probability setups.
- Set a protective stop – Place the stop-loss 10-20 pips above the order block.
- Aim for nearby support – Take profits at the next support level or use a minimum 1:2 risk-to-reward ratio.
- Watch EUR/USD and GBP/USD – These pairs often respect bearish order blocks during active sessions.
- Skip weak pullbacks – Don’t sell if price enters the zone with low momentum or sideways movement.
- Avoid high-impact news – Stay out during NFP, CPI, or central bank announcements to reduce fake-outs.
Final Thoughts
The ICT Order Block Indicator MT4 gives traders another way to study institutional price behavior instead of relying only on lagging technical indicators. Its biggest strength comes from identifying areas where price has previously shown strong buying or selling interest. Traders should remember four key ideas: focus on market structure before entering, combine order blocks with confirmation signals, manage risk carefully using logical stop-loss placement, and accept that some setups will fail despite good analysis. Used with patience and proper testing, the ICT Order Block Indicator MT4 can become a valuable part of a broader trading strategy rather than the only reason to enter a trade.
Level up your trading Learn to read the chart — not just the indicator eBook · Instant PDF Video Course · 12 modules Trading forex and CFDs carries a significant risk of loss and is not suitable for everyone. Broker links are affiliate links — we may earn a commission at no cost to you.Recommended MT4/MT5 Brokers
Free MT4 Indicator Download

Enter Your Email Address below, download link will be sent to you.
