


The Non Repaint Binary Indicator MT4 is designed for traders who want signals that remain fixed after they appear. Instead of moving an old arrow when new price data arrives, a non-repainting approach aims to keep historical signals unchanged. That makes backtesting and chart review more meaningful.
Still, no indicator can remove market risk. The real value comes from combining the signal with price action, trend direction, support and resistance, and sensible money management. Here’s how traders can approach it in actual MT4 trading.
What Is the Non Repaint Binary Indicator MT4?
The Non Repaint Binary Indicator MT4 is a technical analysis tool that produces directional signals, commonly shown as buy and sell arrows or similar chart markers. Its main selling point is the attempt to prevent previous signals from shifting or disappearing after new candles form.
That distinction matters. Some indicators look excellent during historical chart review because their signals are recalculated using future price information. A trader may see a perfect buy arrow near the bottom of a move, only to discover that the arrow was not actually available at that time.
A genuine non-repainting method should calculate its signal from information available up to the relevant candle. Depending on the version, the logic may include moving-average direction, momentum, volatility, candle structure, or other price-based conditions.
For example, suppose EUR/USD trades around 1.0840 on the 1-hour chart. The indicator prints a buy signal when the candle closes at 1.0852. If the signal remains at 1.0852 while later candles move the pair to 1.0870, the historical signal has remained stable.
That does not make the signal correct. It simply makes the historical result more representative of what a trader could have seen at the time.
How the Indicator Generates Trading Signals
The exact formula depends on the specific version of the indicator. Traders should therefore check its inputs or documentation instead of assuming every MT4 non-repaint indicator uses the same calculation.
A common structure is based on several conditions working together. Trend direction can come from an EMA, momentum can be measured through RSI or another oscillator, and volatility can help filter weak movements. The indicator then displays a signal when enough conditions agree.
Consider EUR/USD on H1. A bullish setup might require price to remain above a 50-period EMA while momentum moves above a neutral level. If a bullish candle also closes beyond a nearby resistance level, the indicator could confirm the setup.
The timing of the candle matters. A trader should avoid treating an arrow that appears during an unfinished candle as a guaranteed entry. Waiting for the candle to close can reduce the chance of acting on an intrabar move that later disappears.
This is also where market structure becomes useful. A buy signal below a strong resistance zone deserves more caution than one appearing after price breaks resistance and retests it successfully.
Practical Trading Examples
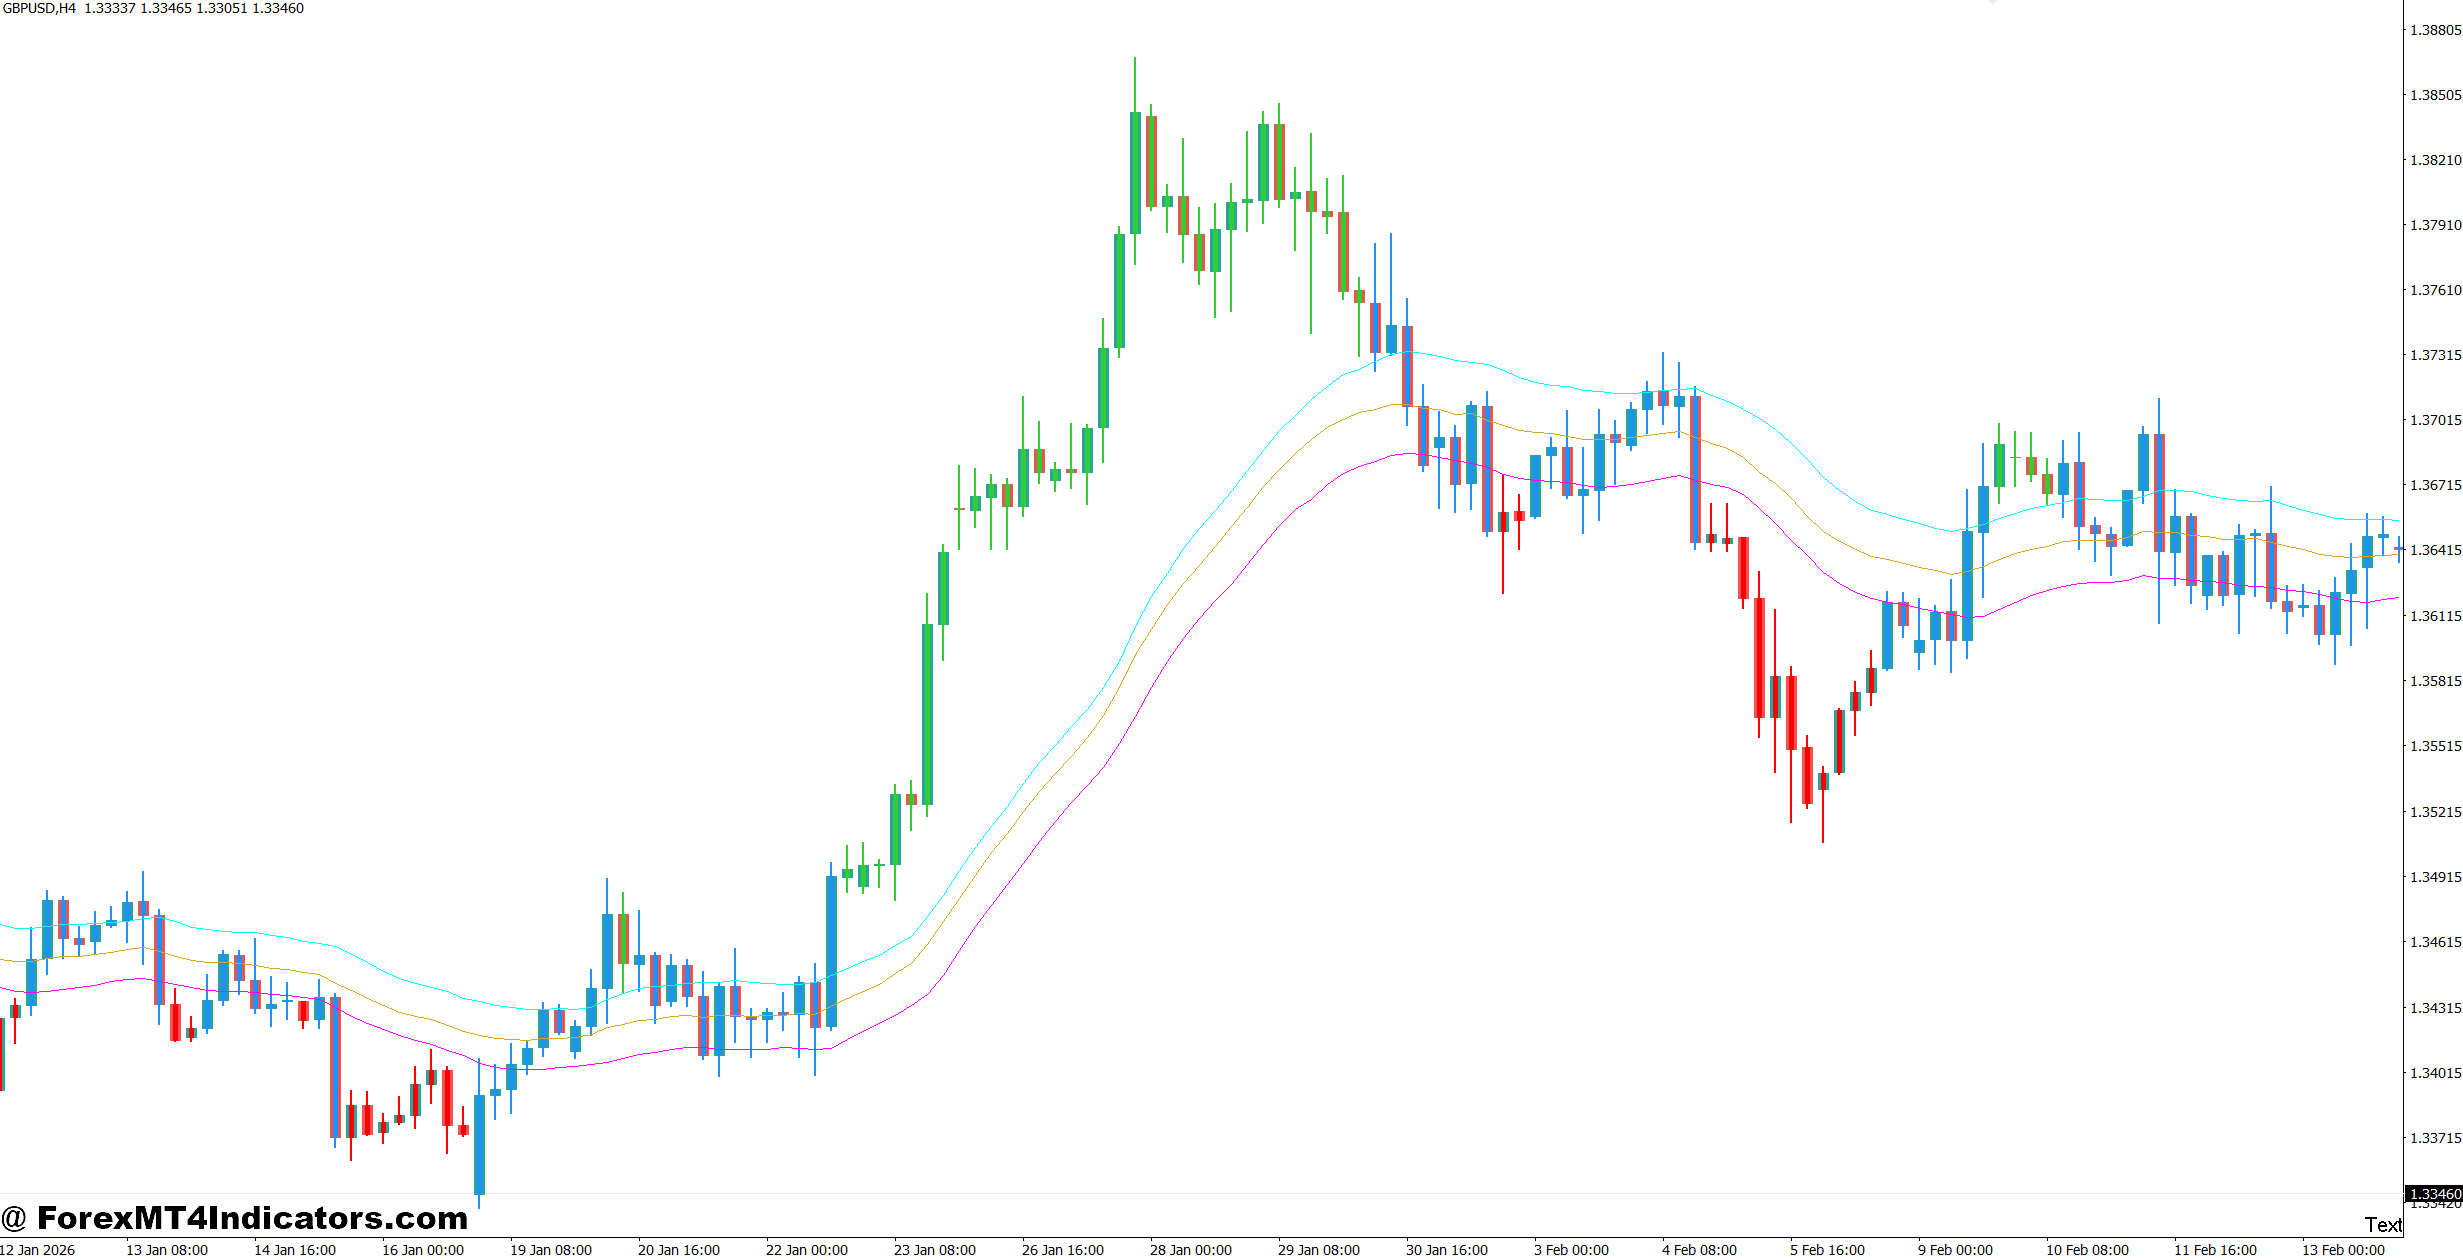
EUR/USD H1 Trend Setup
Imagine EUR/USD has been making higher highs and higher lows throughout the London session. Price pulls back toward a previous support area near 1.0860, then forms a bullish H1 candle.
The indicator prints a buy signal after the candle closes at 1.0870. A trader could place an entry near 1.0870–1.0872, depending on spread and execution.
A stop-loss around 15–25 pips below the recent swing low may be reasonable for the example, provided that level fits the actual market structure. A target of 30–50 pips would provide roughly a 1:2 risk-to-reward setup if the stop were 20 pips.
The key point is that the arrow isn’t trading alone. Trend, support, candle confirmation, and risk-to-reward all support the decision.
GBP/USD During a Volatile Session
GBP/USD can move sharply around major economic releases. Suppose an H1 sell signal appears just before a high-impact U.S. employment report. Entering immediately could expose the position to a sudden 30–60 pip spike.
An experienced trader may wait until the news volatility settles. If GBP/USD then breaks a support level and retests it from below, the original signal has stronger context.
When testing this type of setup on NFP days, traders should expect wider spreads and fast price movement. A signal that works reasonably well during normal sessions may perform poorly during major announcements.
Settings for Different Timeframes and Pairs
There is no single setting that fits every currency pair. A configuration that produces useful signals on EUR/USD H1 may generate too many entries on GBP/JPY M15.
For lower timeframes, traders often need stronger filters because market noise increases. On M5 or M15, a trader might require a signal to agree with the direction of a 50- or 100-period moving average and avoid entries when the spread expands.
On H1 and H4, signals usually develop more slowly. A trader can give greater weight to support and resistance, previous swing highs and lows, and the broader trend.
For example:
- EUR/USD H1: a 15–30 pip stop can suit some setups, depending on volatility.
- GBP/USD H1: 20–40 pips may be more realistic during active sessions.
- XAU/USD H1: fixed forex-style stops can be unsuitable because gold often moves much farther within a single candle.
- M5 charts: traders should use smaller position sizes and expect more false signals.
These figures are examples, not fixed rules. The stop should sit beyond a logical invalidation point rather than at an arbitrary number.
Advantages, Limitations, and Comparison
The biggest advantage of a non-repainting indicator is cleaner historical analysis. Traders can review old signals without wondering whether the indicator changed them later. This makes manual testing more useful.
It can also help with trade timing. Instead of entering solely because an oscillator reaches an extreme level, a trader can wait for a confirmed directional signal and then compare it with the market structure.
But there are clear limitations. Non-repainting does not mean high accuracy. Signals can still fail during sideways markets, sudden news events, liquidity gaps, or sharp reversals.
Compared with a basic moving-average crossover, a binary-style signal can be easier to read because the trader receives a direct directional marker. The moving-average crossover, however, shows the underlying trend relationship more clearly and may provide better context.
Compared with RSI, the indicator may offer more direct entry signals, while RSI gives traders useful information about momentum and overbought or oversold conditions.
A practical approach is to combine tools rather than expect one indicator to make every decision. For instance, the indicator can provide the entry trigger, while an EMA defines trend direction and support/resistance determines whether the trade has enough room to develop.
Trading forex carries substantial risk. No indicator guarantees profits. Traders should test any Non Repaint Binary Indicator MT4 setup on historical data and a demo account before risking real capital. Position size should remain small enough that several losing trades do not seriously damage the account.
How to Trade with Non Repaint Binary Indicator MT4
Buy Entry
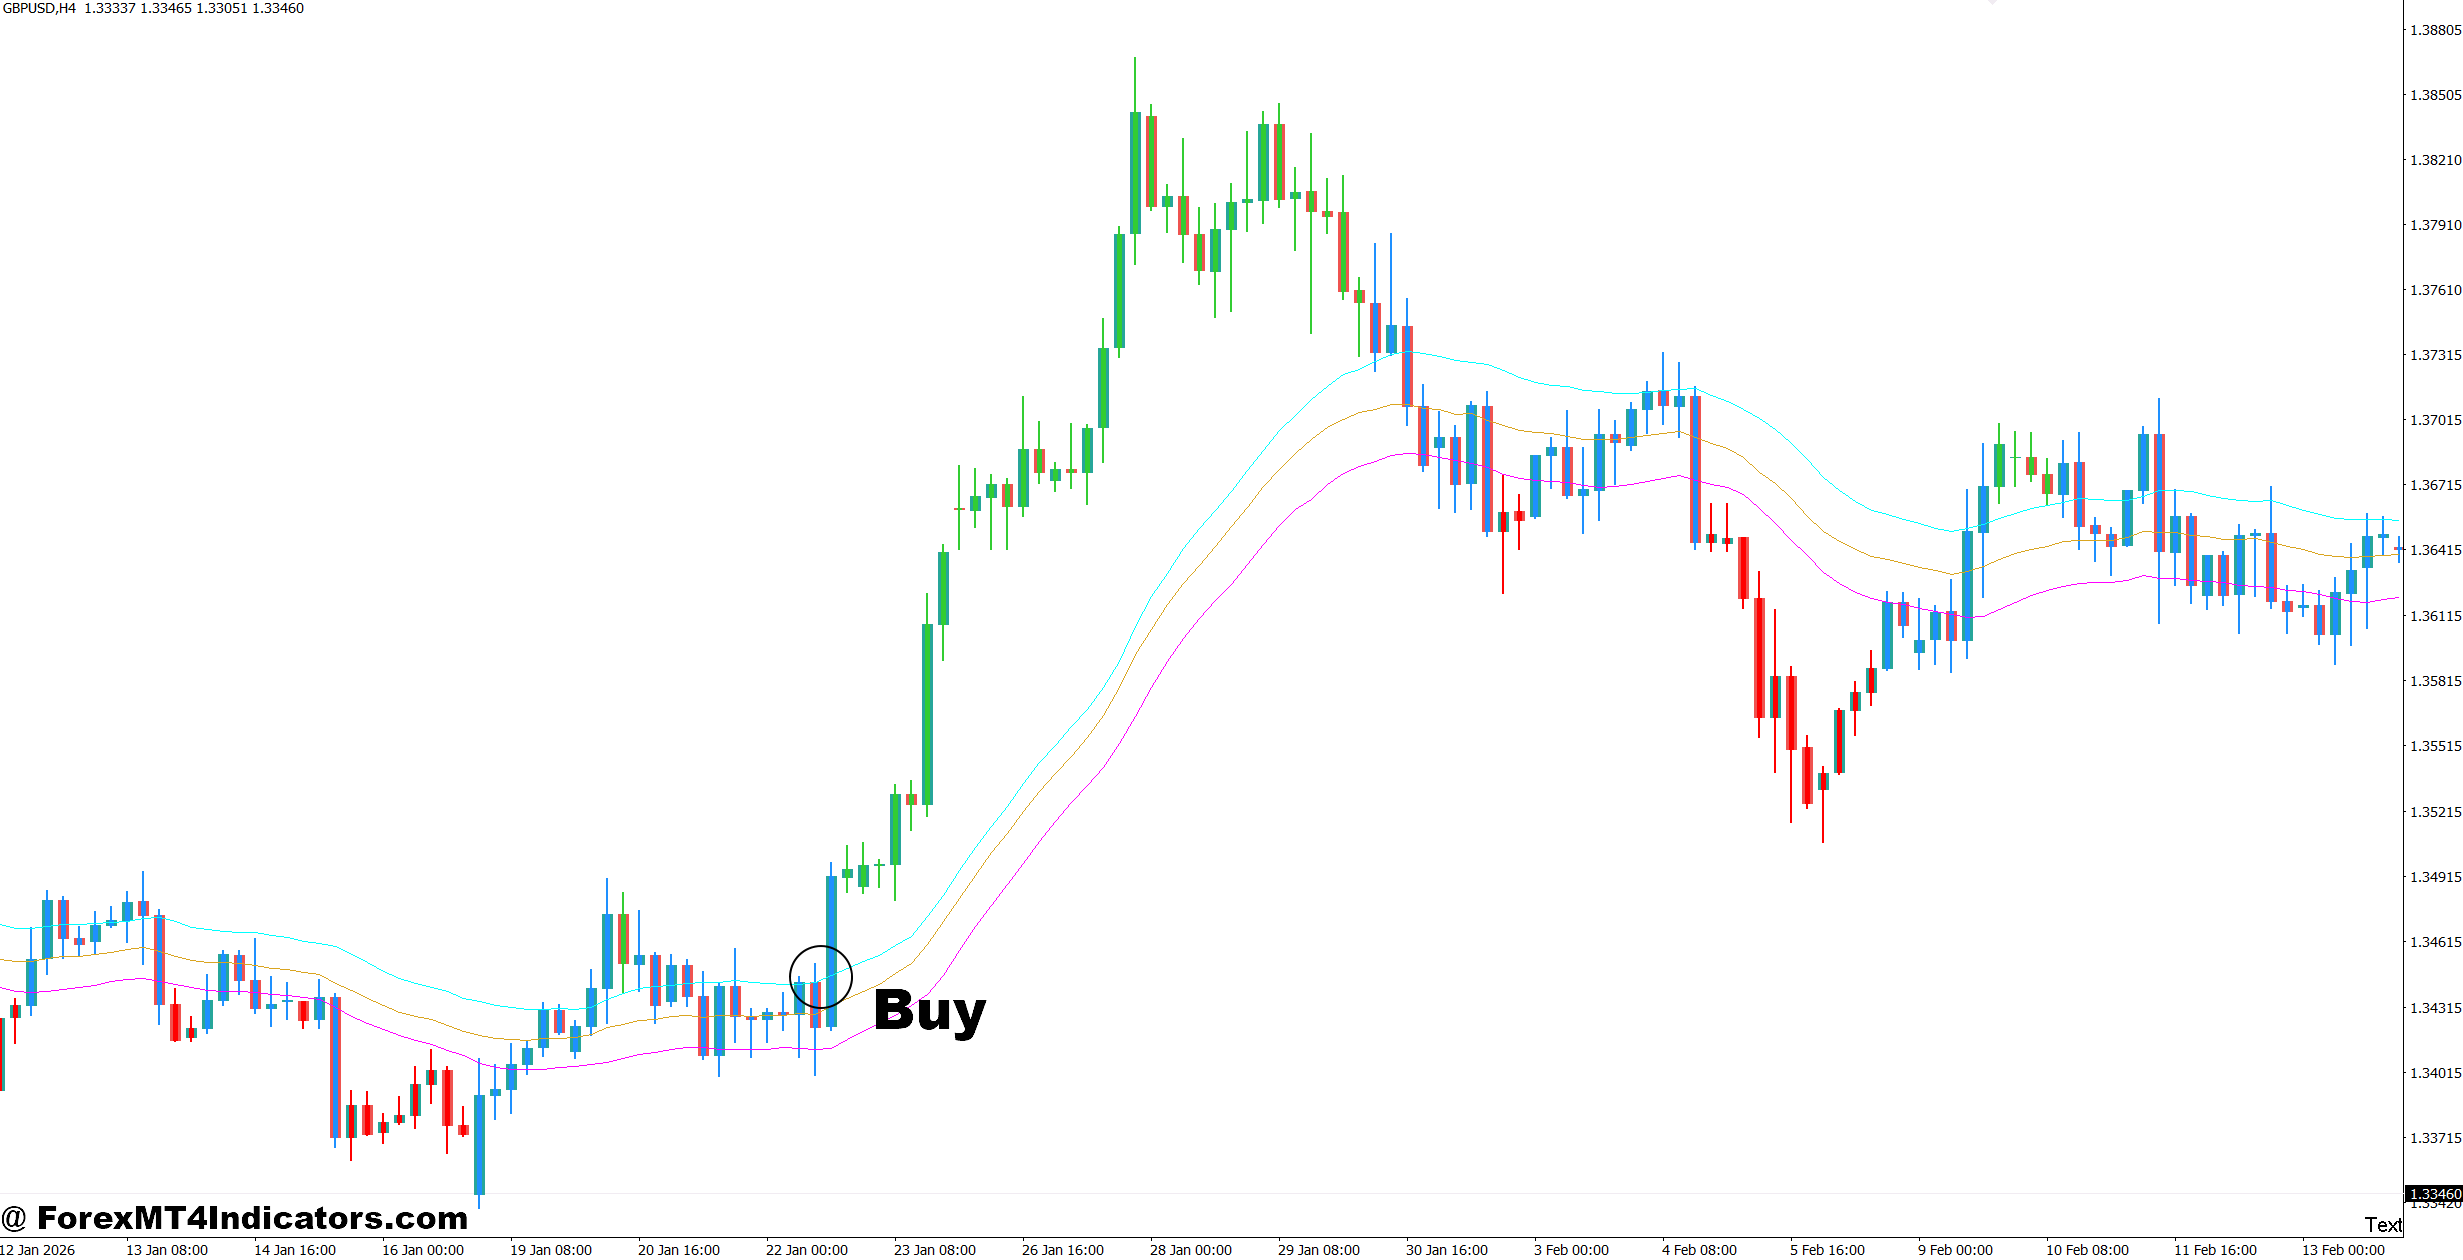
- Wait for a confirmed buy arrow – Enter after the H1 candle closes with the signal; avoid entering mid-candle.
- Check the H1 trend – Buy EUR/USD when price stays above the 50 EMA and the indicator confirms bullish momentum.
- Target 20–40 pips – For EUR/USD, consider a 20–25 pip stop and aim for at least 40 pips when structure supports it.
- Confirm support – Take a buy when the signal forms within 10–15 pips of a proven H1 support zone.
- Use H4 confirmation – On GBP/USD, prefer H1 buy signals when the H4 structure shows higher highs and higher lows.
- Reduce risk after strong moves – After a 30+ pip move, avoid chasing; wait for a pullback and fresh signal.
- Risk only 1% per trade – Keep account exposure near 1% and reduce position size when the stop needs to be wider.
- Skip major news entries – Avoid new buys 10–15 minutes before high-impact events such as NFP or major central-bank decisions.
Sell Entry
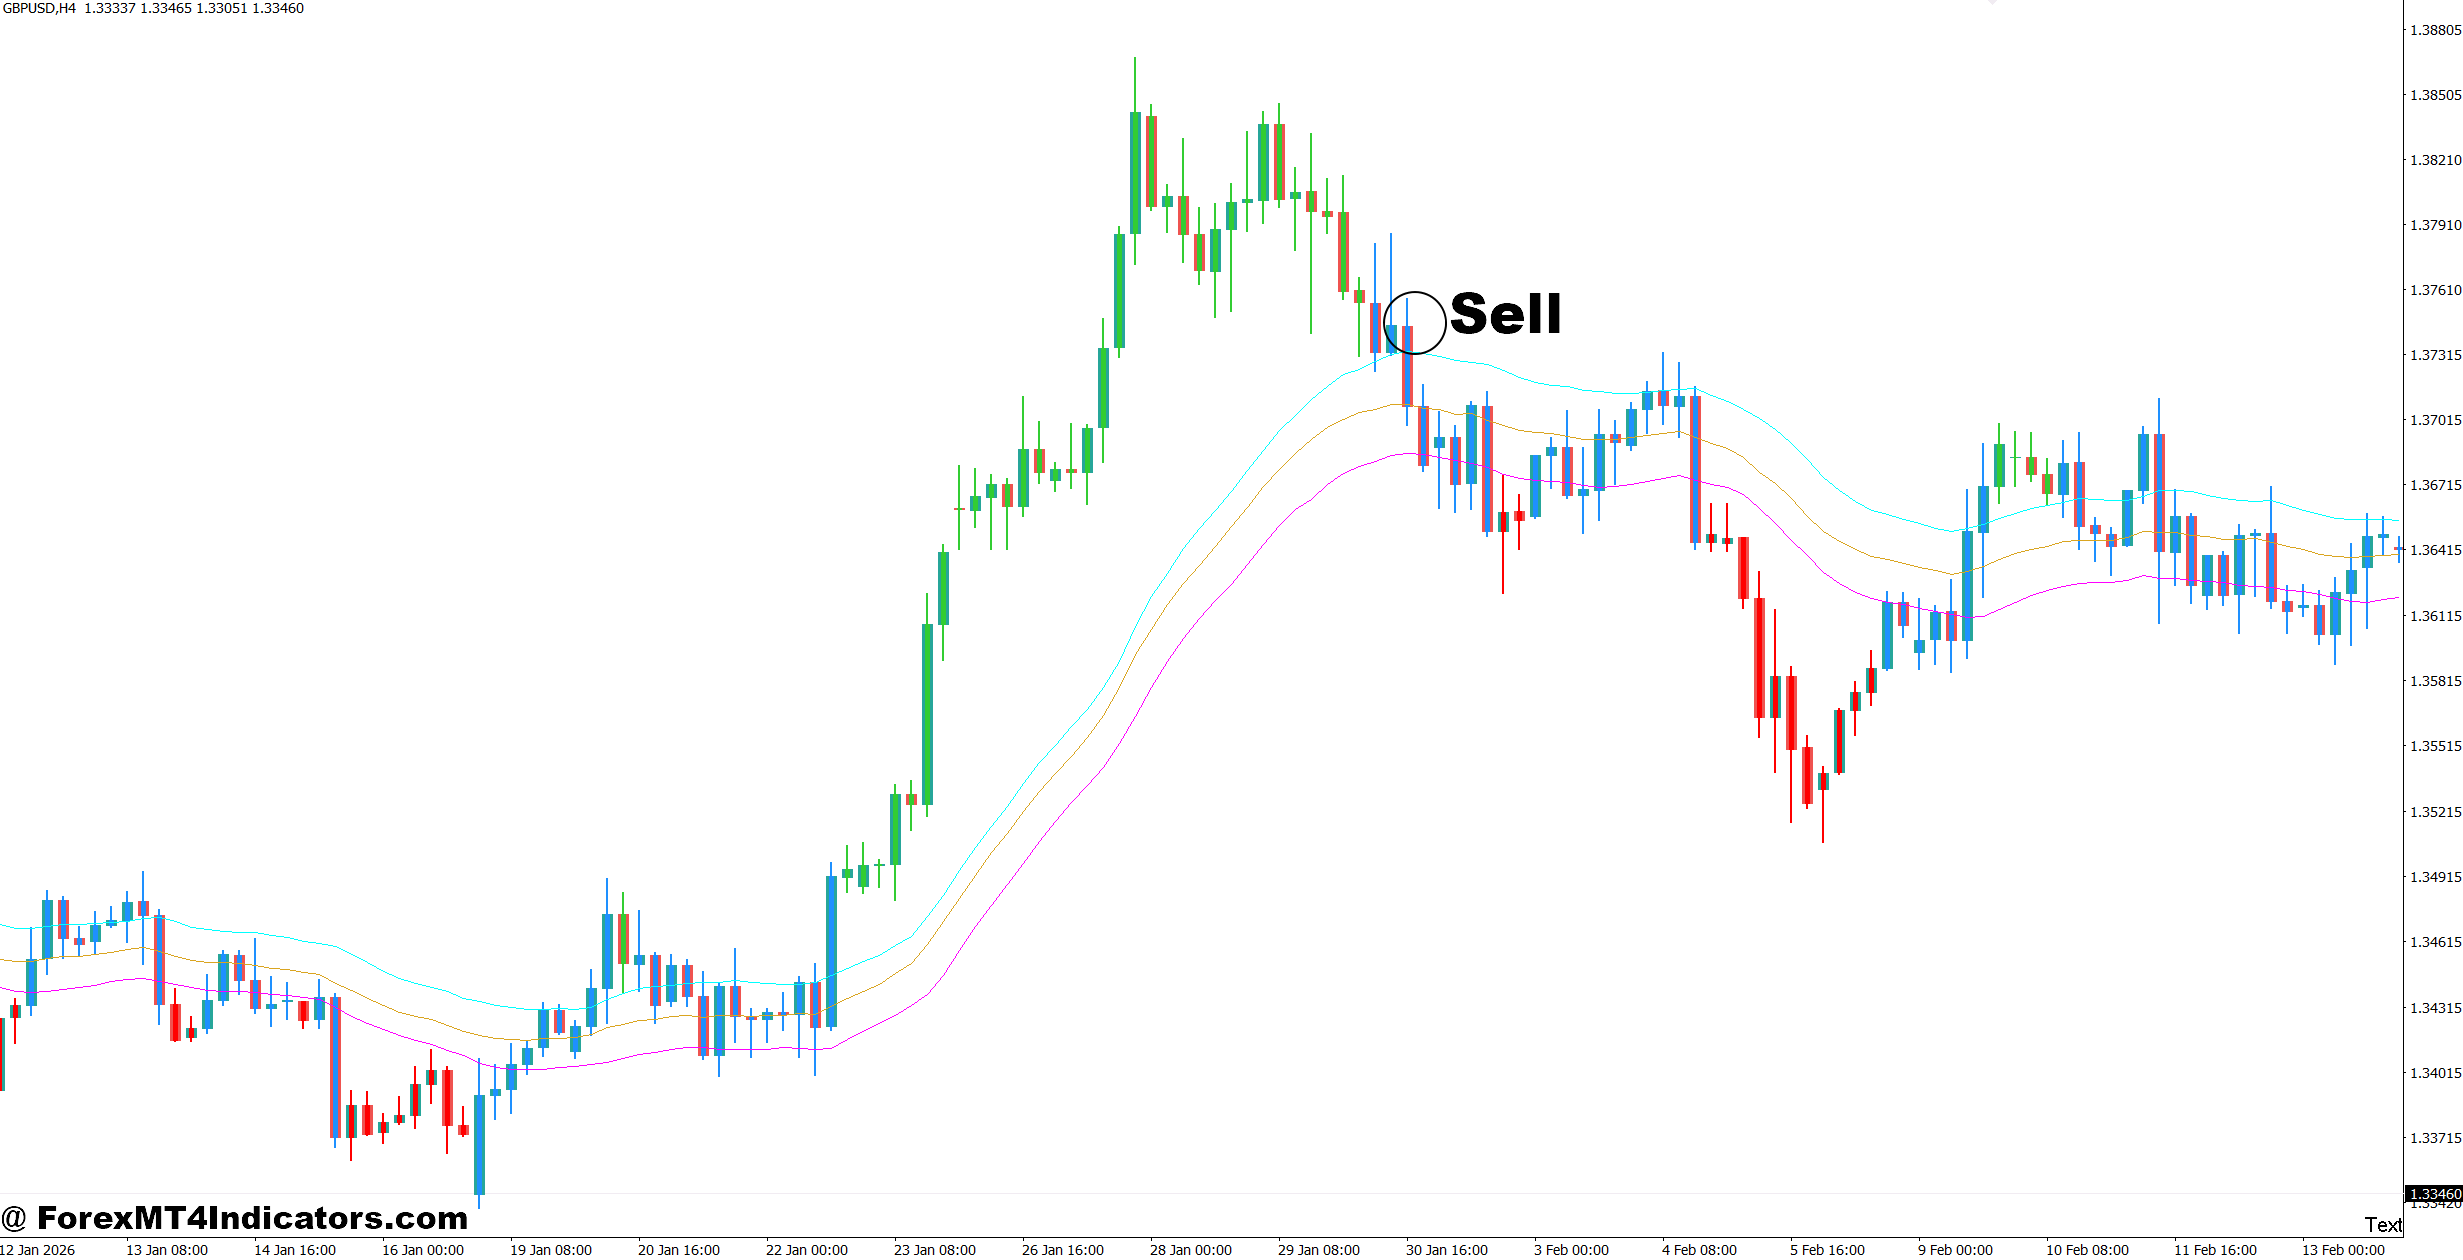
- Wait for a confirmed sell arrow – Sell after the H1 candle closes below the signal level instead of reacting to an unfinished candle.
- Follow bearish structure – On EUR/USD H1, favor sells when price remains below the 50 EMA and forms lower highs.
- Set a 20–30 pip stop – For GBP/USD H1, place the stop beyond the recent swing high and target roughly 40–60 pips when conditions allow.
- Confirm resistance – Consider a sell when the signal appears within 10–20 pips of strong H1 or H4 resistance.
- Use daily direction – Prefer H1 sell signals when the daily chart shows a clear bearish trend rather than sideways price action.
- Avoid late entries – Don’t sell after a 40–50 pip drop without a pullback; wait for a new setup.
- Keep risk below 1% – Use smaller position sizes when volatility expands or the required stop exceeds 30 pips.
- Skip choppy markets – Avoid sell arrows during tight 10–20 pip ranges where repeated signals can produce whipsaws.
Final Thoughts on the Non Repaint Binary Indicator MT4
The Non Repaint Binary Indicator MT4 can be useful for traders who want stable historical signals and a straightforward way to identify possible entries. Its strongest feature is not that it predicts every market move, but that a properly designed non-repainting signal should provide a more honest basis for chart review.
Three points matter most: confirm signals after candle close, check the surrounding market structure, and control risk on every trade. A 40-pip target means little if the setup risks 60 pips.
The indicator works best as part of a trading method rather than as a standalone decision maker. Traders who test it across different pairs, sessions, and market conditions will have a much clearer idea of where it fits their strategy.
Level up your trading
Learn to read the chart — not just the indicator
eBook · Instant PDF
Video Course · 12 modules
Recommended MT4/MT5 Brokers
- ✓ *FREE *$50 to start (withdrawable)
- ✓ Deposit bonus up to $5,000
- ✓ Negative balance protection
Trading forex and CFDs carries a significant risk of loss and is not suitable for everyone. Broker links are affiliate links — we may earn a commission at no cost to you.
Free MT4 Indicator Download

Enter Your Email Address below, download link will be sent to you.
