


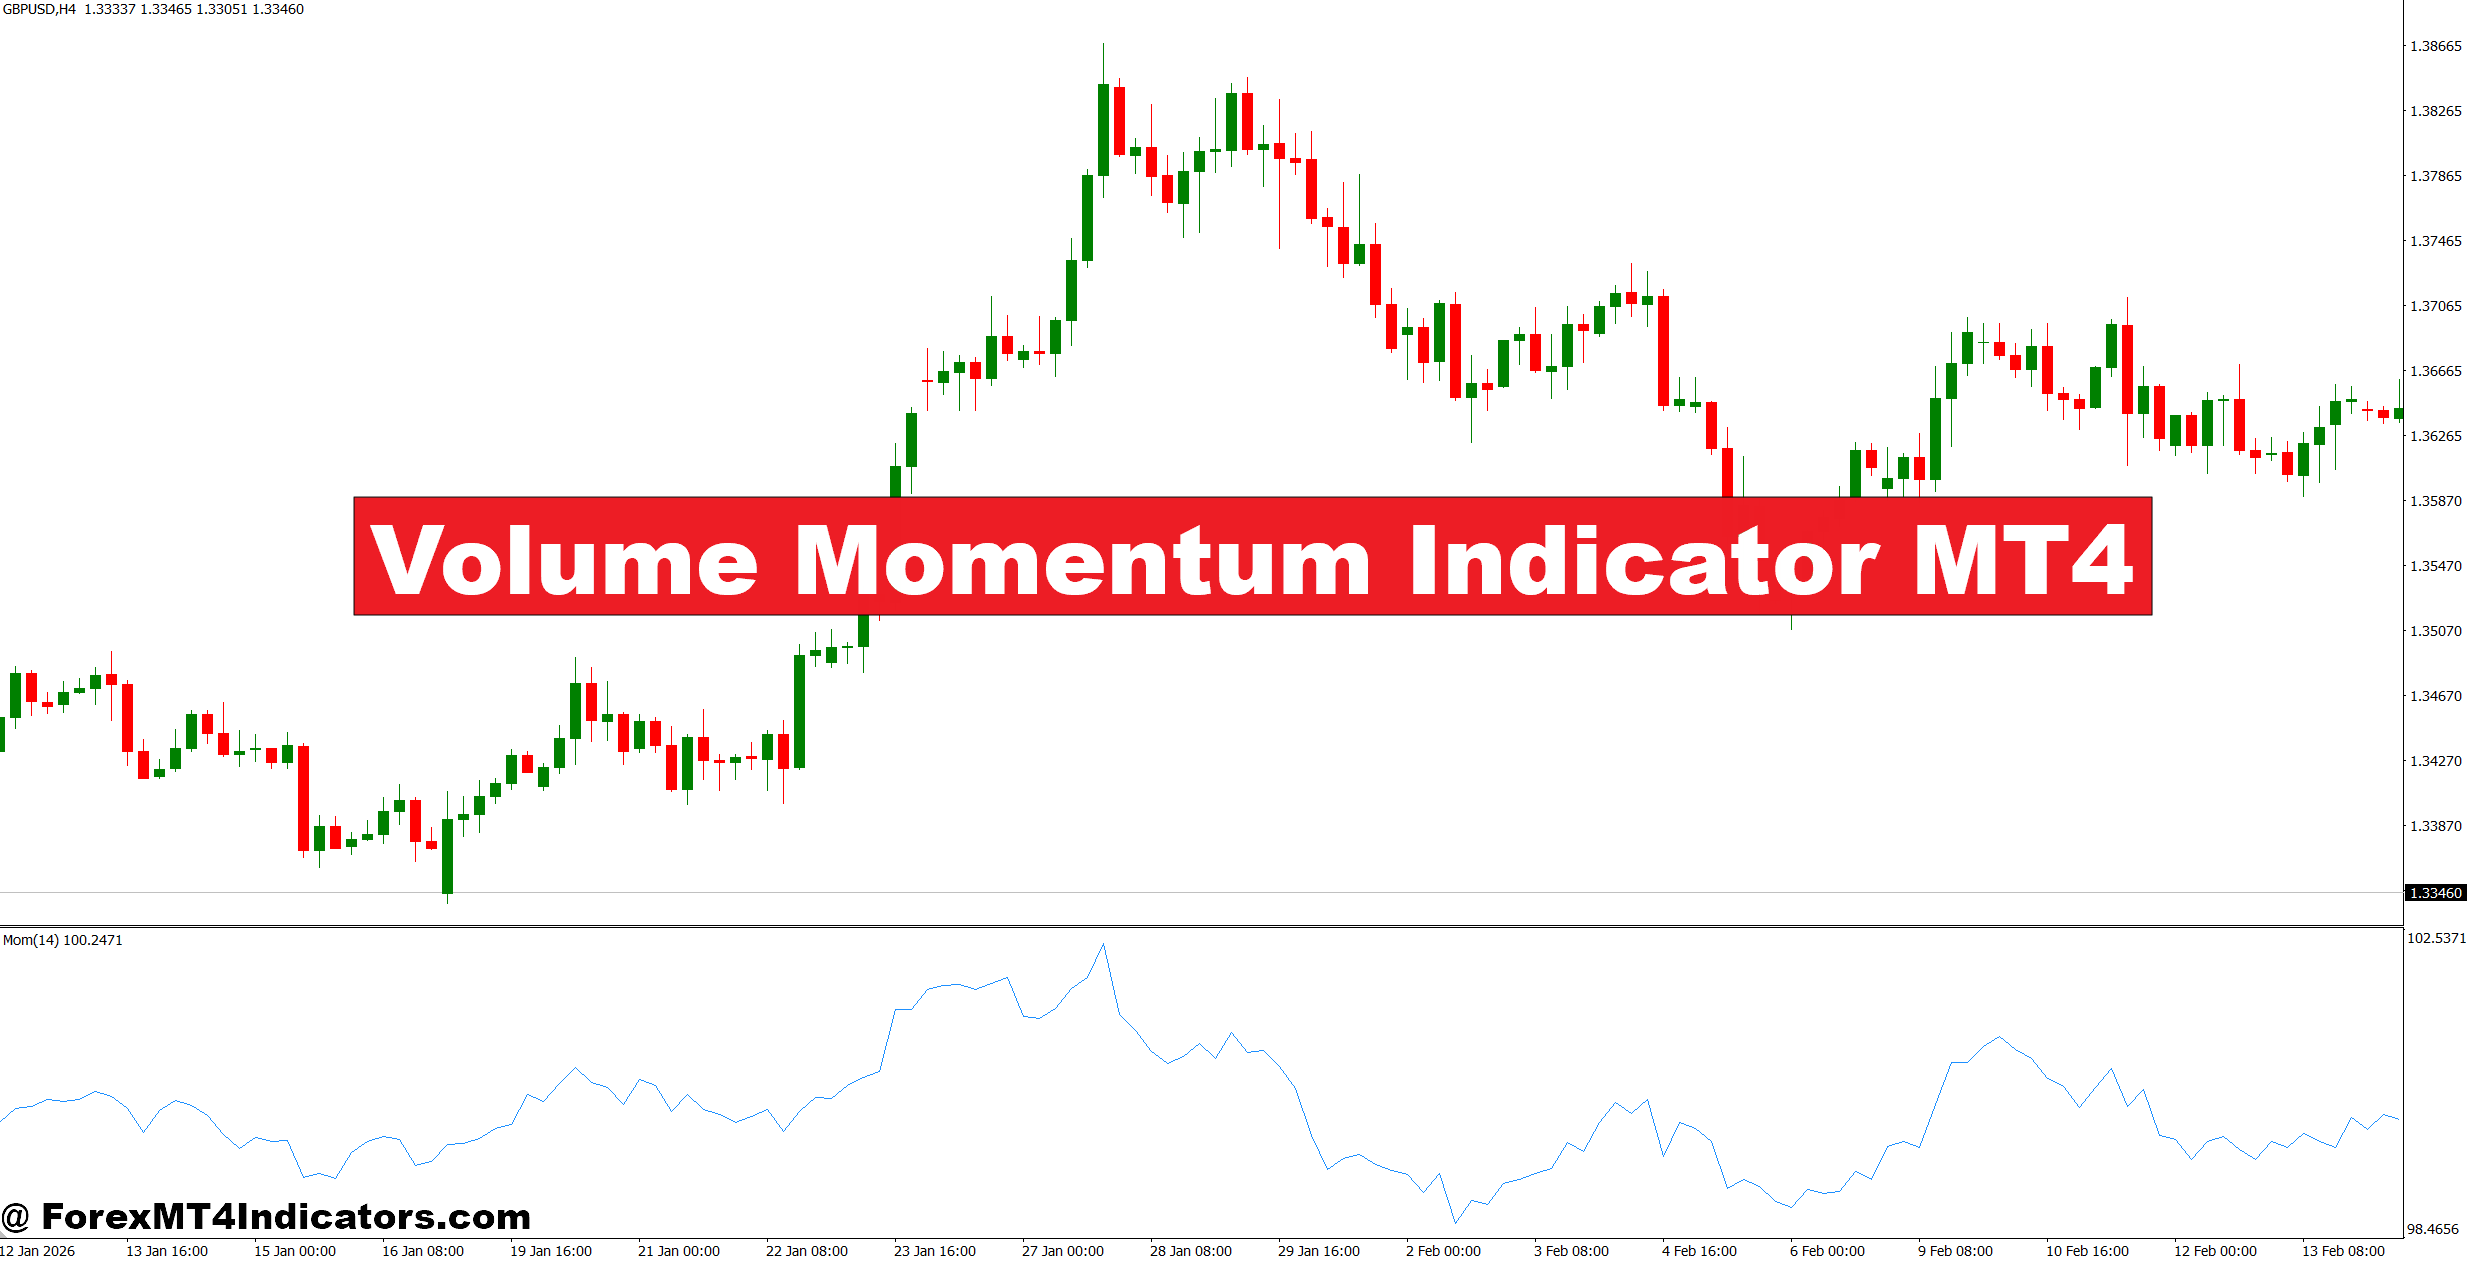
The Volume Momentum Indicator MT4 is a technical analysis tool designed to compare market activity with the direction and strength of price movement. On MetaTrader 4, forex volume is normally represented by tick volume, which measures how many price changes occur during a selected period rather than the actual number of contracts traded.
The indicator typically processes volume and price-change data over a chosen lookback period. Depending on the specific version, the calculation may use a momentum formula, volume weighting, smoothing, or a combination of these methods. Traders should check the indicator’s source or settings because different MT4 versions can produce different readings.
The basic idea is straightforward. When price rises while volume and momentum also increase, buyers have stronger confirmation behind the move. If price continues rising but momentum or volume starts falling, the trend may be losing participation.
For example, EUR/USD might rise from 1.0820 to 1.0865 while the indicator climbs above its recent average. That combination gives a trader more reason to watch for bullish continuation. If EUR/USD reaches 1.0865 while the indicator makes a lower peak, caution makes more sense.
How Traders Can Read Volume and Momentum Together
A useful way to approach the indicator is to treat it as confirmation rather than a buy-or-sell button.
Bullish momentum
Suppose GBP/USD is trading around 1.2710 on the 1-hour chart. Price has been making higher lows and then breaks resistance at 1.2740. The indicator also moves above its recent zero or baseline area and shows a clear expansion in momentum.
A trader could wait for the breakout candle to close rather than entering during the initial spike. If price retests 1.2740 and holds, a long entry around 1.2745 may offer a cleaner setup. A stop 20–30 pips below the retest zone could then be considered, depending on recent volatility.
The key is the relationship between the readings. Strong price movement with expanding activity is generally more useful than a large price candle with declining participation.
Bearish momentum
The same principle applies to short trades. Imagine USD/JPY trading near 151.80 and repeatedly failing around 152.00. Price finally breaks 151.60, while the volume momentum reading falls sharply below its recent range.
Rather than selling simply because the histogram turned negative, traders can wait for a candle close below 151.60 and a failed retest. A setup around 151.55 could use a 25–35 pip protective stop, with the first target near 151.00 if market structure supports that distance.
This extra confirmation can help reduce entries during short-lived fake-outs.
Settings for Different Forex Timeframes
There isn’t one perfect setting for every pair. A 5-minute chart behaves very differently from a 4-hour chart, so traders should adjust the lookback and smoothing according to market conditions.
On M5, a shorter setting such as 10–14 periods can make the indicator react quickly to changes in activity. The downside is noise. During the London open, several readings can flip direction within minutes.
On the 1-hour chart, 14–20 periods can provide a more balanced view. For example, a trader watching EUR/USD may use a 14-period calculation and compare the current reading with the previous 10–20 candles rather than reacting to every small change.
On H4, slower settings such as 20–30 periods can help filter minor fluctuations. This is useful when traders are looking for moves lasting several days instead of several hours.
Pairs matter too. GBP/JPY can produce much larger intraday swings than EUR/USD. A fixed 20-pip stop that works on EUR/USD may be far too tight for GBP/JPY. The indicator should therefore be combined with ATR, recent swing highs and lows, or another volatility measure when determining risk.
Practical Trading Setup: Confirmation Around Key Levels
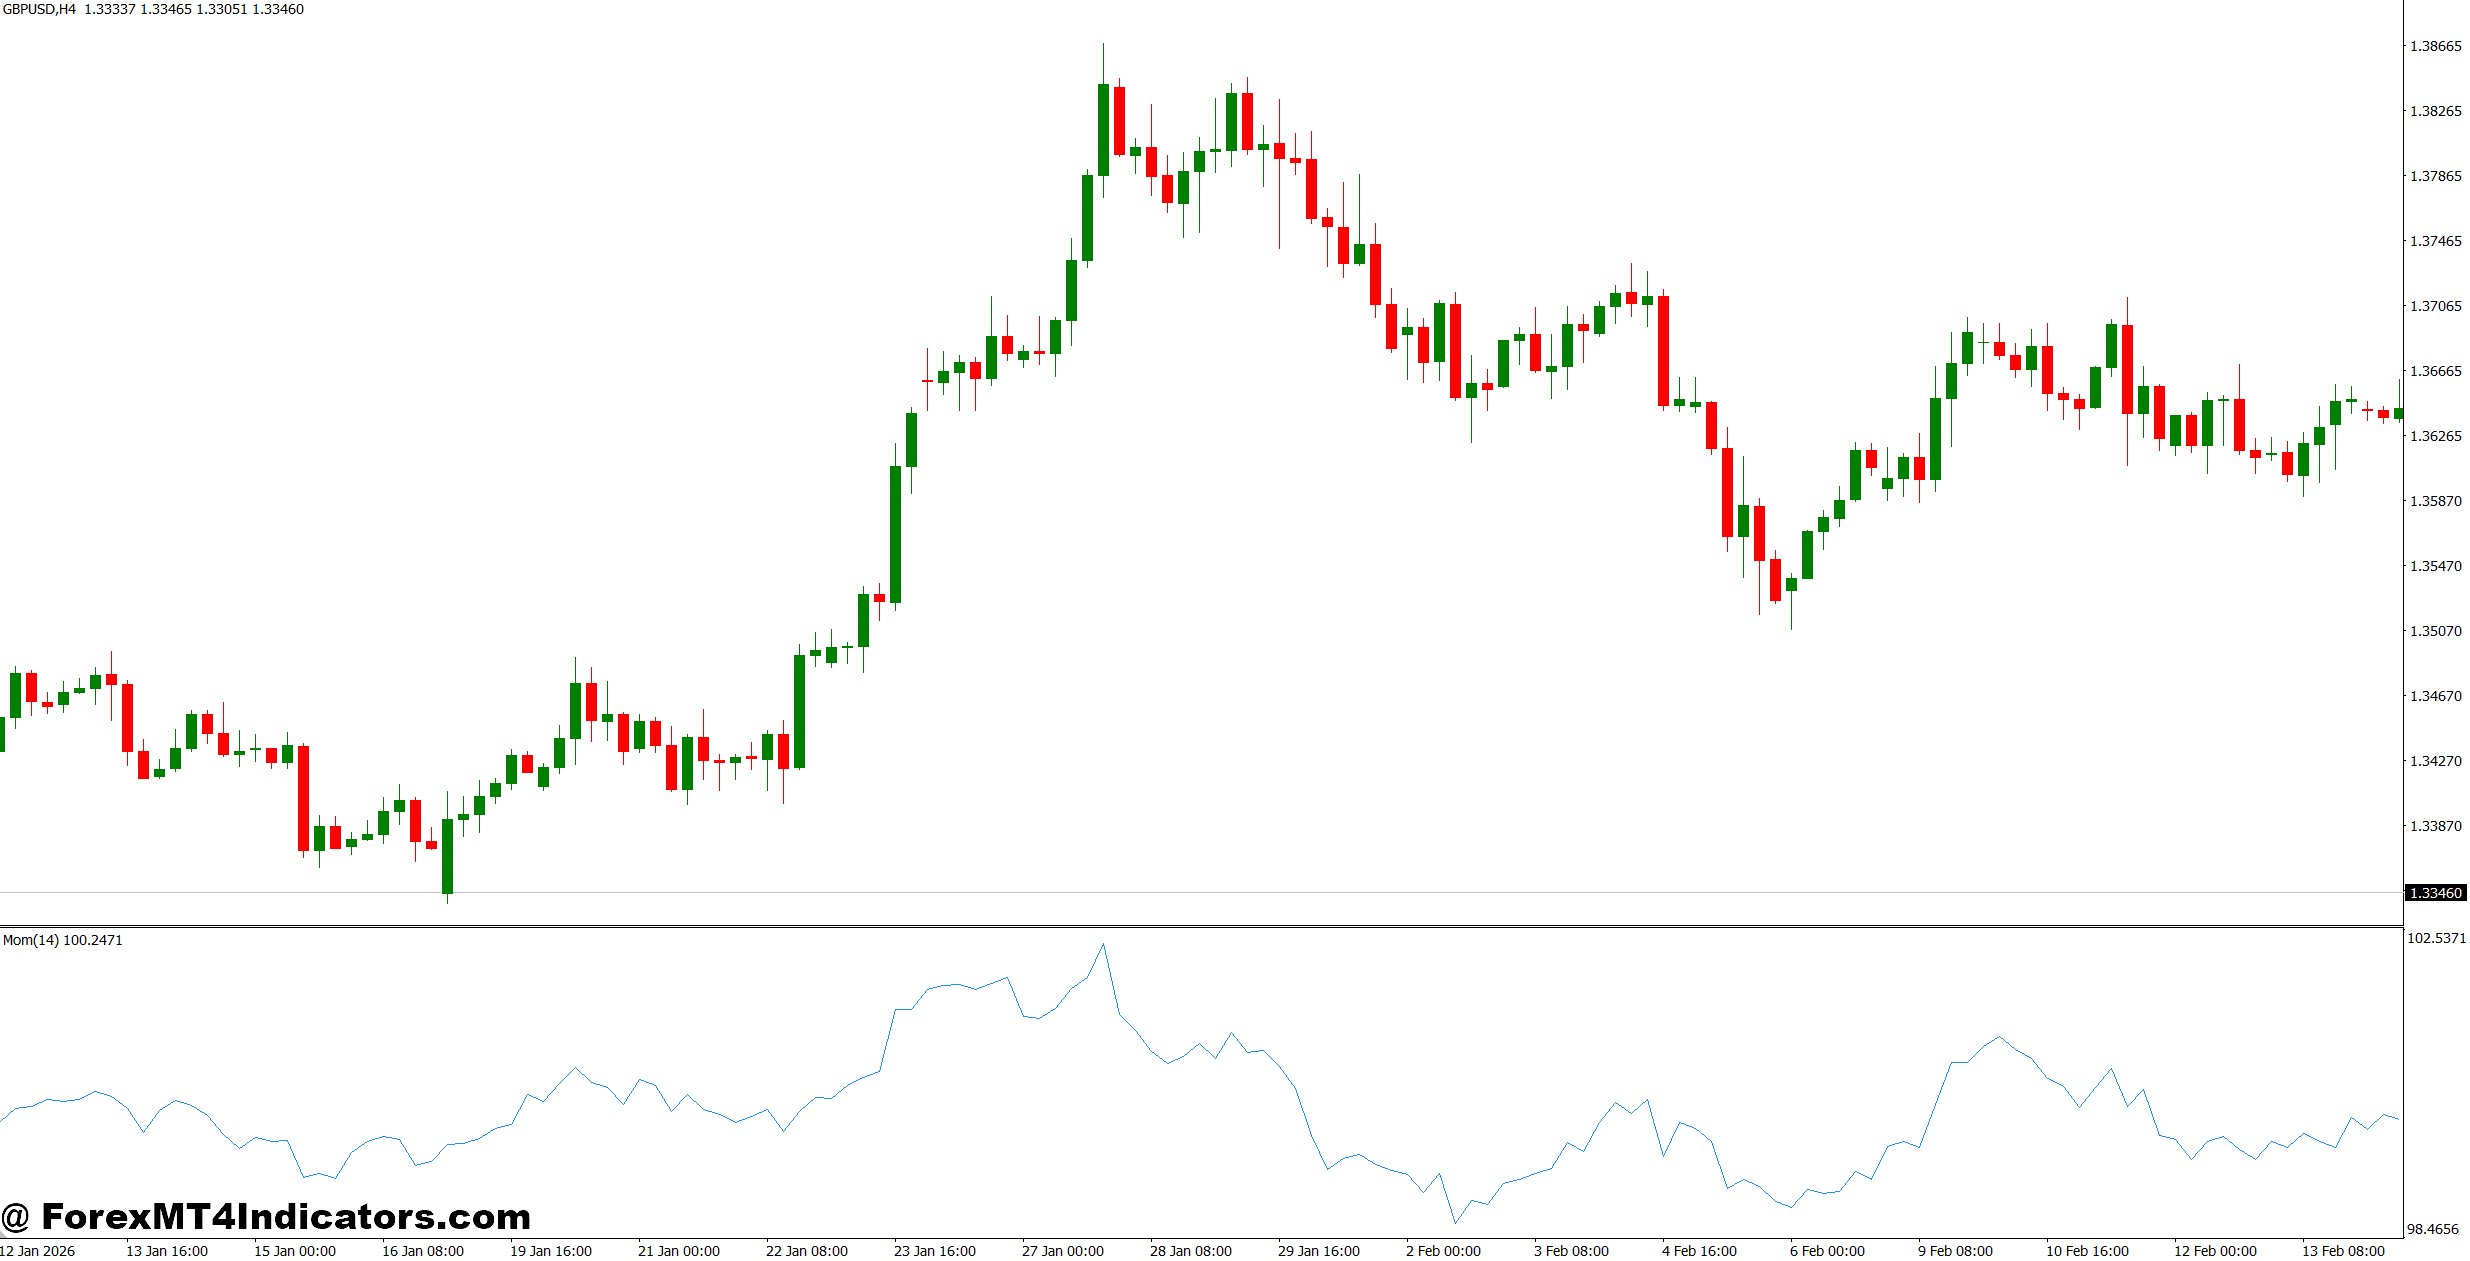
One of the better uses for volume momentum is around established support and resistance.
Consider gold, although it isn’t a forex pair, trading near a daily resistance level at $2,480. Price pushes above the level by $6 but the volume momentum reading fails to reach its previous high. The breakout then closes back below $2,480.
That is a warning sign. A trader could wait for a bearish candle below $2,475 before considering a short, with the stop above the failed breakout high. The indicator doesn’t create the setup; price structure creates it, while momentum and volume help assess its quality.
The same approach works on EUR/USD. If resistance sits at 1.0900 and price breaks to 1.0920 with strong momentum, a continuation setup may be worth watching. If price reaches 1.0920 but the indicator shows noticeably weaker momentum than during the first breakout attempt, traders should be more selective.
When testing volume-based setups around volatile NFP releases, traders should be especially careful. Tick volume can surge dramatically as spreads widen and prices jump. A huge reading doesn’t automatically mean the new trend will continue.
Strengths, Limitations, and Similar Indicators
The main advantage is that the indicator adds a second layer of information beyond price. Traders can compare momentum expansion, declining participation, and divergence with actual market structure. This can be useful when deciding whether a breakout deserves attention.
But there are limitations. MT4 forex volume is tick volume, not centralized exchange volume. Different brokers can therefore produce somewhat different readings. The indicator also reacts to existing price activity; it doesn’t predict unexpected news or central-bank decisions.
Compared with the 14-period RSI, volume momentum can provide more direct information about participation alongside price movement. RSI mainly measures the speed and size of recent price changes and can remain overbought during a strong trend.
Compared with MACD, the volume-based approach adds activity information that MACD doesn’t directly measure. MACD is often useful for trend and momentum confirmation, while volume momentum can help determine whether the current move has meaningful participation.
Compared with standard volume indicators, a momentum-based version focuses more on the relationship between activity and directional price movement. That distinction can make it useful during breakouts and trend continuation setups.
Still, no single reading should override price action. If the indicator is bullish but price is sitting directly below major weekly resistance, a trader may have little reason to chase the move.
How to Trade with Volume Momentum Indicator MT4
Buy Entry
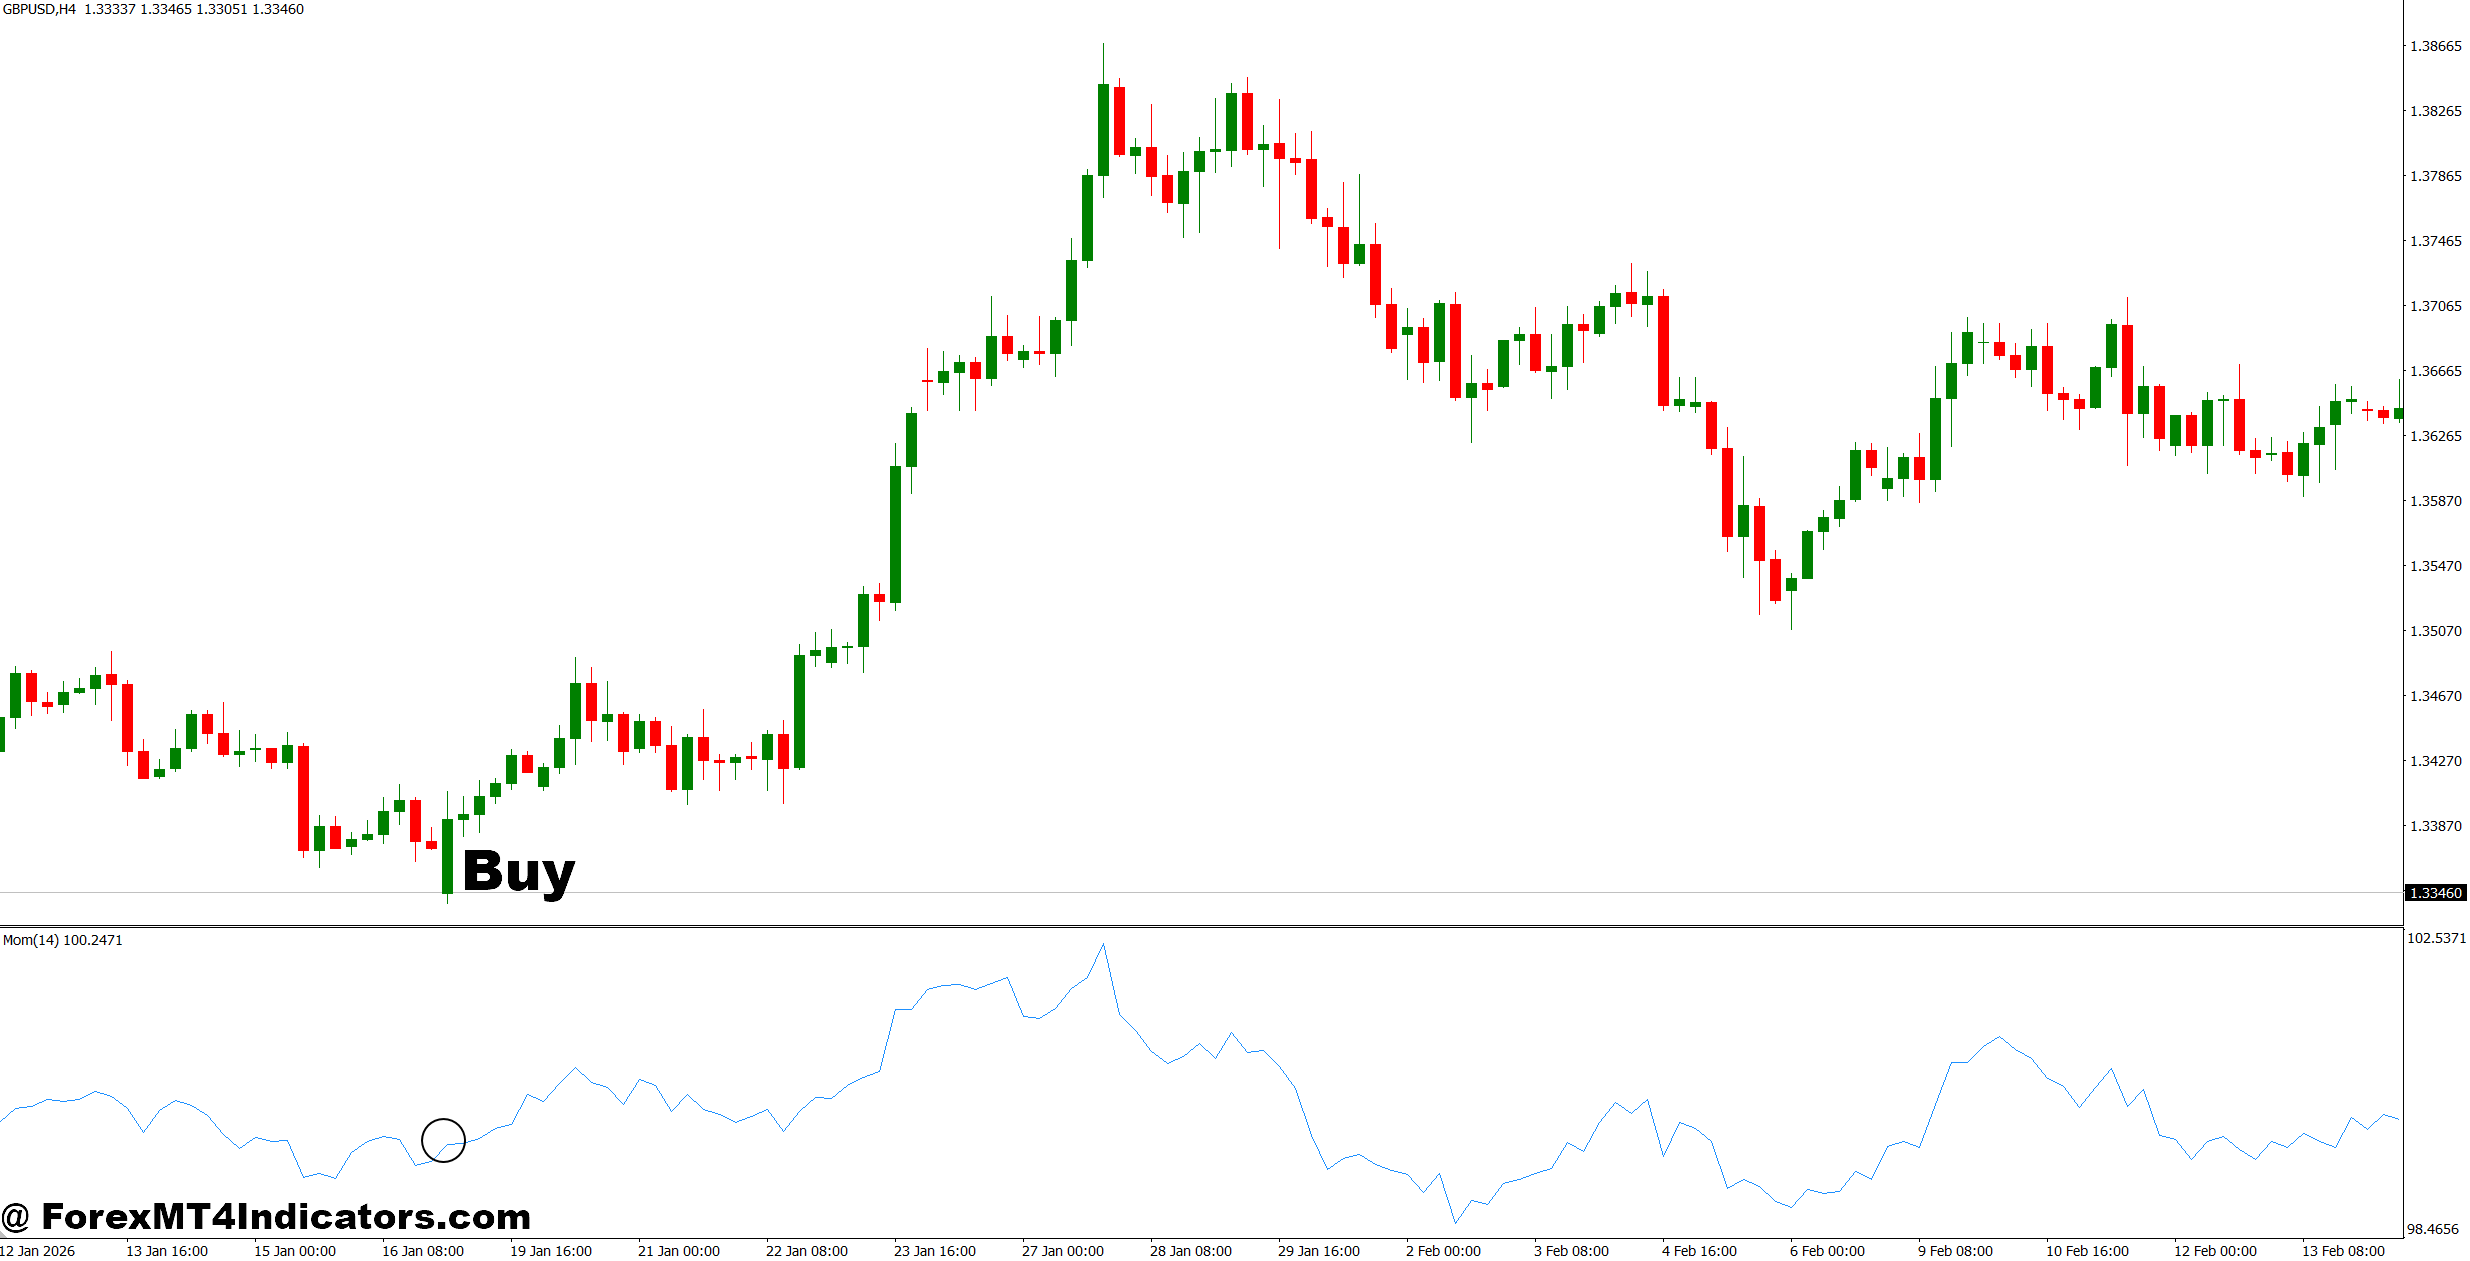
- Wait for bullish momentum – Enter when the indicator turns positive on the 1-hour chart and EUR/USD closes above resistance by at least 10–15 pips.
- Confirm the breakout – Buy GBP/USD after a strong H1 candle breaks resistance and the indicator rises with increasing momentum.
- Use a retest entry – Wait for price to retest the broken level, then enter if it holds within 5–10 pips of support.
- Check the 4-hour trend – Favor BUY signals when the H4 structure shows higher highs and higher lows.
- Target 20–40 pips – On EUR/USD, consider a 20–40 pip target when volatility supports the setup and momentum remains positive.
- Limit account risk – Keep risk around 1% per trade and place the stop 15–30 pips below the recent swing low.
- Avoid weak momentum – Don’t buy when price rises but the indicator forms lower highs, as this can signal fading buying pressure.
- Skip major news spikes – Avoid fresh entries 5–15 minutes before high-impact events such as NFP unless the strategy has been specifically tested for them.
Sell Entry
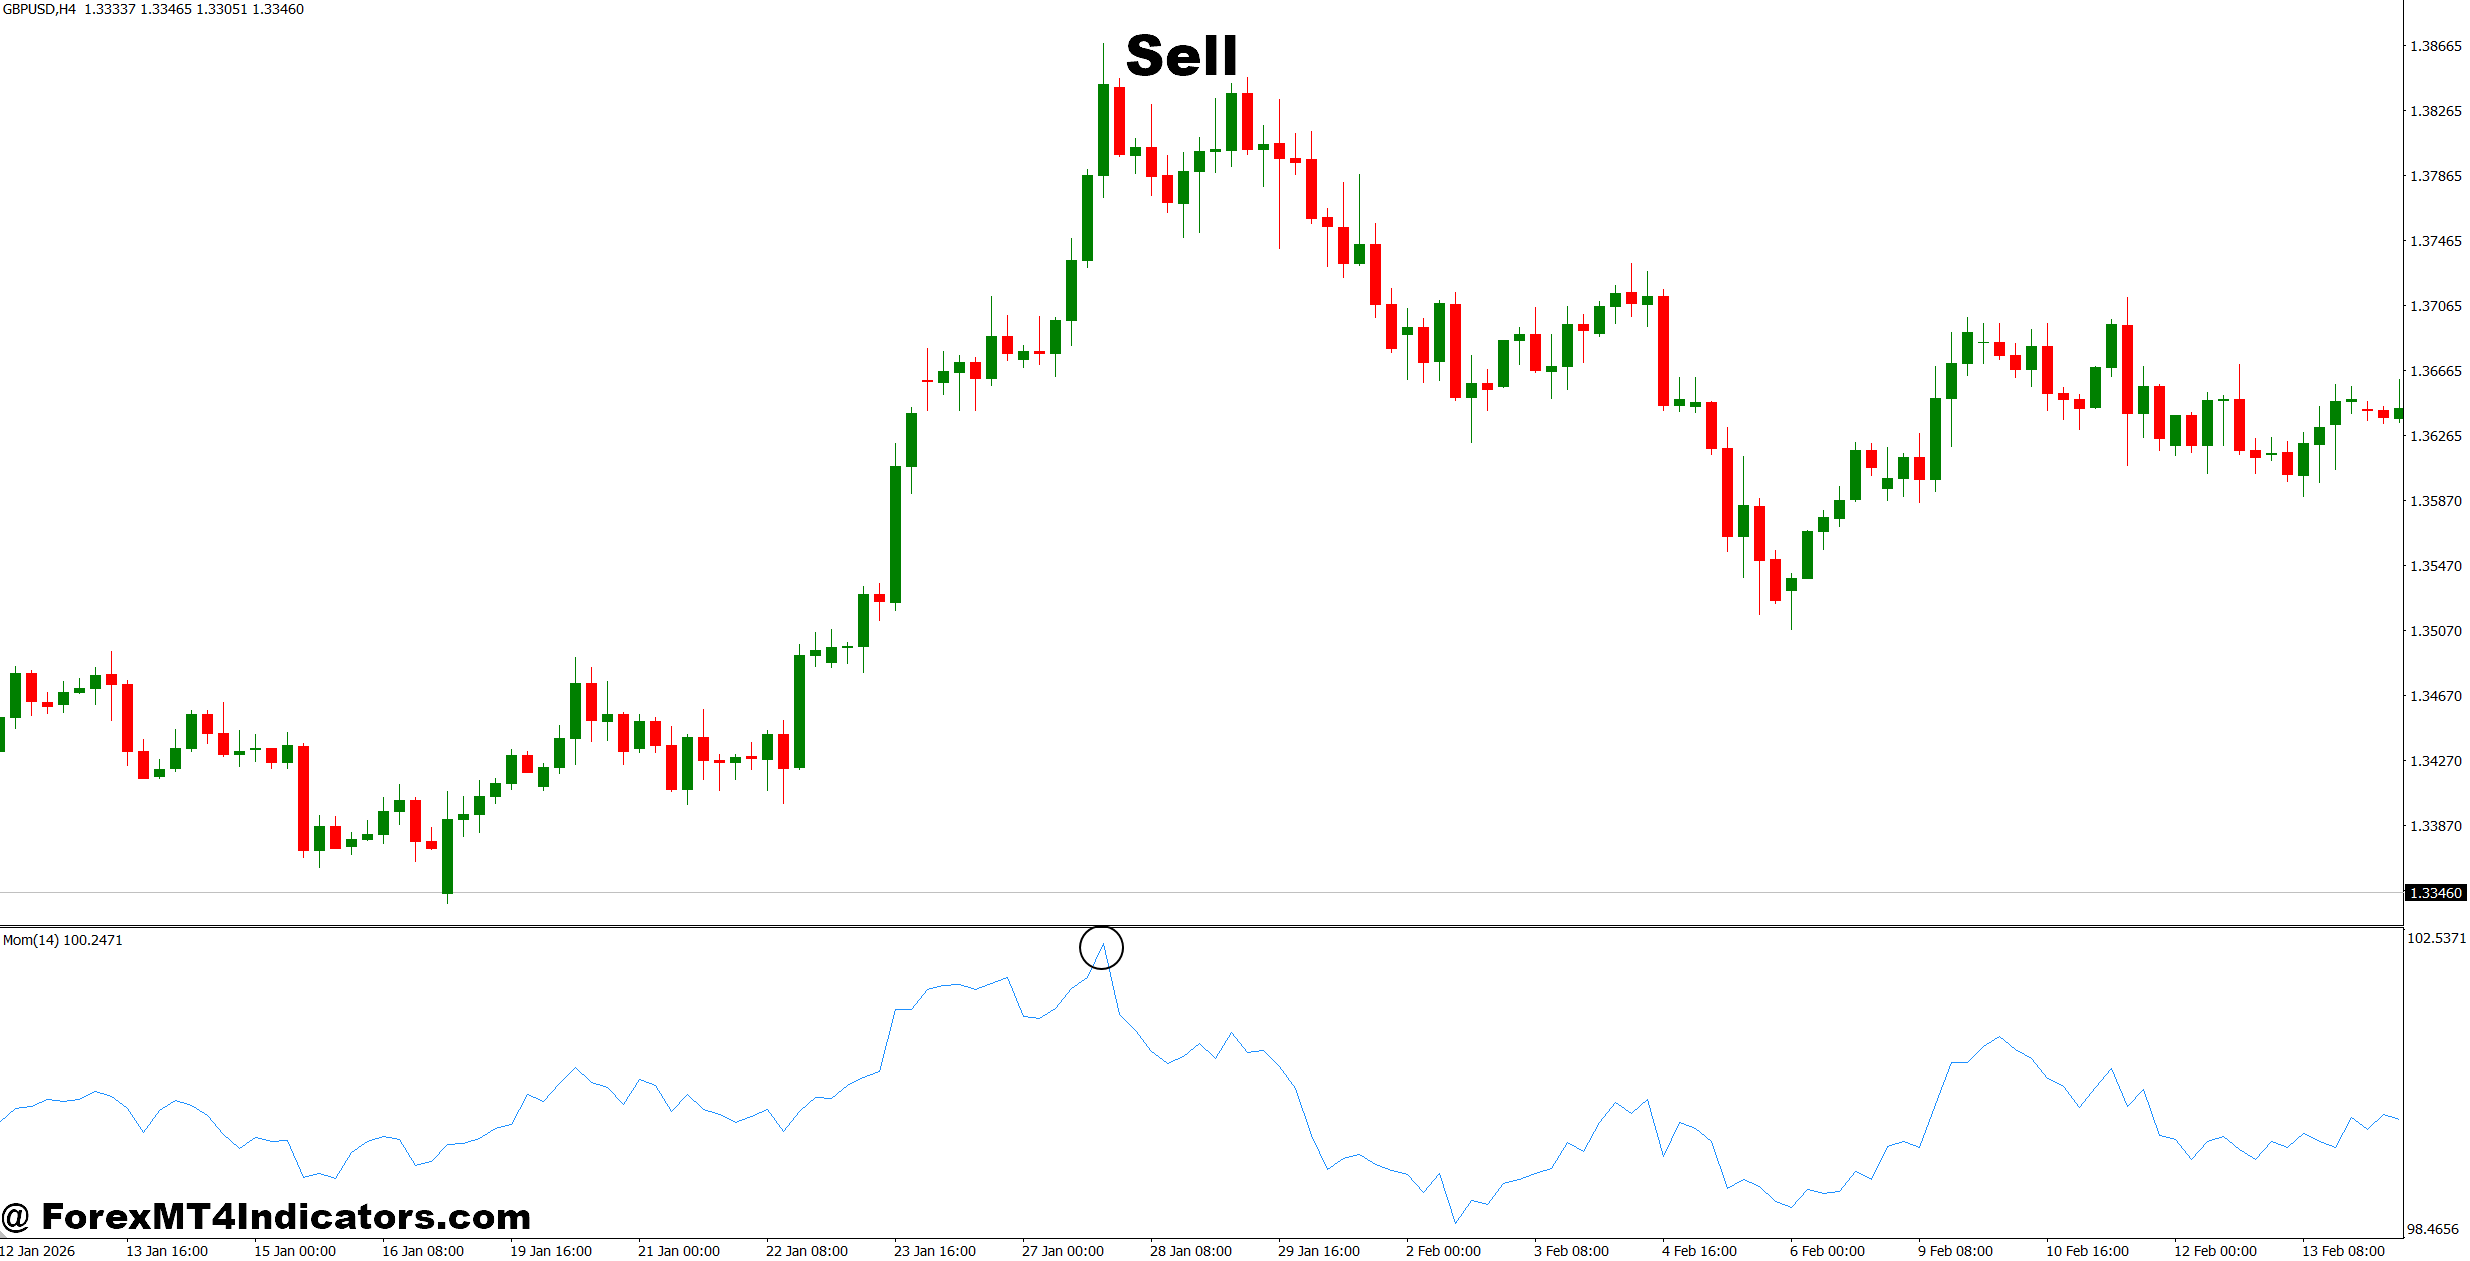
- Wait for bearish momentum – Consider a SELL when the indicator turns negative and EUR/USD closes 10–15 pips below established support on H1.
- Confirm resistance rejection – Sell GBP/USD when price rejects resistance and the indicator shows expanding downside momentum.
- Use a failed retest – Wait for price to retest broken support within 5–10 pips and enter after bearish rejection.
- Check the daily trend – Give more weight to SELL setups when the daily chart shows lower highs and lower lows.
- Target 25–50 pips – On GBP/USD, a 25–50 pip target can suit a strong H1 bearish move, depending on volatility.
- Protect the position – Place the stop 20–35 pips above the recent swing high and keep total trade risk near 1%.
- Watch for bullish divergence – Avoid SELL entries when price makes a lower low but the indicator makes a higher low.
- Stay out during choppy markets – Skip signals when the indicator repeatedly flips direction within 3–5 candles without a clear price trend.
Conclusion
The Volume Momentum Indicator MT4 can be a practical confirmation tool when traders want to see whether price movement is supported by increasing market activity. Its strongest use comes from combining the reading with structure rather than treating it as an automatic signal.
- Use momentum with price structure – Breakouts, retests, and trend continuation setups become easier to assess when volume activity agrees with price.
- Adjust settings to the chart – Faster settings can suit M5 trading, while 14–20 periods often provide a calmer view on H1.
- Watch for divergence – Rising prices with weakening momentum can warn that a move is losing strength.
- Keep risk independent of the indicator – Stops should reflect volatility and market structure, not simply the indicator’s position.
The Volume Momentum Indicator MT4 won’t remove losing trades from a strategy. Its value comes from helping traders ask a better question before entering: is the market actually supporting this move, or is price moving without enough follow-through?
Trading forex carries substantial risk. No indicator guarantees profits. Traders should test the tool on historical data and a demo account before risking real capital.
Level up your trading
Learn to read the chart — not just the indicator
eBook · Instant PDF
Video Course · 12 modules
Recommended MT4/MT5 Brokers
- ✓ *FREE *$50 to start (withdrawable)
- ✓ Deposit bonus up to $5,000
- ✓ Negative balance protection
Trading forex and CFDs carries a significant risk of loss and is not suitable for everyone. Broker links are affiliate links — we may earn a commission at no cost to you.
Free MT4 Indicator Download

Enter Your Email Address below, download link will be sent to you.
