


William Percent Range, commonly called Williams %R, is a momentum oscillator developed by Larry Williams. It measures where the current closing price sits within the recent high-low range.
The oscillator normally moves between 0 and -100. Readings near 0 show that price is trading close to the top of the selected range. Readings near -100 mean price is close to the bottom.
The standard calculation is:
%R = (Highest High − Close) ÷ (Highest High − Lowest Low) × -100
For example, suppose EUR/USD on the 1-hour chart has a 14-period high of 1.0870 and a low of 1.0790. If the current close is 1.0854, the calculation produces approximately -20. That tells the trader price is positioned near the upper end of the recent 14-hour range.
A common MT4 setup uses 14 periods, although traders can adjust this value. A shorter setting such as 7 reacts faster, while a longer setting such as 21 produces fewer but slower signals.
Understanding the Main Levels
Three areas deserve attention:
- 0 to -20 – Strong position near the recent highs; traders often describe this as overbought.
- -20 to -80 – Middle range where momentum needs additional confirmation.
- -80 to -100 – Price is near recent lows; this area is commonly viewed as oversold.
The key point is simple: overbought doesn’t automatically mean “sell,” and oversold doesn’t automatically mean “buy.”
How Traders Can Read Williams %R With Price Action
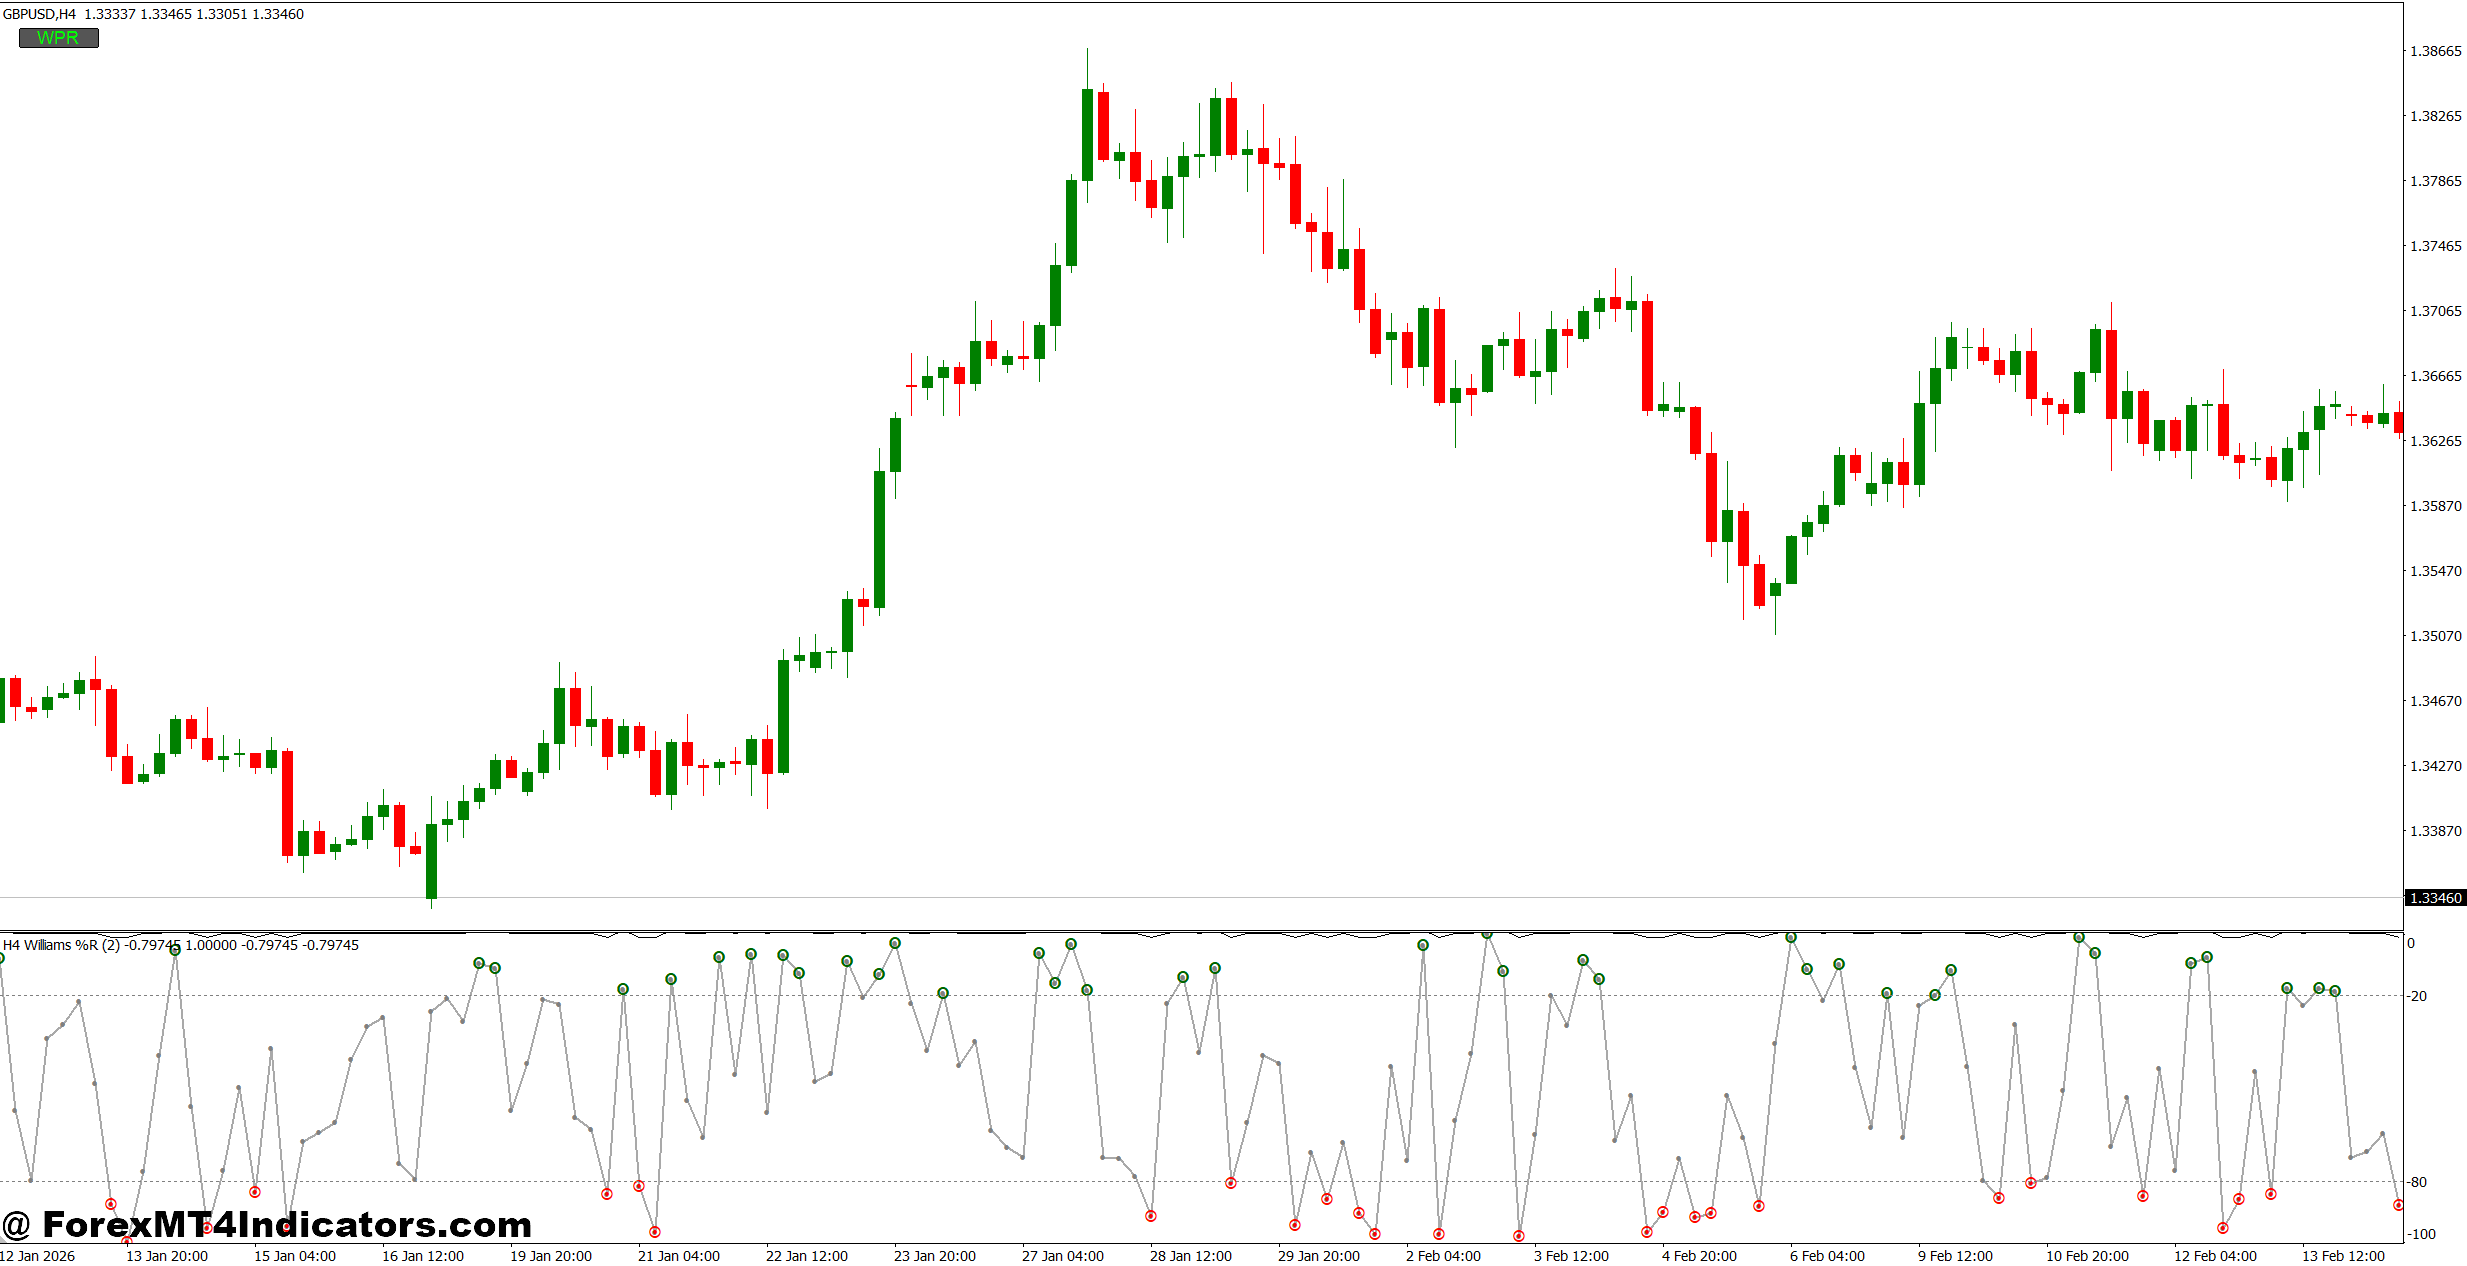
The most useful approach is to combine the oscillator with market structure. A reading becomes more meaningful when price reaches a known support or resistance area.
Consider GBP/USD on the 4-hour chart. Suppose price falls into a support zone around 1.2640 after several bearish candles. Williams %R(14) reaches -94. Instead of buying immediately, a trader can wait for price to reject 1.2640 and for the oscillator to move back above -80.
That small shift matters. It shows that downside momentum may be weakening rather than simply showing that the market is oversold.
A similar setup works on resistance. If EUR/USD reaches resistance at 1.0920, while Williams %R rises to -8, traders can watch for a bearish rejection candle. A move back below -20, combined with a lower high, gives stronger evidence for a short setup.
Here’s the thing: the indicator becomes much more useful when it answers a timing question. Instead of asking, “Is the market overbought?” traders can ask, “Is momentum turning after price reaches a level that matters?”
A Practical Entry Example
Imagine USD/JPY on the 1-hour chart:
- Resistance: 157.20
- Williams %R(14): -7
- Price forms a bearish rejection candle at 157.18
- The next candle closes below the rejection candle’s low
- Williams %R drops back below -20
A trader could consider a short entry around 157.05, with a stop around 157.35, giving roughly 30 pips of initial risk. A first target near 156.45 would offer about 60 pips of potential reward.
The setup isn’t guaranteed. A strong economic release could push USD/JPY through 157.20 despite the oscillator reading.
Settings for Different Forex Timeframes
The default 14-period setting is a reasonable starting point, but it doesn’t suit every trading style.
For scalpers working on M5 or M15, a 7- or 9-period setting can make the oscillator more responsive. The trade-off is more noise. During a quiet Asian session, that faster setting may produce several signals that don’t develop into meaningful moves.
For intraday trading on M30 and H1, Williams %R(14) provides a useful balance between speed and stability. Traders can also use the H4 chart for directional confirmation.
On the 4-hour and daily charts, settings between 14 and 21 can reduce unnecessary signals. A trader looking at GBP/USD daily structure, for example, may prefer %R(21) because the longer calculation reflects a broader price range.
Pairs also behave differently. GBP/JPY can produce sharper swings than EUR/USD, so a fixed 7-period setting may create too many early signals. Testing the setting across several months of historical data is more reliable than choosing a number simply because it is popular.
Williams %R Compared With RSI and Stochastic
Williams %R often gets compared with the 14-period RSI and Stochastic Oscillator because all three help measure momentum.
RSI moves from 0 to 100, while Williams %R uses 0 to -100. RSI’s traditional reference levels are 70 and 30. Williams %R commonly uses -20 and -80.
Stochastic also compares the closing price with a recent trading range. The main difference is presentation and calculation. Williams %R is essentially a range-position oscillator displayed on a negative scale, while Stochastic typically uses a 0-100 scale and often includes %K and %D lines.
For some traders, Williams %R feels easier to read because the movement toward 0 or -100 directly shows where price sits within its recent range.
But none of these indicators can determine market direction by themselves. A strong trend can keep RSI above 70 or Williams %R above -20 for a long time. Selling simply because the oscillator reaches an extreme is one of the most common mistakes.
Advantages, Limitations, and Risk Management
One major advantage of the William Percent Range Indicator MT4 is its simplicity. It can quickly show momentum extremes and potential changes without covering the chart with multiple lines.
It also works well with support and resistance, trendlines, moving averages, and candlestick patterns. A trader might use a 50-period moving average to define the broader trend, then use Williams %R for entry timing.
There are limits, though. During strong trends, the oscillator can remain overbought or oversold for many candles. During sideways markets, it can produce frequent whipsaws. News events are another problem. On NFP days, CPI releases, or central-bank decisions, price can move dozens of pips before the oscillator provides a useful confirmation.
A sensible approach is to risk only a small portion of trading capital on each position, such as 0.5% to 1%, and place the stop according to market structure rather than an arbitrary number of pips.
For instance, if a EUR/USD setup requires a 25-pip stop, the position size should be reduced when necessary to keep the planned dollar risk within the trader’s limit.
Trading forex carries substantial risk. No indicator guarantees profits.
How to Trade with William Percent Range Indicator MT4
Buy Entry
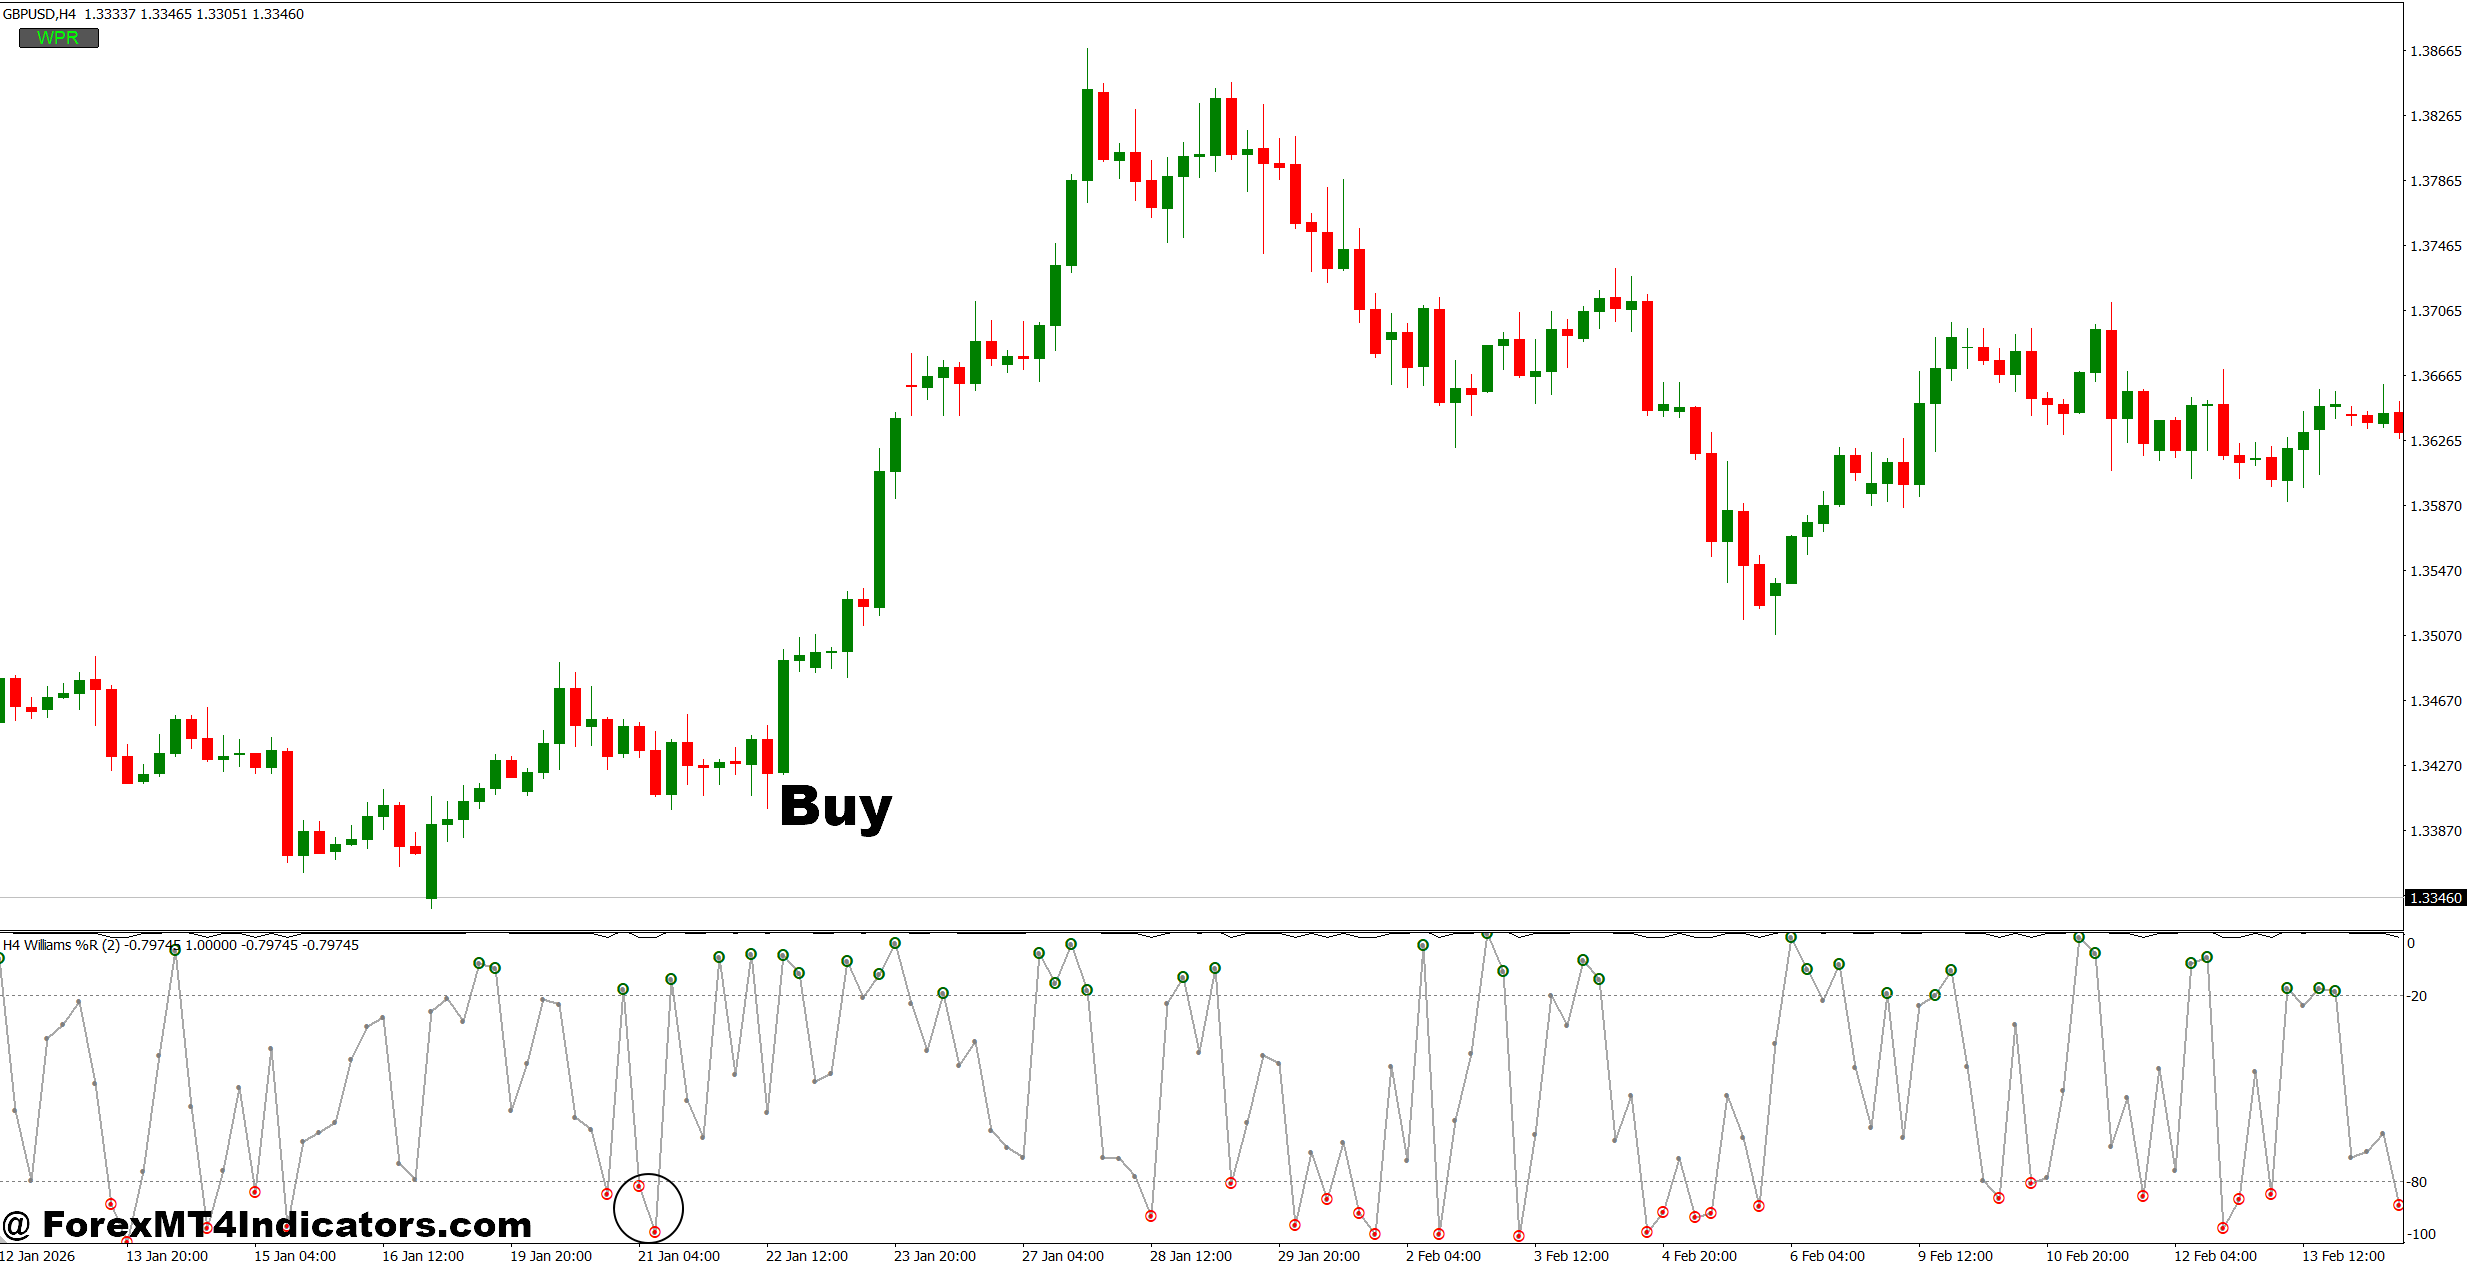
- Wait Below -80 – Watch for Williams %R to reach -80 to -100 on the 1-hour EUR/USD chart before considering a buy.
- Confirm the Rebound – Enter after %R moves back above -80, showing that selling pressure is weakening.
- Check Support – Look for price to reject a strong support zone, ideally with a 10–20 pip rejection before entry.
- Follow the H4 Trend – Prefer buy signals when the 4-hour chart shows higher highs and higher lows.
- Use Candle Confirmation – Wait for a bullish engulfing or strong bullish candle before entering instead of buying the first oversold reading.
- Set a Practical Stop – Place the stop 15–30 pips below support, depending on the pair’s volatility.
- Target 1:2 Risk/Reward – If the stop is 20 pips, aim for at least 40 pips of potential profit.
- Avoid Strong Bearish Moves – Don’t buy simply because %R reaches -95 when EUR/USD is breaking daily support with heavy bearish momentum.
Sell Entry
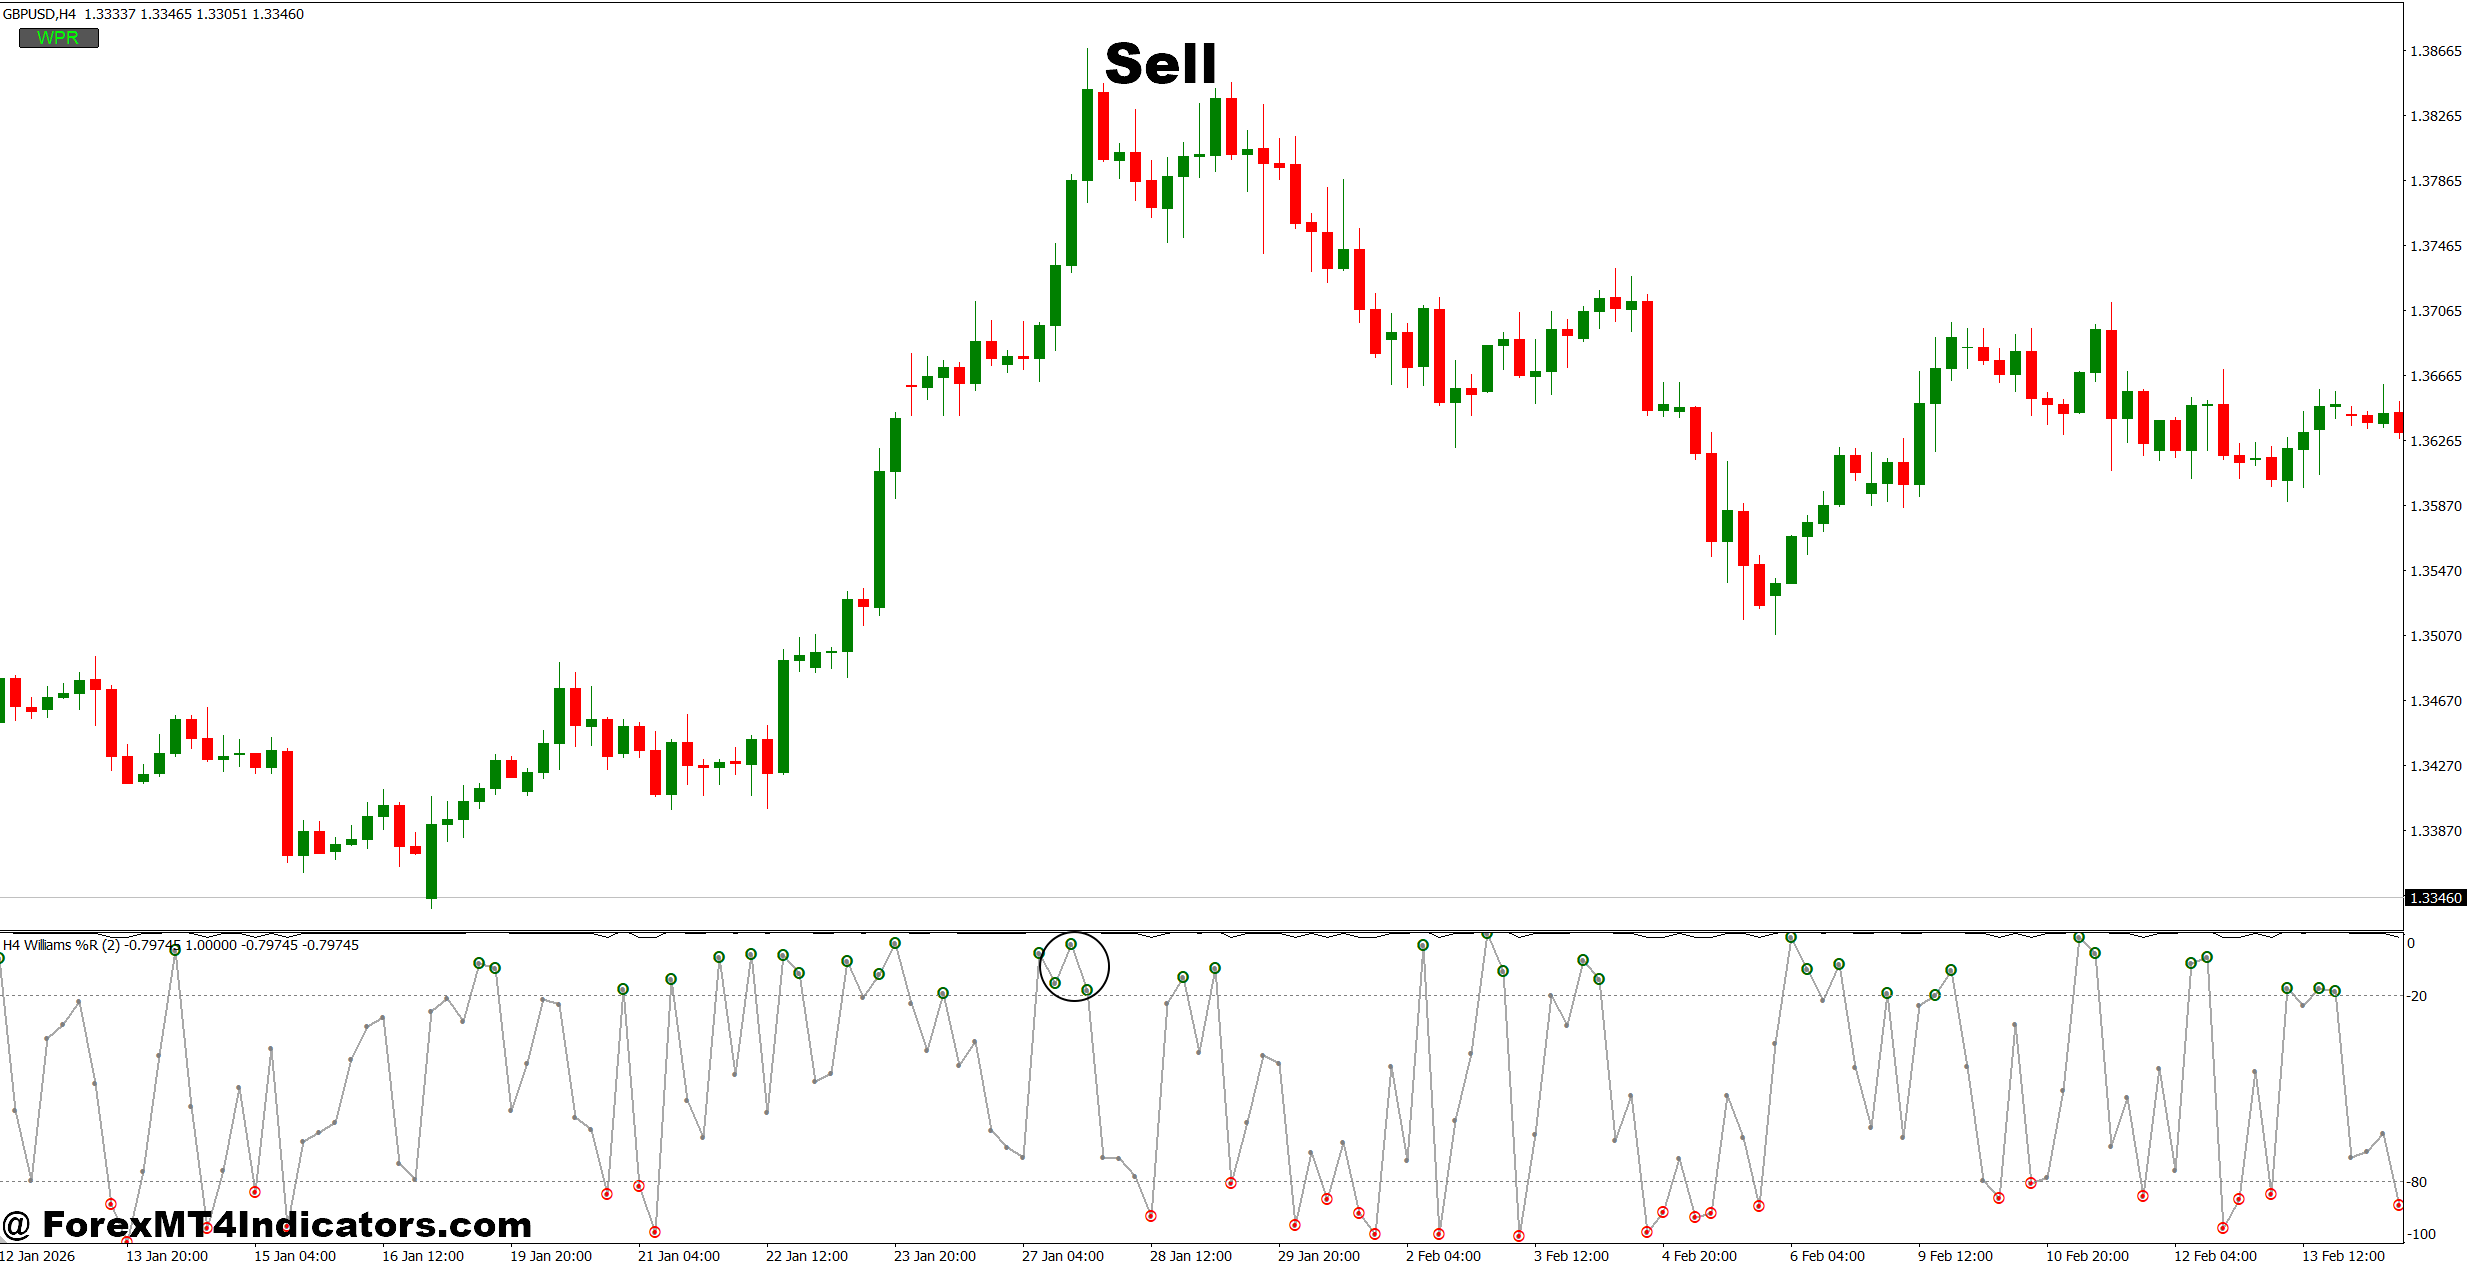
- Watch Above -20 – Look for Williams %R to reach -20 to 0 on the 1-hour GBP/USD chart before considering a sell.
- Confirm the Drop – Wait for %R to fall back below -20, suggesting bearish momentum is returning.
- Check Resistance – Prefer setups where price rejects resistance by around 10–25 pips before entry.
- Confirm the Daily Trend – Favor sell signals when the daily chart shows lower highs and lower lows.
- Wait for Bearish Price Action – A bearish engulfing candle or rejection wick can provide confirmation before entering.
- Limit Trade Risk – Risk around 0.5%–1% of account equity per trade rather than increasing the lot size after a losing trade.
- Use a 1:2 Target – With a 25-pip stop, look for approximately 50 pips of potential upside to the target.
- Avoid Strong Bullish Breakouts – Don’t short GBP/USD just because %R reaches -5 when price breaks major daily resistance with strong momentum.
Final Thoughts on the William Percent Range Indicator MT4
The William Percent Range Indicator MT4 is best viewed as an entry-timing and momentum tool, not a complete trading strategy. Traders can get more value from it by combining its readings with price structure and confirmation.
- Use the range levels carefully – -20 and -80 identify potential extremes, not automatic reversal points.
- Wait for confirmation – A rejection candle, structure break, or momentum shift can make a signal more useful.
- Match settings to the chart – Williams %R(7) can suit faster charts, while 14 or 21 may work better for broader analysis.
- Control the downside – Position sizing and stop-loss placement matter more than any single indicator reading.
A trader who tests the indicator across different pairs and market conditions will quickly learn where it performs well and where it creates noise. The goal isn’t to trade every signal. It’s to find the few signals that fit the broader market structure and offer a sensible risk-to-reward setup.
Level up your trading
Learn to read the chart — not just the indicator
eBook · Instant PDF
Video Course · 12 modules
Recommended MT4/MT5 Brokers
- ✓ *FREE *$50 to start (withdrawable)
- ✓ Deposit bonus up to $5,000
- ✓ Negative balance protection
Trading forex and CFDs carries a significant risk of loss and is not suitable for everyone. Broker links are affiliate links — we may earn a commission at no cost to you.
Free MT4 Indicator Download

Enter Your Email Address below, download link will be sent to you.
