


The Buying Selling Pressure Indicator MT4 helps reduce that uncertainty by showing whether buyers or sellers are currently controlling the market. Instead of relying only on candle patterns, traders can measure the balance of market pressure before entering a trade.
A trader who understands buying and selling pressure has a better chance of filtering weak signals and avoiding trades during indecisive market conditions. While no technical tool can predict every move, this indicator offers valuable insight into market sentiment when combined with price action and proper risk management. The following sections explain how it works, where it performs best, and how traders can use it effectively in real trading situations.
What Is the Buying Selling Pressure Indicator MT4?
The Buying Selling Pressure Indicator MT4 is a momentum-based technical analysis tool that estimates the strength of buyers versus sellers during each price movement. Instead of simply showing trend direction, it measures which side is pushing the market with greater force.
Most versions display colored histogram bars or separate pressure lines below the price chart. Green or blue bars usually represent buying pressure, while red bars indicate selling pressure. As the difference between buyers and sellers increases, the histogram becomes larger, making shifts in market sentiment easier to recognize.
Unlike moving averages that react after trends develop, this indicator focuses on the ongoing battle between bullish and bearish orders. That makes it useful during trend continuation as well as early reversal setups.
How the Indicator Calculates Market Pressure
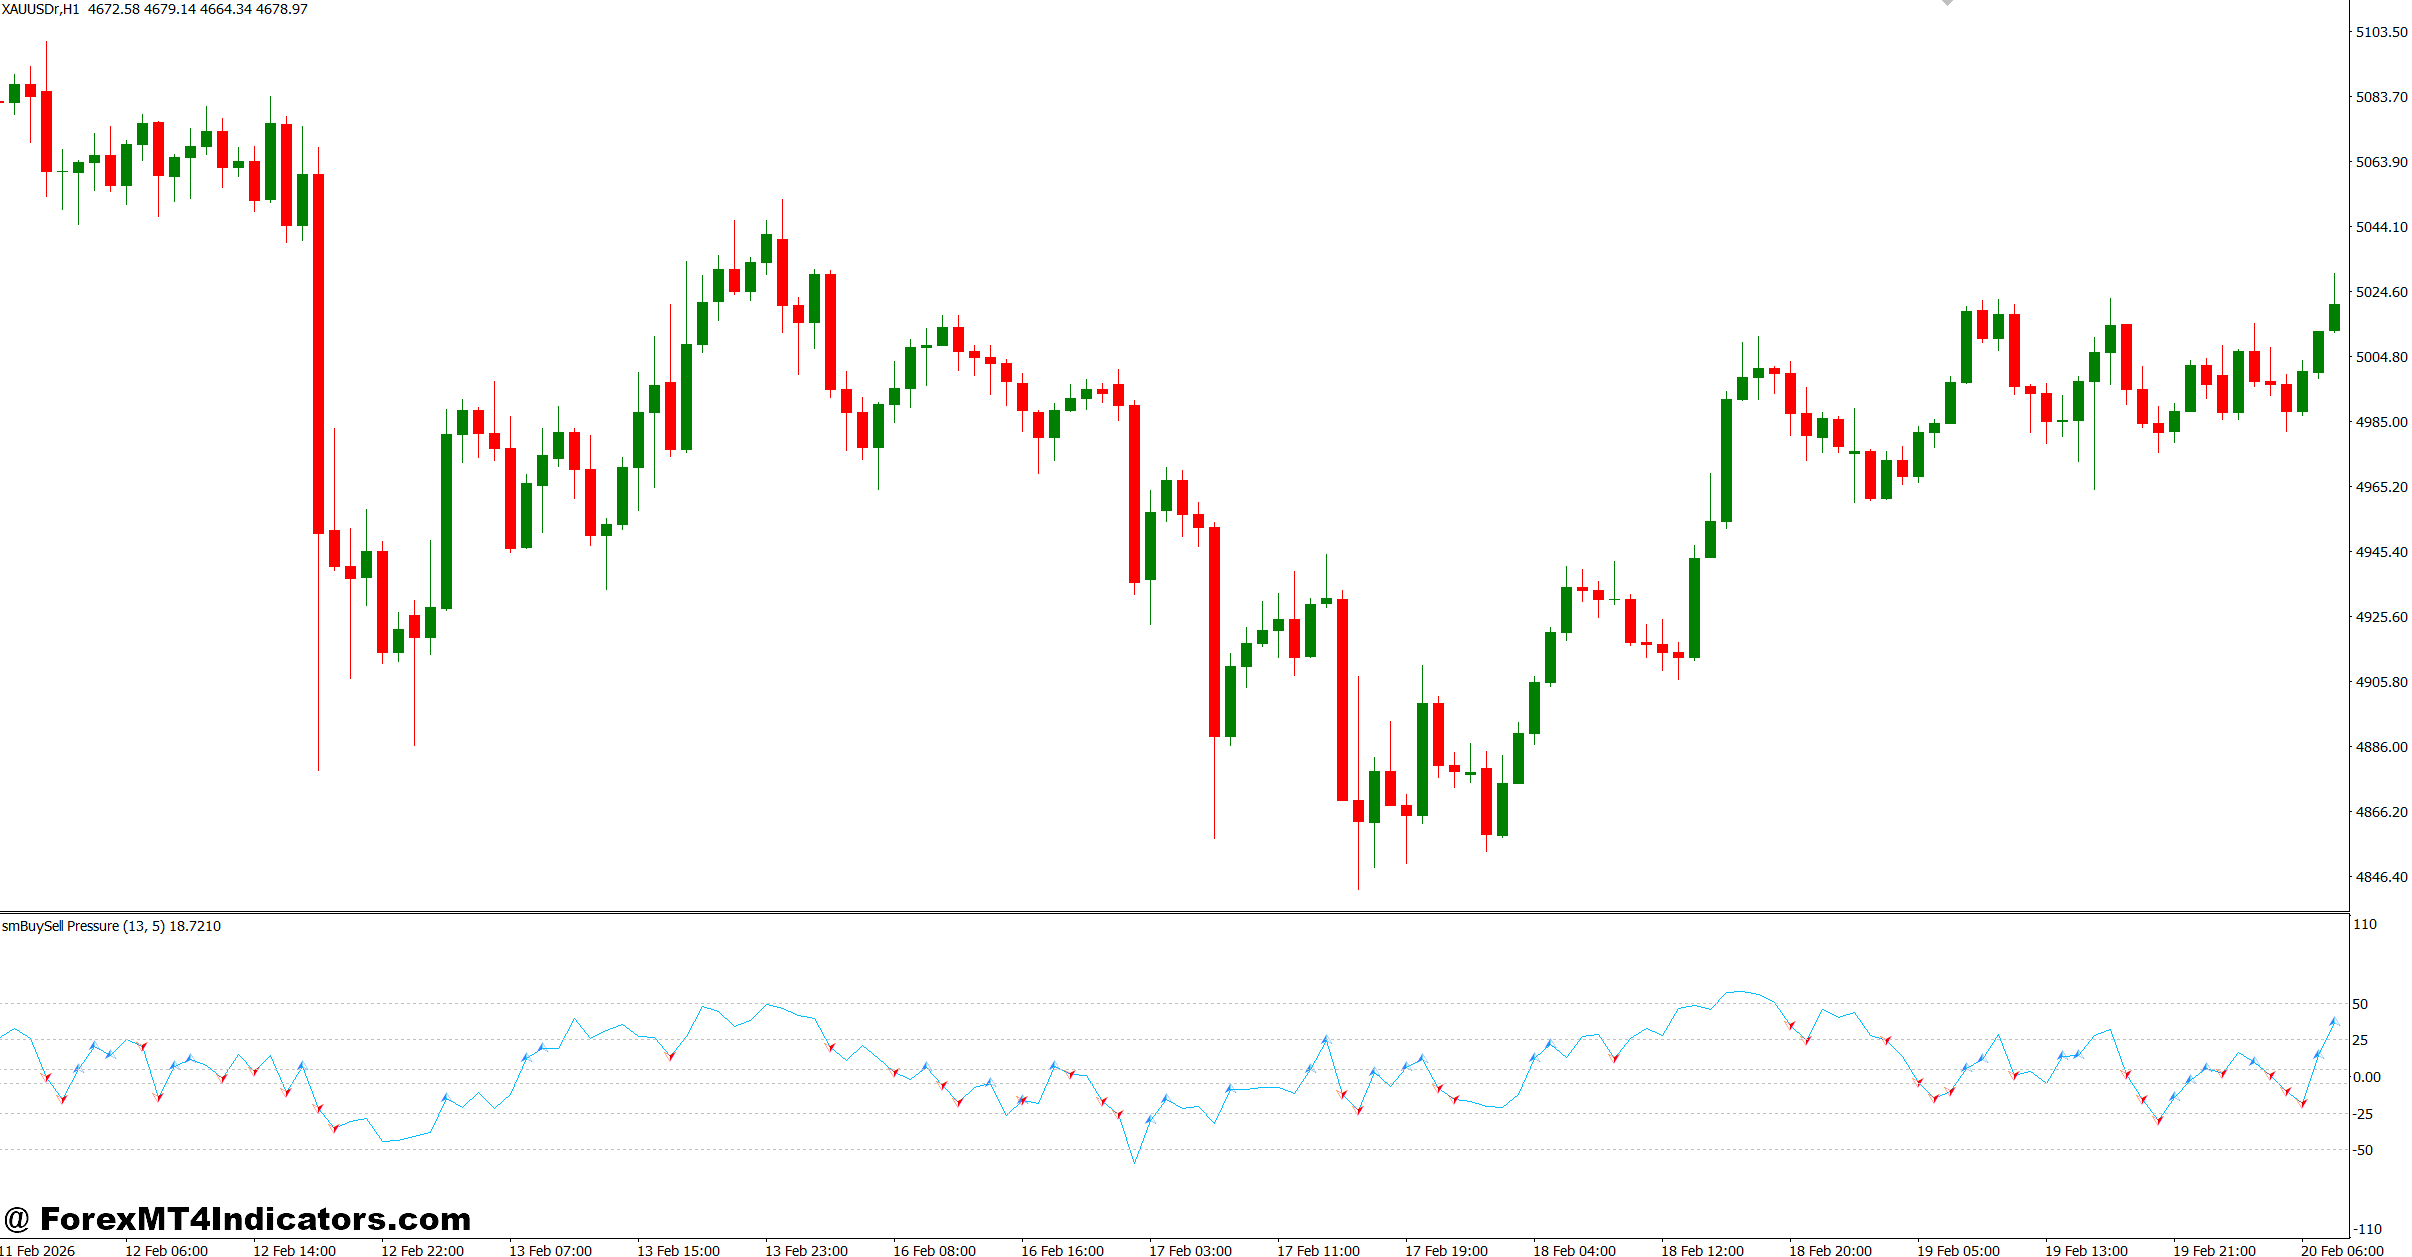
Different developers build the indicator using slightly different formulas, but the underlying logic remains similar. It compares price movement, candle range, highs, lows, and closing prices over a selected lookback period to estimate buying and selling activity.
For example, when several candles close near their highs with expanding ranges, the buying pressure reading increases. On the other hand, repeated closes near candle lows push the selling pressure reading higher.
Some versions also smooth the data using moving averages to reduce market noise. A common setting is a 14-period calculation, although traders often adjust this depending on the timeframe.
In practice, a trader watching EUR/USD on the 1-hour chart may notice buying pressure rising steadily while price breaks above a resistance level around 1.0950. If both price and pressure increase together, the breakout has stronger confirmation than price movement alone.
But when price makes a new high while buying pressure weakens, the move may be losing momentum. That divergence often warns traders to tighten stop-loss levels or wait before opening new positions.
Practical Trading Applications
The Buying Selling Pressure Indicator MT4 performs best when traders combine it with market structure rather than treating it as a standalone entry signal.
One common approach is trend confirmation. Suppose GBP/USD trades above its 50-period Exponential Moving Average on the 4-hour chart. During a pullback, selling pressure decreases while buying pressure begins climbing again. As price forms a bullish engulfing candle near previous support, the indicator confirms buyers are returning. That combination offers a much stronger setup than relying on a single signal.
The indicator also helps during breakout trades.
Imagine USD/JPY spending several hours inside a narrow range. Price finally breaks above resistance, but buying pressure remains weak. Experienced traders often avoid chasing that breakout because weak pressure frequently leads to a fake-out and a return inside the range.
When testing this indicator during volatile NFP release days, many traders notice pressure readings fluctuate rapidly during the first few minutes. Waiting 10 to 15 minutes after the news allows pressure to stabilize before making trading decisions. This simple adjustment can prevent entering trades during extreme market noise.
The tool also works well alongside:
- Support and resistance zones
- Trendlines
- Moving averages
- RSI divergence
- Volume-based confirmation
- Break-and-retest strategies
Trading forex carries substantial risk. No indicator guarantees profits.
Best Settings and Customization
The default settings usually work well for most traders, but slight adjustments can improve performance depending on trading style.
Scalpers trading on the 5-minute chart often reduce the calculation period to 8 or 10 for faster reactions. This increases sensitivity but may produce extra signals during choppy sessions.
Swing traders using the 4-hour or Daily chart generally prefer 20 to 30 periods. The longer calculation filters small fluctuations and focuses on stronger market pressure.
Here are a few practical combinations:
- EUR/USD (1-hour): 14-period pressure setting with a 50 EMA trend filter.
- GBP/USD (30-minute): 10-period pressure setting during London session trading.
- XAU/USD Gold (15-minute): 20-period setting combined with support and resistance levels.
- USD/CAD (Daily): 21-period setting for identifying longer-term momentum shifts.
Here’s the thing: changing settings too frequently usually creates inconsistency. Many experienced traders test one configuration across at least 100 historical trades before deciding whether adjustments are necessary.
Advantages, Limitations, and Comparison With Similar Indicators
One major strength of the Buying Selling Pressure Indicator MT4 is its ability to show momentum shifts before they become obvious on the chart. Traders often spot weakening trends earlier than they would using simple moving averages.
Another advantage is its flexibility. It works across multiple currency pairs and timeframes, making it suitable for day trading, swing trading, and trend-following strategies.
Still, it has limitations.
During low-volume Asian trading sessions, buying and selling pressure may alternate quickly without producing meaningful price movement. Those frequent changes can create whipsaw signals if traders ignore the overall market trend.
The indicator also performs poorly when used alone. Strong support and resistance levels, higher-timeframe trends, and economic news should always remain part of the trading decision.
Compared with the Relative Strength Index (RSI), the Buying Selling Pressure Indicator focuses more directly on current market participation instead of overbought and oversold conditions.
Compared with MACD, it reacts faster to short-term momentum changes but may generate more false signals during sideways markets.
Against standard volume indicators in Forex, this tool attempts to estimate buyer-versus-seller strength rather than relying only on tick volume. That gives traders another perspective when evaluating market momentum.
Successful traders usually combine two or three confirming tools instead of searching for a single indicator that solves every trading problem.
How to Trade with Buying Selling Pressure Indicator MT4
Buy Entry
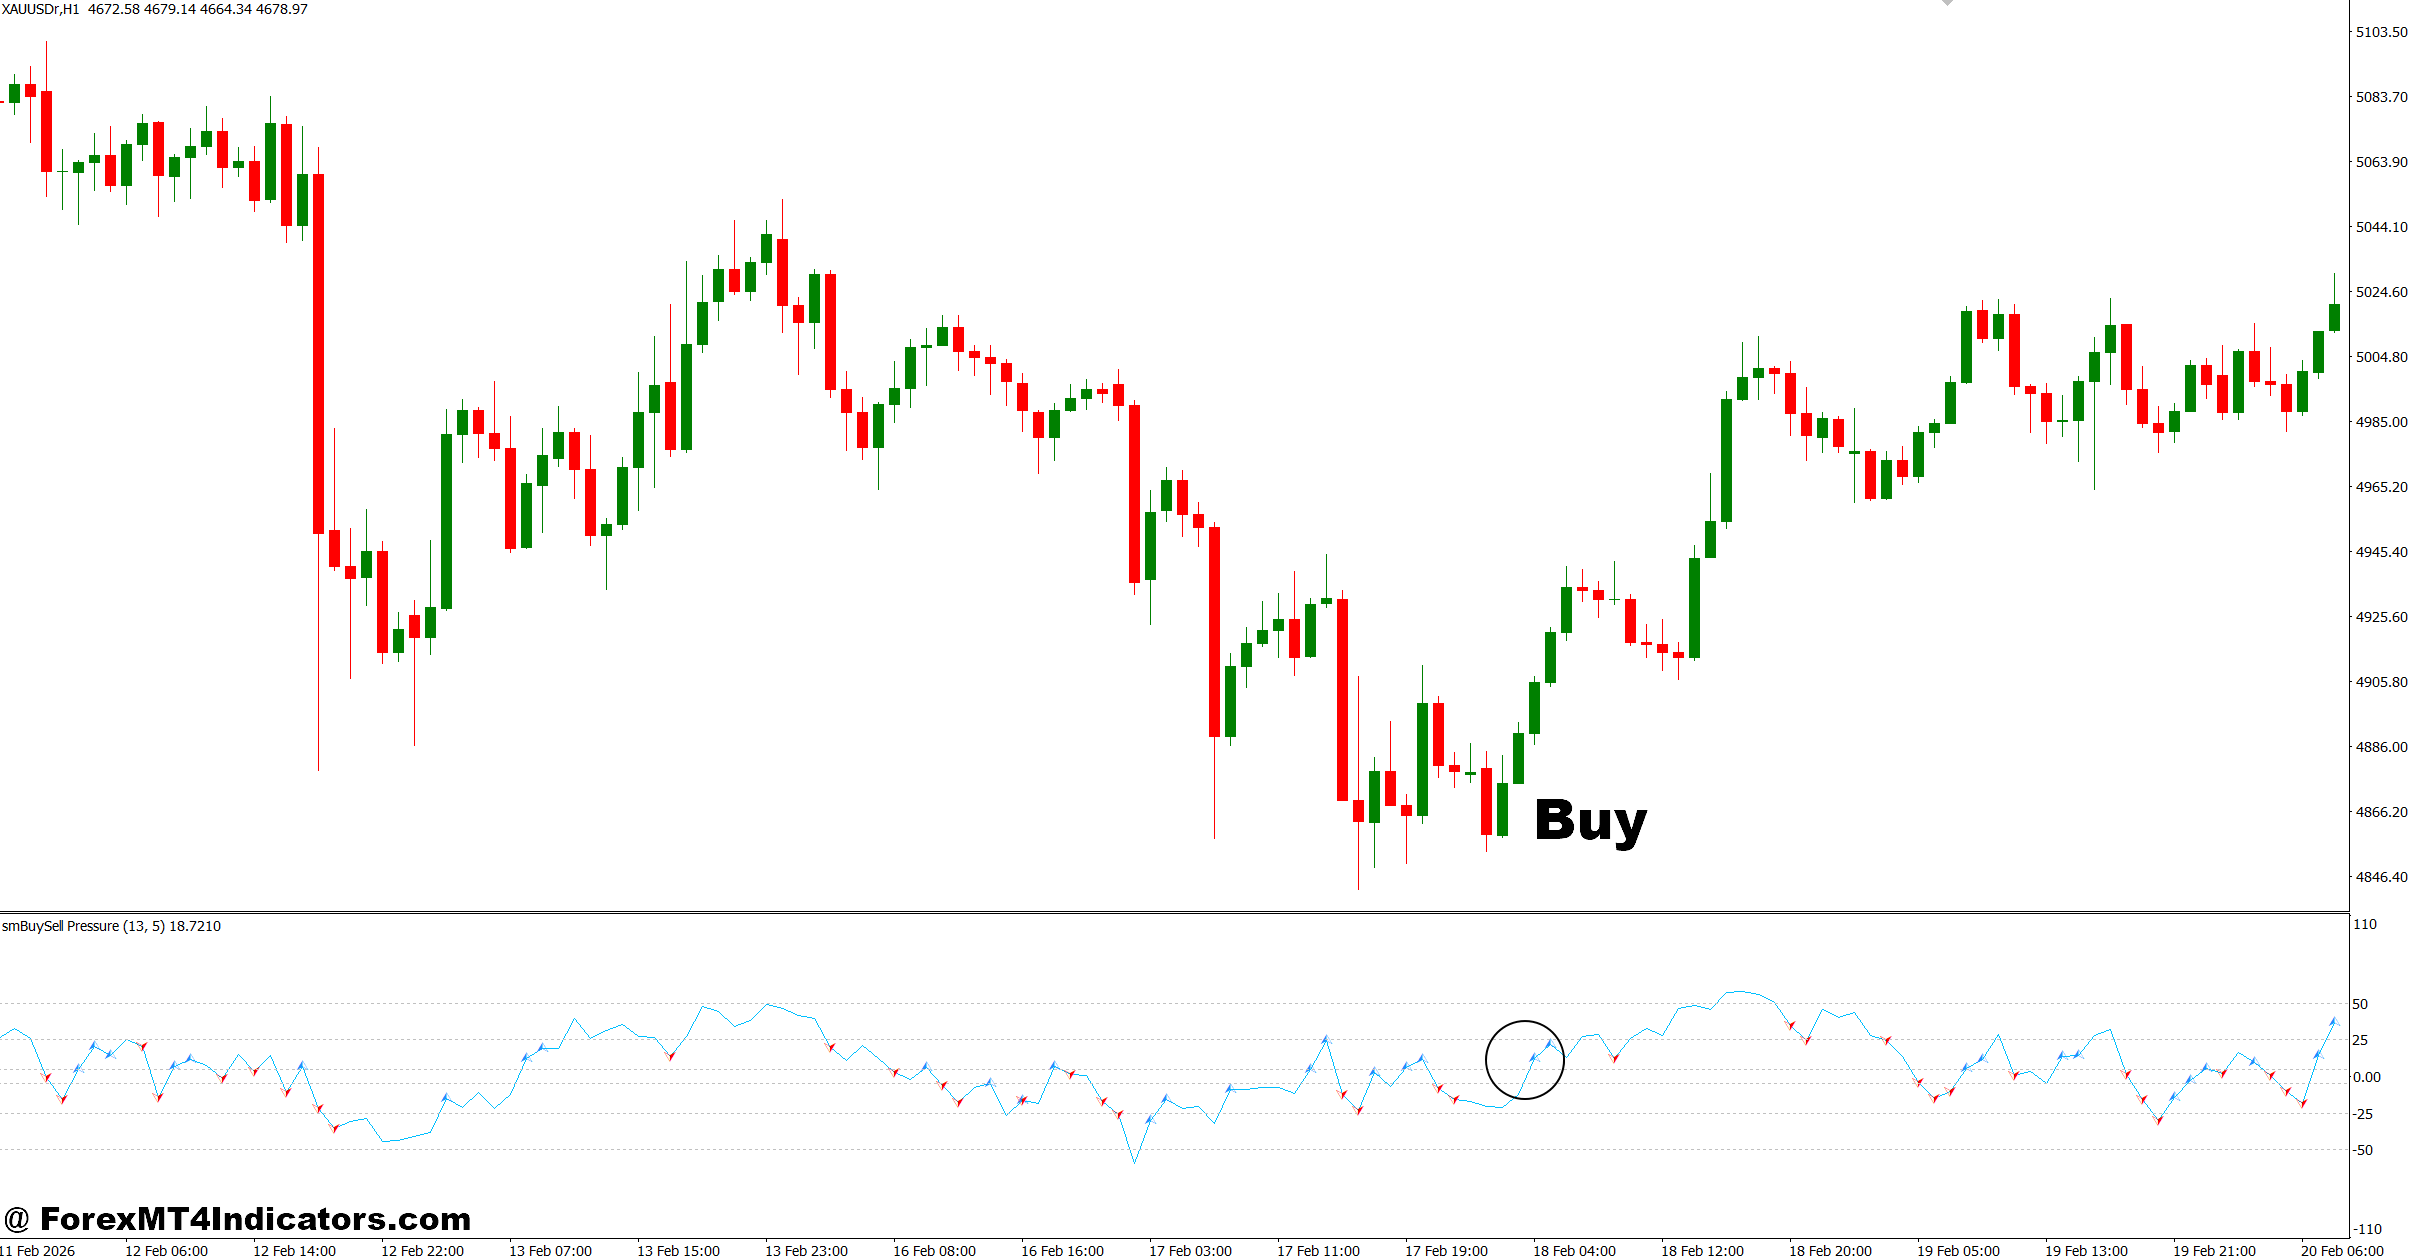
- Wait for buying pressure to rise – Enter a buy when the buying histogram strengthens on the EUR/USD 1-hour chart after a pullback.
- Confirm with trend direction – Buy only if price stays above the 50 EMA on the 4-hour timeframe.
- Trade the breakout – Open a buy after resistance breaks with strong buying pressure and target 30-60 pips.
- Use support as confirmation – Buy near a proven support zone with a 20-30 pip stop-loss.
- Watch for bullish candle close – Enter after a bullish engulfing or strong close confirms buyer strength.
- Risk only 1-2% per trade – Keep position size small even when pressure signals are strong.
- Avoid low-volume sessions – Skip buy signals during quiet Asian trading unless volatility increases.
- Ignore weak pressure signals – Don’t buy if buying pressure remains flat while price moves higher.
Sell Entry
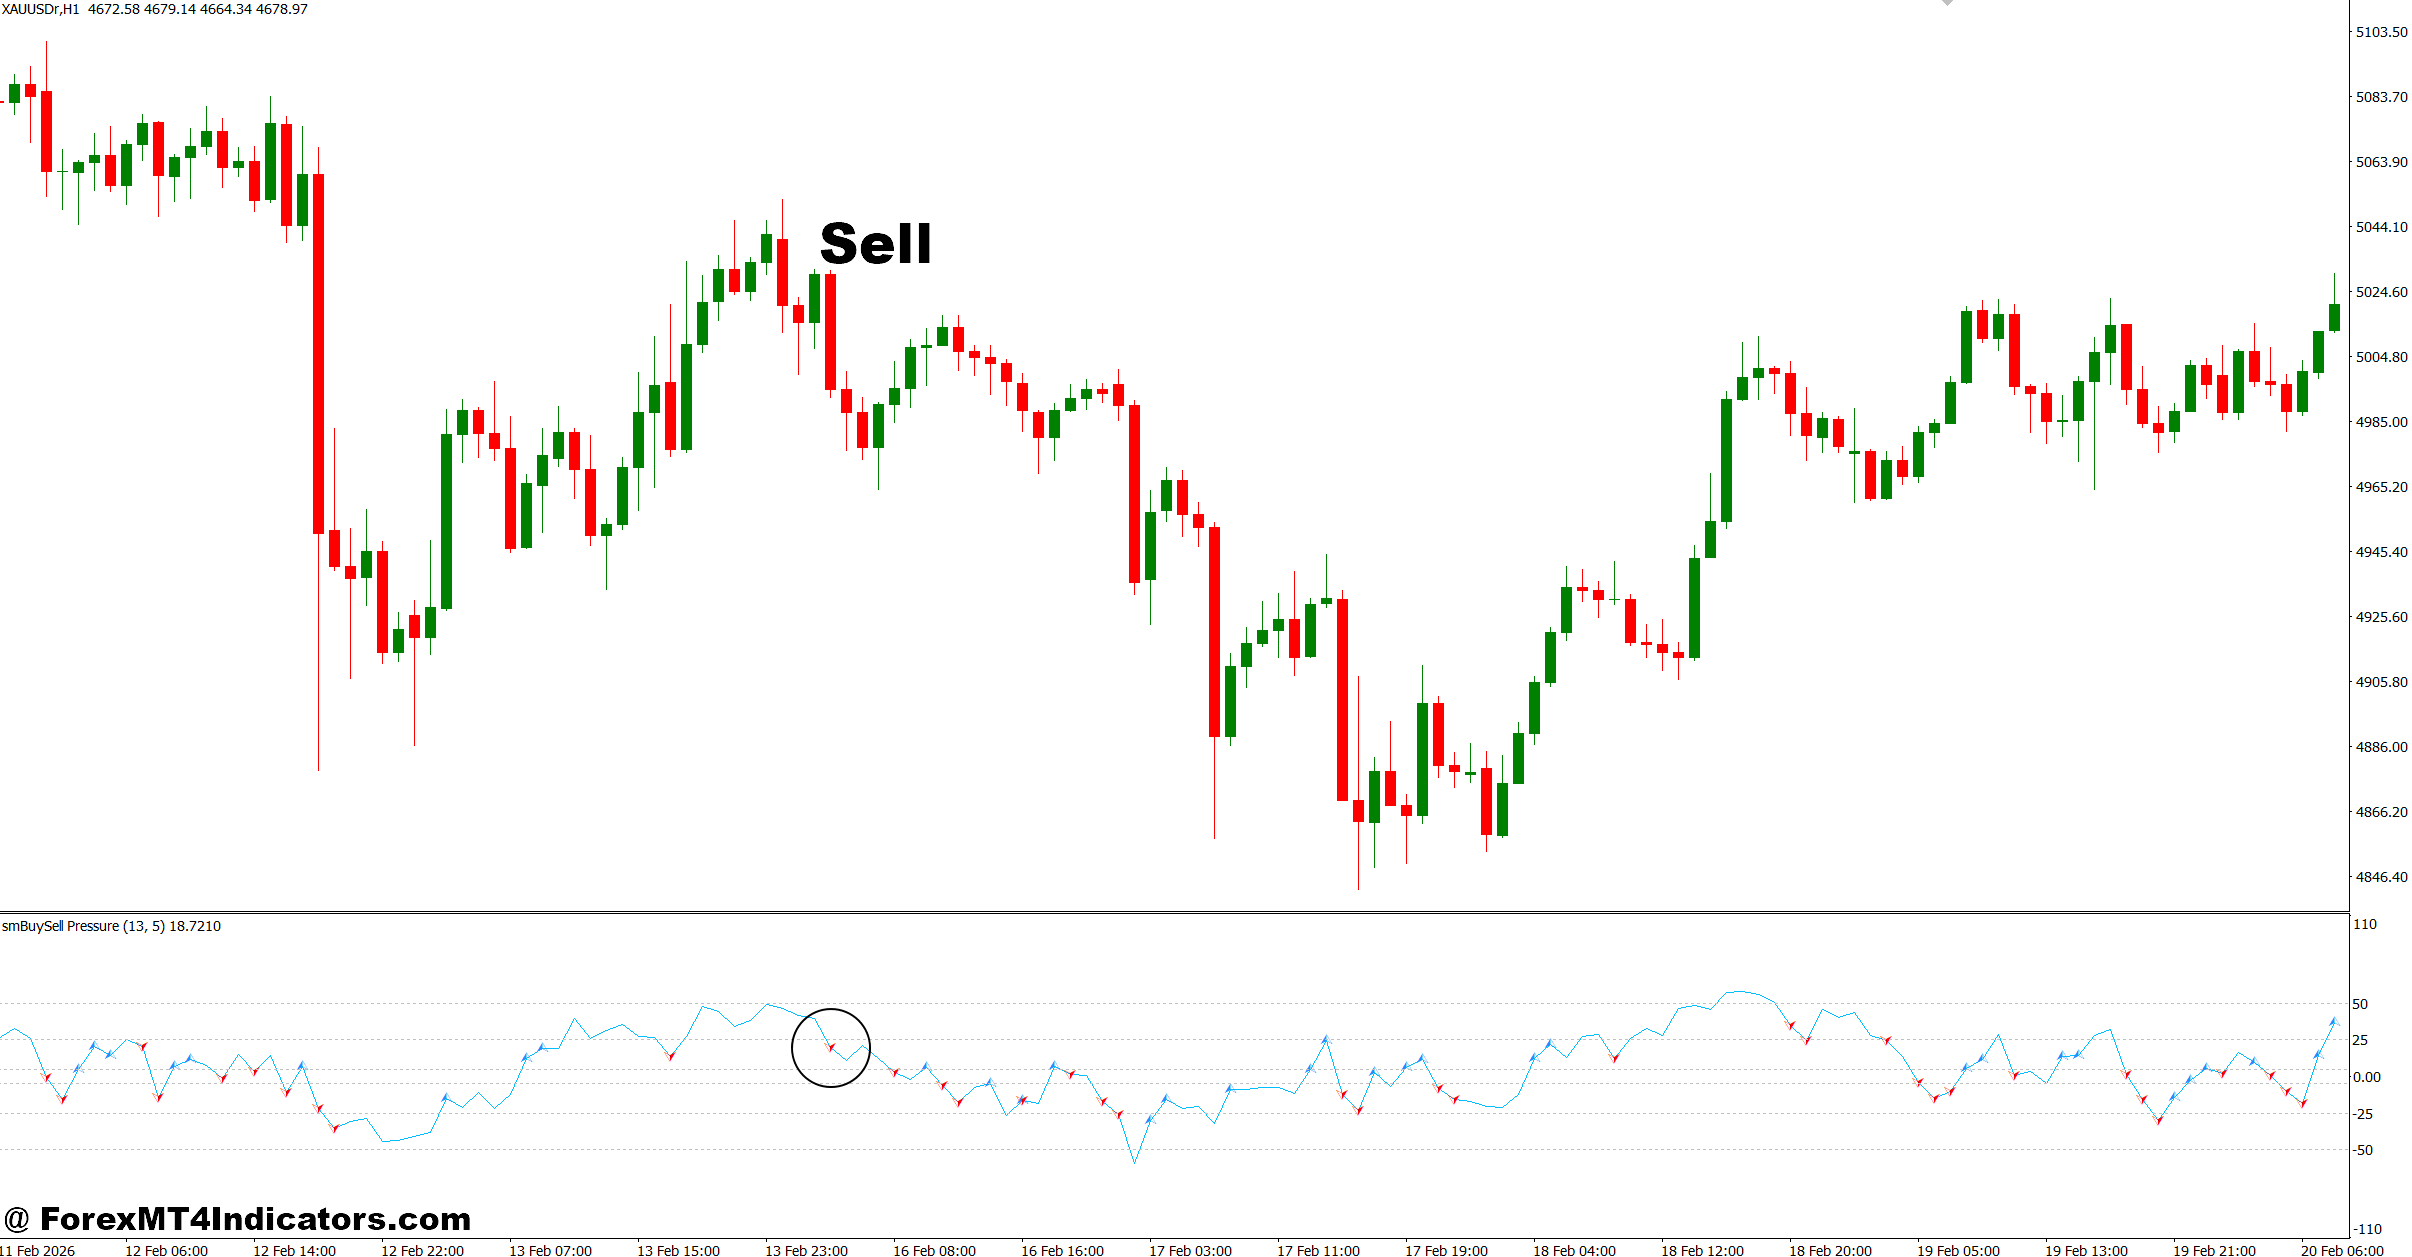
- Wait for selling pressure to increase – Sell when the selling histogram expands on the GBP/USD 1-hour chart.
- Trade below the 50 EMA – Take sell trades only if price remains below the trend filter on the 4-hour chart.
- Sell confirmed breakdowns – Enter after support breaks with strong selling pressure and aim for 30-70 pips.
- Use resistance for entries – Sell near resistance with a 20-35 pip stop-loss above the swing high.
- Confirm with bearish candles – Enter after a bearish engulfing or strong rejection candle appears.
- Limit risk to 1-2% – Protect trading capital even during strong bearish momentum.
- Avoid major news events – Skip sell entries 15-30 minutes before high-impact economic releases.
- Don’t chase extended moves – Avoid selling after a 100+ pip drop without a fresh pullback.
The Buying Selling Pressure Indicator MT4 offers useful insight into the ongoing battle between buyers and sellers, especially when combined with price action and sound trade management. Traders should remember four key points: it measures momentum rather than predicting future prices, it performs best alongside trend confirmation and support or resistance analysis, proper settings depend on the trading timeframe, and risk management matters more than any indicator. Used with discipline, the Buying Selling Pressure Indicator MT4 can improve trade selection and help traders avoid low-quality entries. The goal isn’t finding perfect signals but making better-informed decisions over hundreds of trades instead of judging success from only a few.
Level up your trading
Learn to read the chart — not just the indicator
eBook · Instant PDF
Video Course · 12 modules
Recommended MT4/MT5 Brokers
- ✓ *FREE *$50 to start (withdrawable)
- ✓ Deposit bonus up to $5,000
- ✓ Negative balance protection
Trading forex and CFDs carries a significant risk of loss and is not suitable for everyone. Broker links are affiliate links — we may earn a commission at no cost to you.
Free MT4 Indicator Download

Enter Your Email Address below, download link will be sent to you.
