

The Buyside and Sellside Liquidity Indicator MT5 helps traders visualize these areas directly on the chart. Instead of guessing where stop clusters might be hiding, the indicator highlights potential liquidity pools that institutions often target before real market moves begin. With this information, traders can plan entries more strategically and avoid common traps.
Understanding how this indicator works can improve market timing and provide deeper insight into price action.
What Is the Buyside and Sellside Liquidity Indicator MT5?
The Buyside and Sellside Liquidity Indicator MT5 is a technical analysis tool designed to identify areas where large groups of stop orders may exist in the market. These areas are commonly known as liquidity pools.
In simple terms, the indicator marks:
- Buyside liquidity – areas above recent highs where buy stop orders and short position stop losses accumulate.
- Sellside liquidity – areas below recent lows where sell stop orders and long position stop losses are located.
These levels often act like magnets for price. Market makers and institutional traders frequently push price toward these zones because they provide the order flow needed to execute large trades.
The concept comes from market structure and smart money trading, where liquidity plays a central role in price movement. Instead of focusing only on indicators like moving averages or oscillators, this approach studies where orders are likely sitting in the market.
For example, if the EUR/USD pair forms multiple equal highs on the 1-hour chart, the indicator may highlight that level as a buyside liquidity zone. Traders know that many stop orders are likely placed just above it.
How the Indicator Works in Real Market Conditions
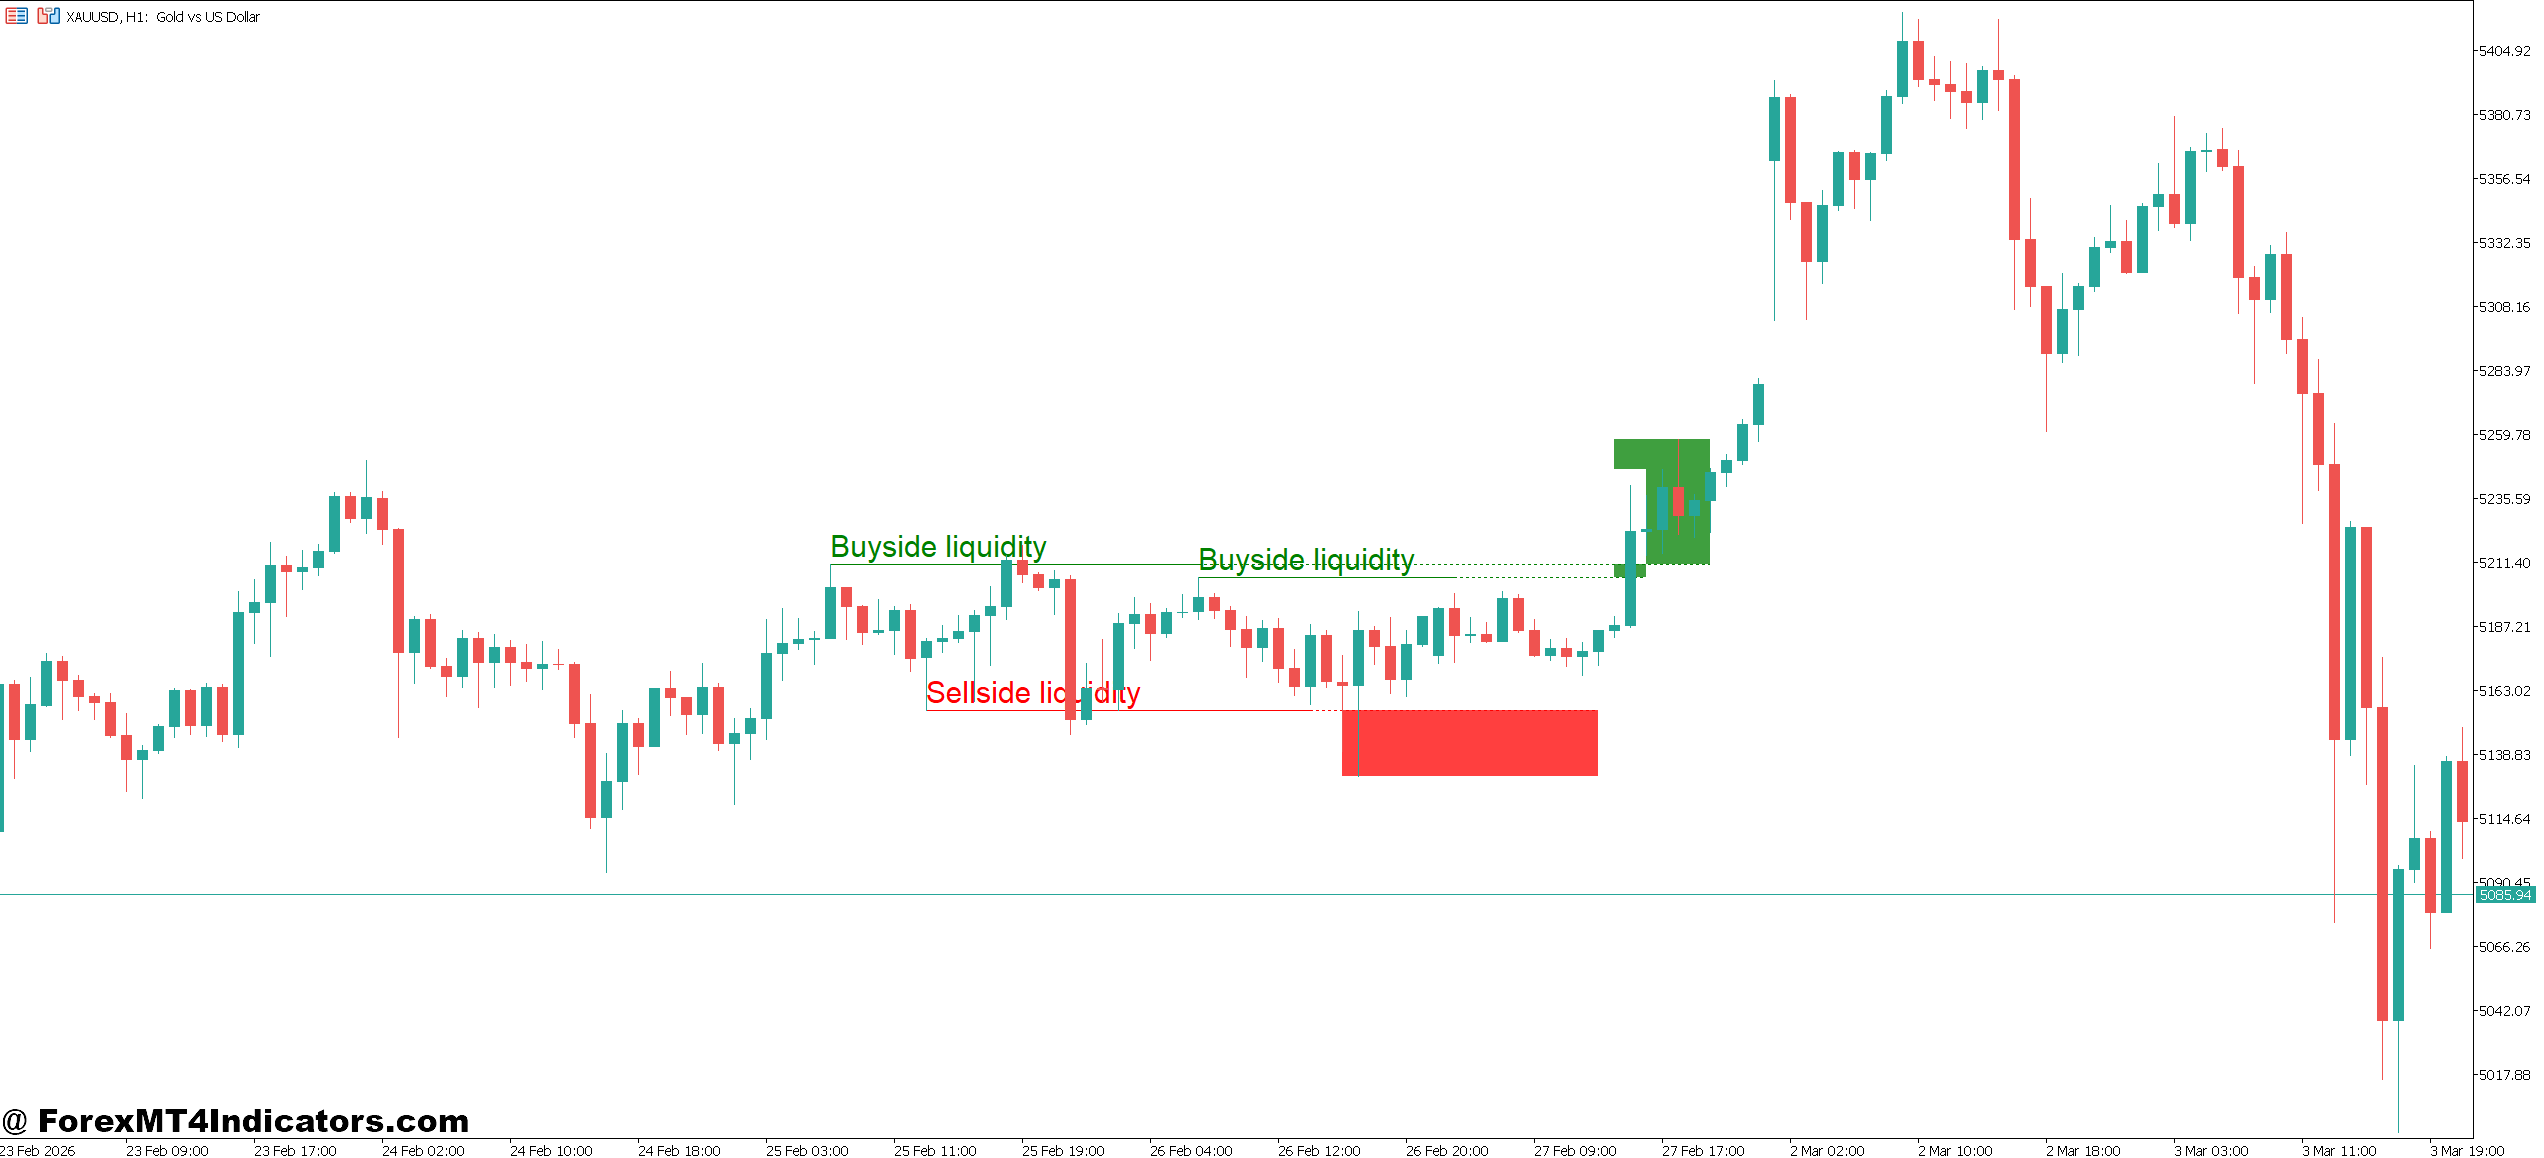
The logic behind the indicator is fairly straightforward but powerful.
It scans historical price data to locate:
- Equal highs or clustered highs
- Equal lows or clustered lows
- Swing points in market structure
When the algorithm detects these structures, it marks them as potential liquidity zones.
For instance, suppose GBP/USD on the 15-minute chart forms three nearly identical highs around 1.2700. The indicator will likely mark that level as buyside liquidity because many traders place buy stop orders slightly above the resistance.
If price later spikes to 1.2705, triggers those stops, and then drops quickly to 1.2670, that move represents a classic liquidity sweep.
During personal testing on volatile sessions—especially around Non-Farm Payroll (NFP) releases—these sweeps occur frequently. Price often grabs liquidity first before choosing a clear direction.
Another common scenario appears on USD/JPY on the 4-hour chart. Price might dip below a recent swing low at 148.50, triggering sell stops. After collecting liquidity, the market may reverse upward toward 149.80.
The indicator doesn’t predict direction on its own. Instead, it highlights areas where strong reactions often happen.
Practical Trading Applications
Liquidity indicators become far more useful when combined with price action.
One common strategy involves waiting for a liquidity sweep before entering a trade.
Example Buy Scenario
On EUR/USD 1-hour chart:
- Price forms equal lows near 1.0850.
- The indicator marks this as sellside liquidity.
- Price briefly drops to 1.0845, triggering stop losses.
- A bullish engulfing candle forms afterward.
A trader may enter a buy trade around 1.0860, placing a stop loss below the sweep at 1.0835 and targeting the next resistance around 1.0920.
Example Sell Scenario
On GBP/USD 30-minute chart:
- Several equal highs form near 1.2750.
- The indicator highlights buyside liquidity.
- Price spikes to 1.2758 during the London session.
- A rejection candle appears.
A short entry near 1.2745 may aim for the previous support at 1.2680.
These setups occur frequently in sessions with strong liquidity, especially London and New York trading hours.
But traders should avoid using the indicator alone. Pairing it with tools like market structure shifts, support/resistance levels, or volume indicators can increase reliability.
Buyside and Sellside Liquidity Indicator MT5 Settings and Customization
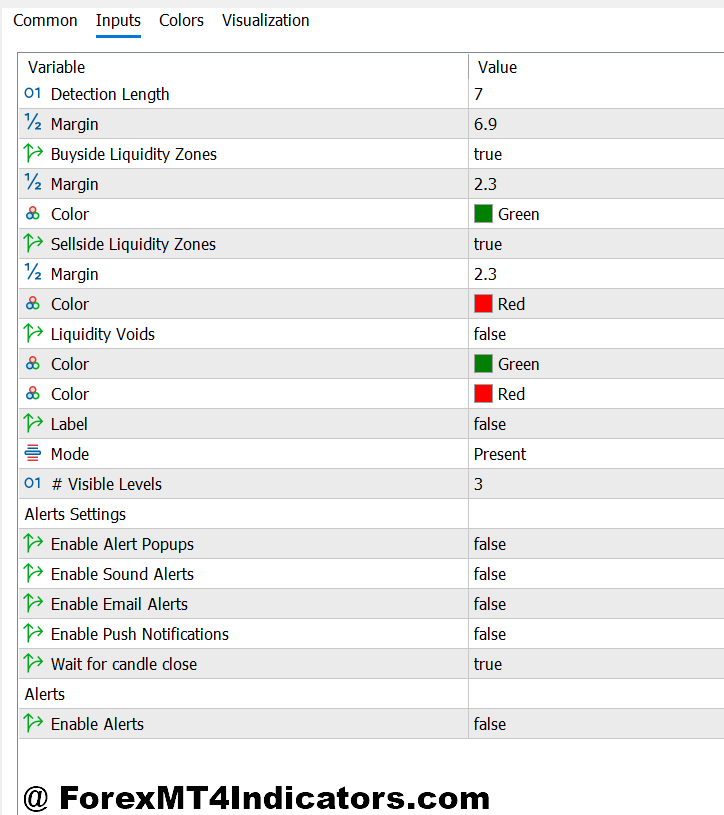
Most versions of the Buyside and Sellside Liquidity Indicator MT5 allow traders to adjust several parameters.
Common settings include:
Lookback period
This determines how far back the indicator scans for highs and lows. A value between 20 and 50 candles works well on intraday charts.
Liquidity sensitivity
Higher sensitivity identifies more liquidity zones. Lower sensitivity filters out minor levels and focuses on stronger structures.
Visual display options
Traders can usually adjust colors or labels for buyside and sellside liquidity. Clear chart visibility helps during fast-moving markets.
For different timeframes:
- Scalping (M5–M15) – shorter lookback periods help identify recent liquidity zones.
- Day trading (M30–H1) – moderate settings capture intraday stop clusters.
- Swing trading (H4–Daily) – larger lookback periods highlight major institutional levels.
During testing on AUD/USD H4 charts, increasing the lookback period often reveals larger liquidity zones that remain relevant for several days.
Advantages and Limitations of the Indicator
No trading tool is perfect. Liquidity indicators offer clear benefits but also have limitations.
Advantages
- Improves market understanding: Instead of relying only on lagging indicators, traders see where stop orders likely exist.
- Helps avoid fake breakouts: Liquidity sweeps often occur before real moves begin.
- Works well with price action strategies: Support and resistance levels align naturally with liquidity zones.
- Provides institutional perspective: The indicator reflects how large players interact with the market.
Limitations
- Does not predict direction: Liquidity can be swept and price may still continue in the same direction.
- Requires confirmation: Price action signals such as rejection candles or structure breaks improve reliability.
- Can create chart clutter: On smaller timeframes, too many zones may appear.
Compared with tools like RSI or Moving Averages, liquidity indicators focus more on market structure rather than momentum or trend.
Many traders combine liquidity analysis with indicators like Volume Profile or Order Blocks to build a more complete strategy.
How to Trade with Buyside and Sellside Liquidity Indicator MT5
Buy Entry
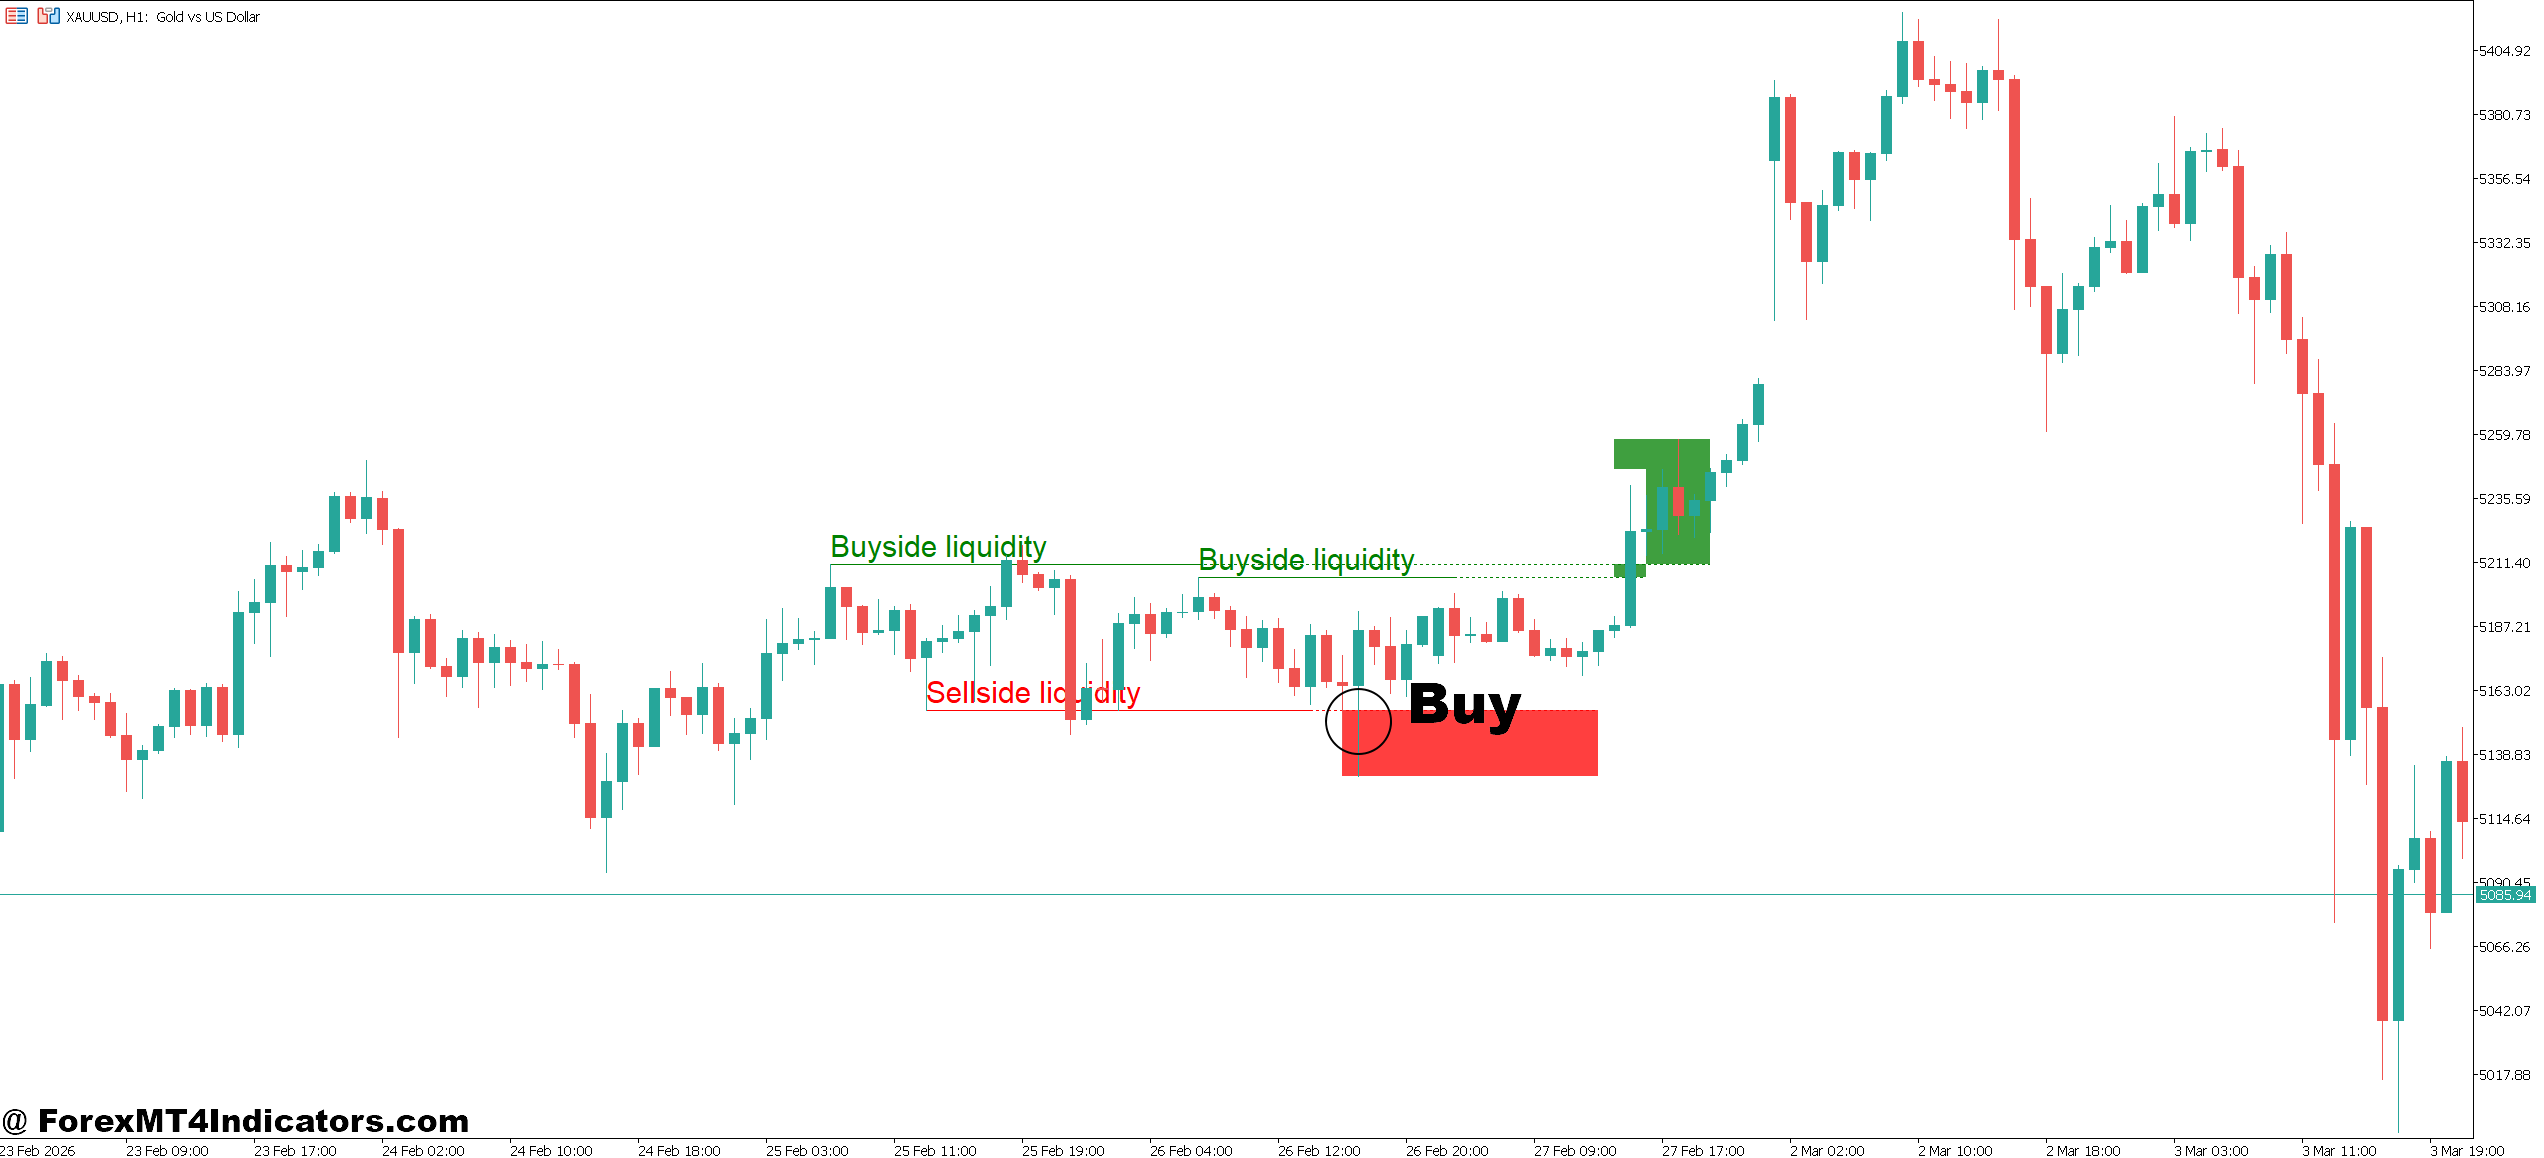
- Wait for a sellside liquidity sweep – Enter a buy trade after price dips 5–15 pips below a recent swing low on pairs like EUR/USD (1-hour chart) and quickly closes back above the level, showing that stop losses were taken before a potential reversal.
- Confirm with a strong bullish candle – Take a buy when a bullish engulfing or momentum candle closes 10–20 pips above the liquidity level on the GBP/USD 30-minute or 1-hour chart, signaling buyers stepping in.
- Use support near liquidity zones – Enter if sellside liquidity appears near a daily support level and price rejects it with long lower wicks; place a 20–30 pip stop loss below the sweep.
- Combine with market structure shift – Buy only after price sweeps liquidity and then breaks a recent lower high on the 1-hour timeframe, confirming that momentum has changed.
- Trade during high-liquidity sessions – Look for these setups during London or New York sessions, when sweeps of 10–25 pips are more reliable compared to quiet Asian market conditions.
- Target nearby buyside liquidity – Set take profit near the next liquidity zone, often 30–60 pips away on EUR/USD H1 charts, where price may react again.
- Avoid entries in strong downtrends – Do not buy if the 4-hour trend is strongly bearish and price keeps making lower lows; liquidity sweeps in strong trends often lead to continuation.
- Limit risk per trade – Risk 1–2% of account balance and avoid chasing the move if price already traveled 25+ pips after the liquidity sweep.
Sell Entry
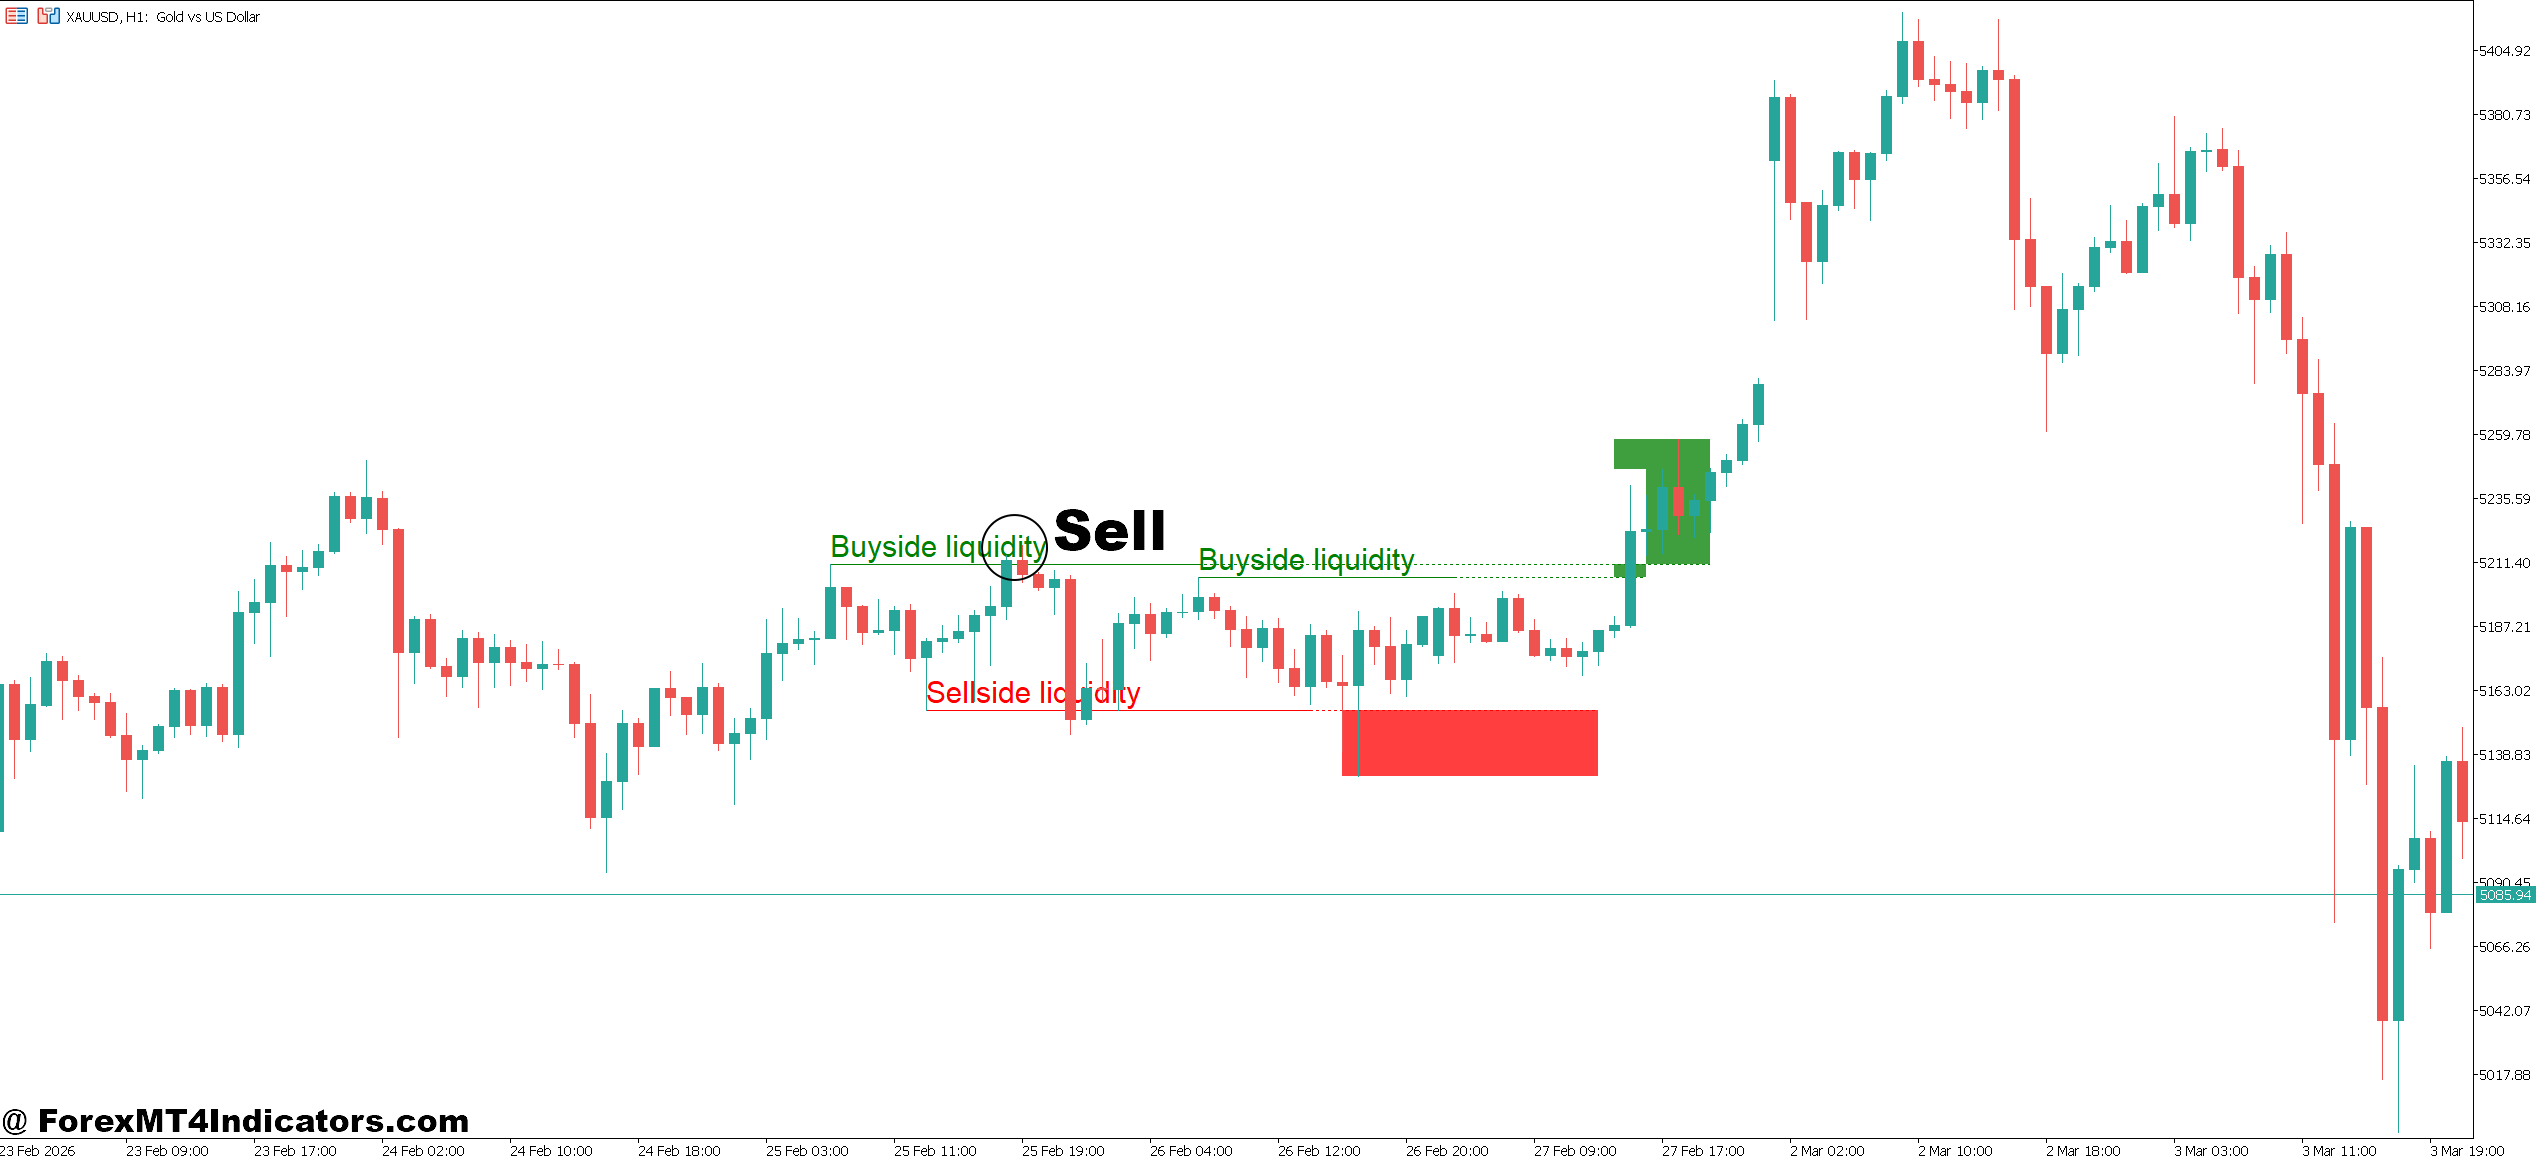
- Wait for a buyside liquidity grab – Enter a sell trade when price spikes 8–20 pips above equal highs on GBP/USD 1-hour charts, triggering buy stops before showing rejection.
- Look for bearish rejection candles – Sell when a pin bar or bearish engulfing candle closes below the liquidity level after the spike, indicating sellers regained control.
- Confirm with resistance alignment – Take the trade if the buyside liquidity zone aligns with a 4-hour resistance level or previous daily high, improving the probability of a reversal.
- Use a clear stop loss above the sweep – Place the stop 15–30 pips above the liquidity spike, allowing room for volatility but protecting against continued breakouts.
- Watch for momentum shift – Enter only after price breaks a recent higher low on the 30-minute or 1-hour chart, confirming the shift toward bearish momentum.
- Target sellside liquidity below – Aim for the next cluster of lows, often 40–70 pips lower on EUR/USD H1 setups, where price may collect sell stops next.
- Avoid trades during major news spikes – Skip signals during events like NFP or CPI, where liquidity sweeps of 40–80 pips can create unpredictable moves.
- Manage trade size carefully – Keep risk around 1–2% per trade and consider partial profit at 25–35 pips to protect gains if the market turns choppy.
Conclusion
The Buyside and Sellside Liquidity Indicator MT5 gives traders a clearer view of where the market may seek stop orders before making its next move. Rather than entering trades blindly at support or resistance, traders can observe how price interacts with liquidity zones.
Key takeaways include understanding that liquidity often sits above equal highs and below equal lows, recognizing that price frequently sweeps these areas before reversing, combining the indicator with price action confirmation, and adjusting settings to match the trading timeframe.
Trading forex carries substantial risk. No indicator guarantees profits, and liquidity sweeps can still lead to unexpected price movements.
Used carefully, this tool can help traders interpret market behavior more realistically. Observing how price reacts to liquidity zones over several weeks of chart time often reveals patterns that many beginners overlook.
Level up your trading Learn to read the chart — not just the indicator eBook · Instant PDF Video Course · 12 modules Trading forex and CFDs carries a significant risk of loss and is not suitable for everyone. Broker links are affiliate links — we may earn a commission at no cost to you.Recommended MT4/MT5 Brokers
Free MT4 Indicator Download

Enter Your Email Address below, download link will be sent to you.