

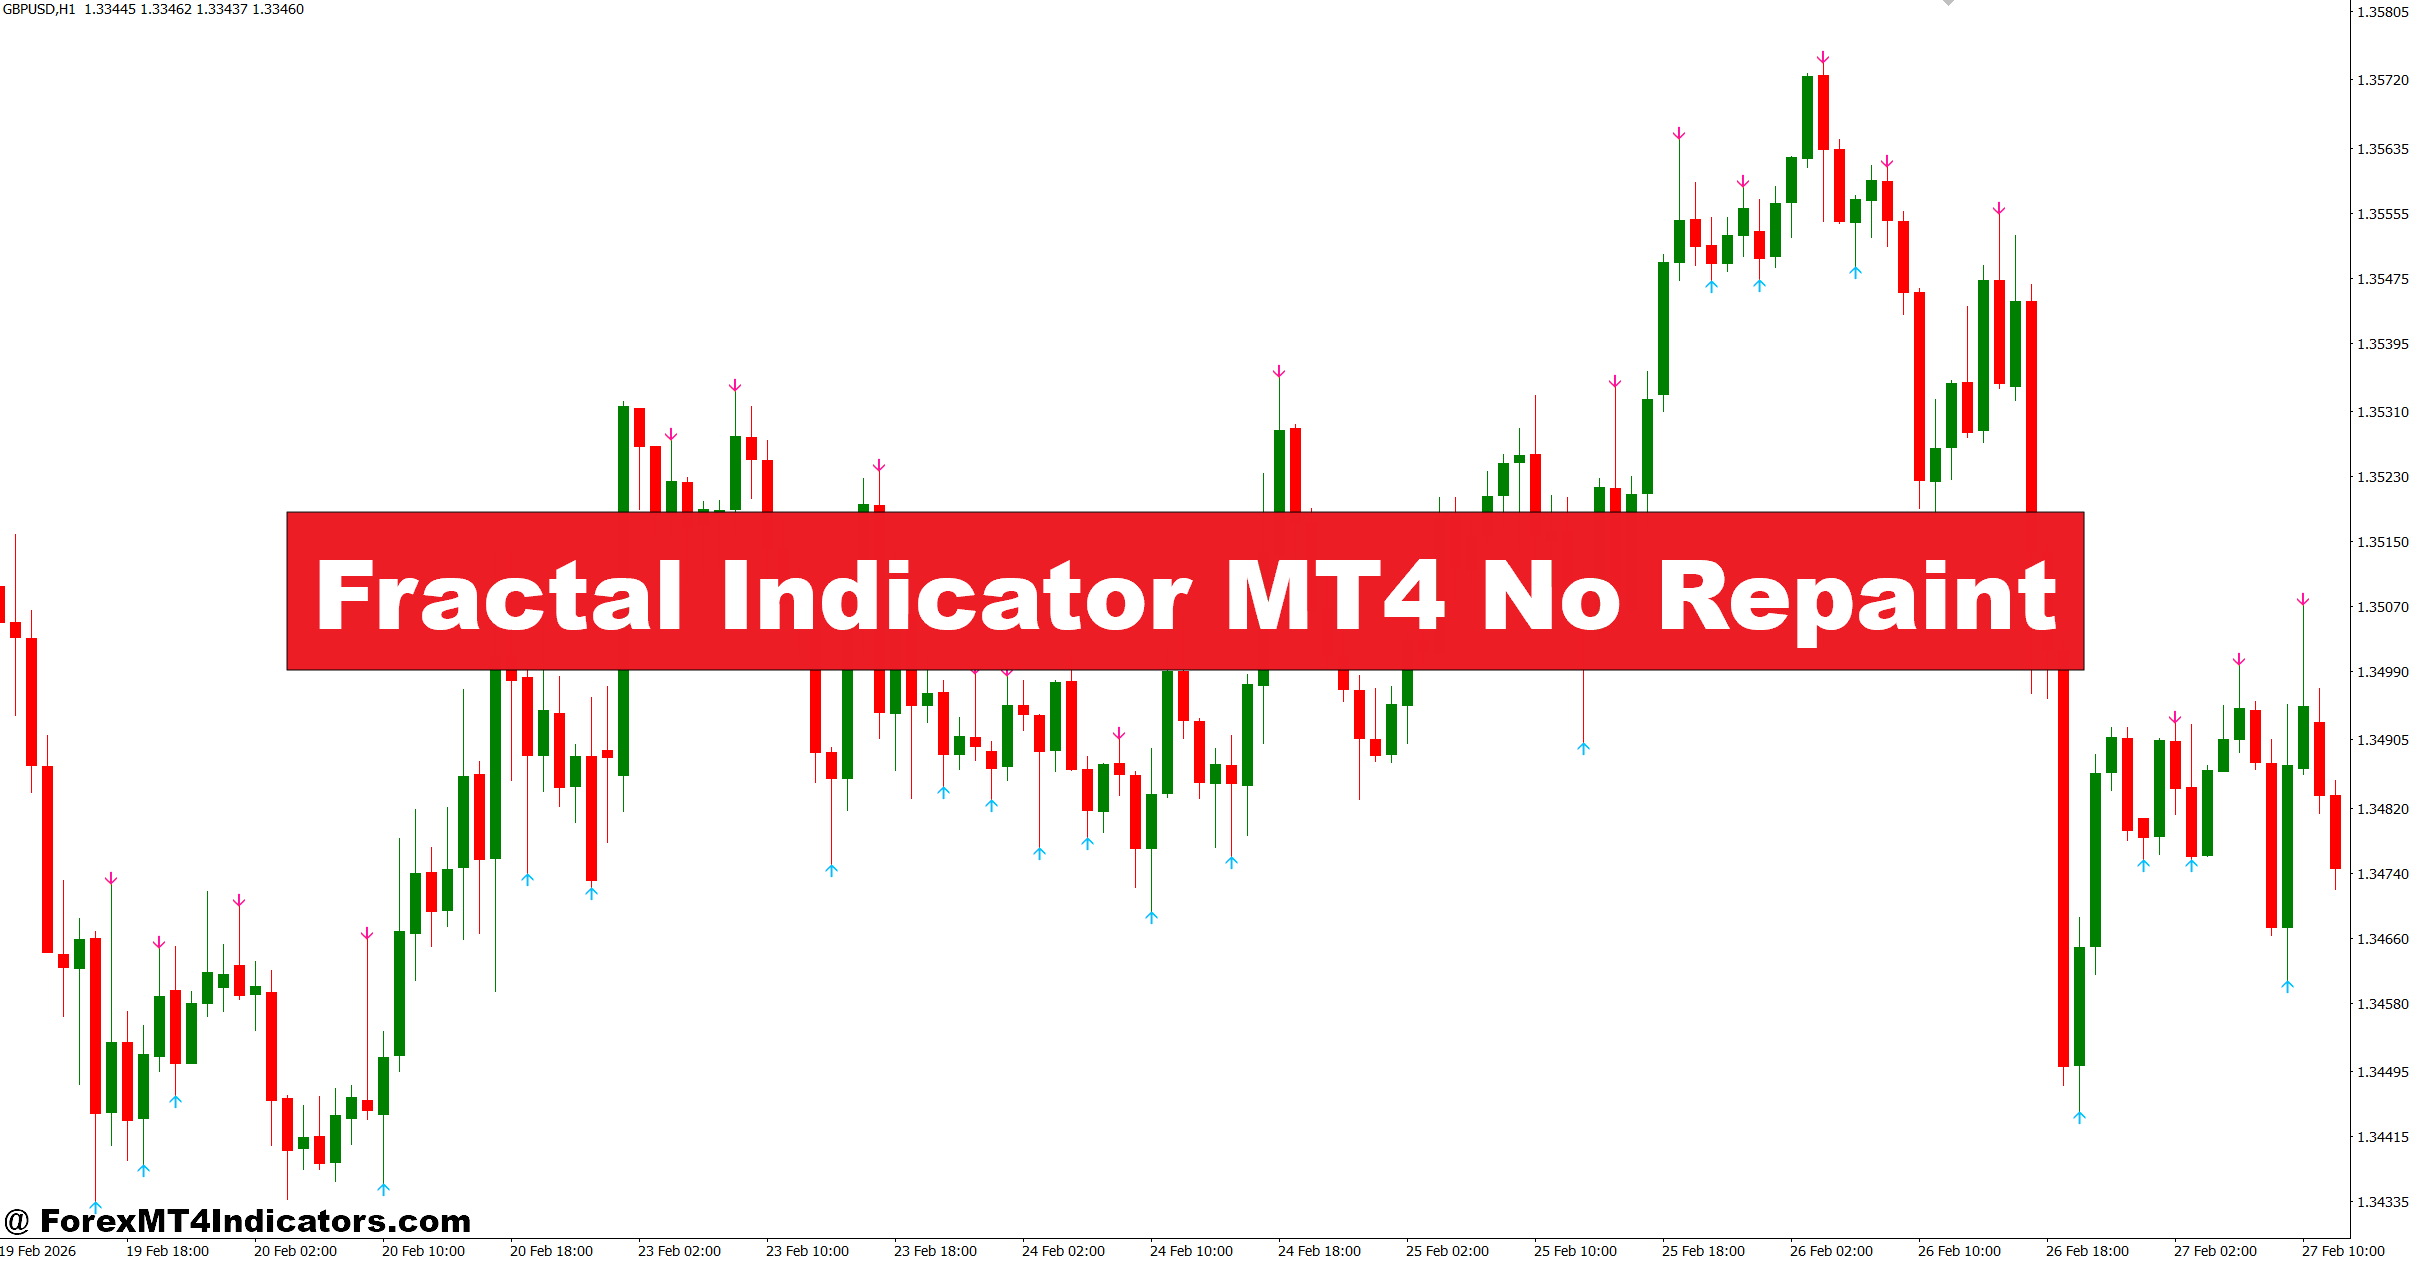
The Fractal Indicator MT4 No Repaint offers a more structured approach by marking confirmed market swings after price has completed its pattern. While it doesn’t predict the future, it helps traders recognize areas where trend continuation or reversals deserve closer attention. The sections below explain how the indicator works, where it performs best, and how traders can fit it into a practical trading plan.
Understanding the Fractal Indicator MT4 No Repaint
The Fractal Indicator is based on a simple market principle: price moves in waves. Every trend creates higher highs, lower lows, and temporary pullbacks. The indicator identifies these swing points by checking five consecutive candles.
A bullish fractal forms when the middle candle has the lowest low, with two higher lows on each side. A bearish fractal appears when the middle candle has the highest high, surrounded by two lower highs.
The “No Repaint” version waits until the pattern is fully confirmed before displaying the signal. Once the fractal appears, it remains fixed on the chart. This is an important improvement because traders don’t have to worry about arrows disappearing after the candle closes.
Many traders use fractals as dynamic support and resistance markers rather than direct buy or sell signals. The indicator becomes even more useful when combined with trend analysis or momentum tools.
How the Indicator Calculates Market Swings
Unlike oscillators that rely on mathematical smoothing, the Fractal Indicator focuses entirely on price structure.
Here’s how the calculation works:
- Five candles are required to complete one fractal.
- The third candle becomes the reference point.
- If that candle has the highest high, a bearish fractal forms.
- If it has the lowest low, a bullish fractal forms.
- The signal only appears after two additional candles close, confirming the pattern.
This confirmation process naturally creates a slight delay. Some traders see that as a weakness, but experienced traders often consider it an advantage because it filters out many premature reversal signals.
For example, GBP/USD on the 4-hour chart may produce several temporary highs during the London session. The indicator ignores those until the full five-candle structure confirms the swing. That extra patience often reduces fake-outs.
During strong trends, fractals usually appear in the direction of the prevailing move. In sideways markets, they may alternate frequently, so traders should pay closer attention to higher-timeframe market structure before acting.
Using Fractals in Real Trading Situations
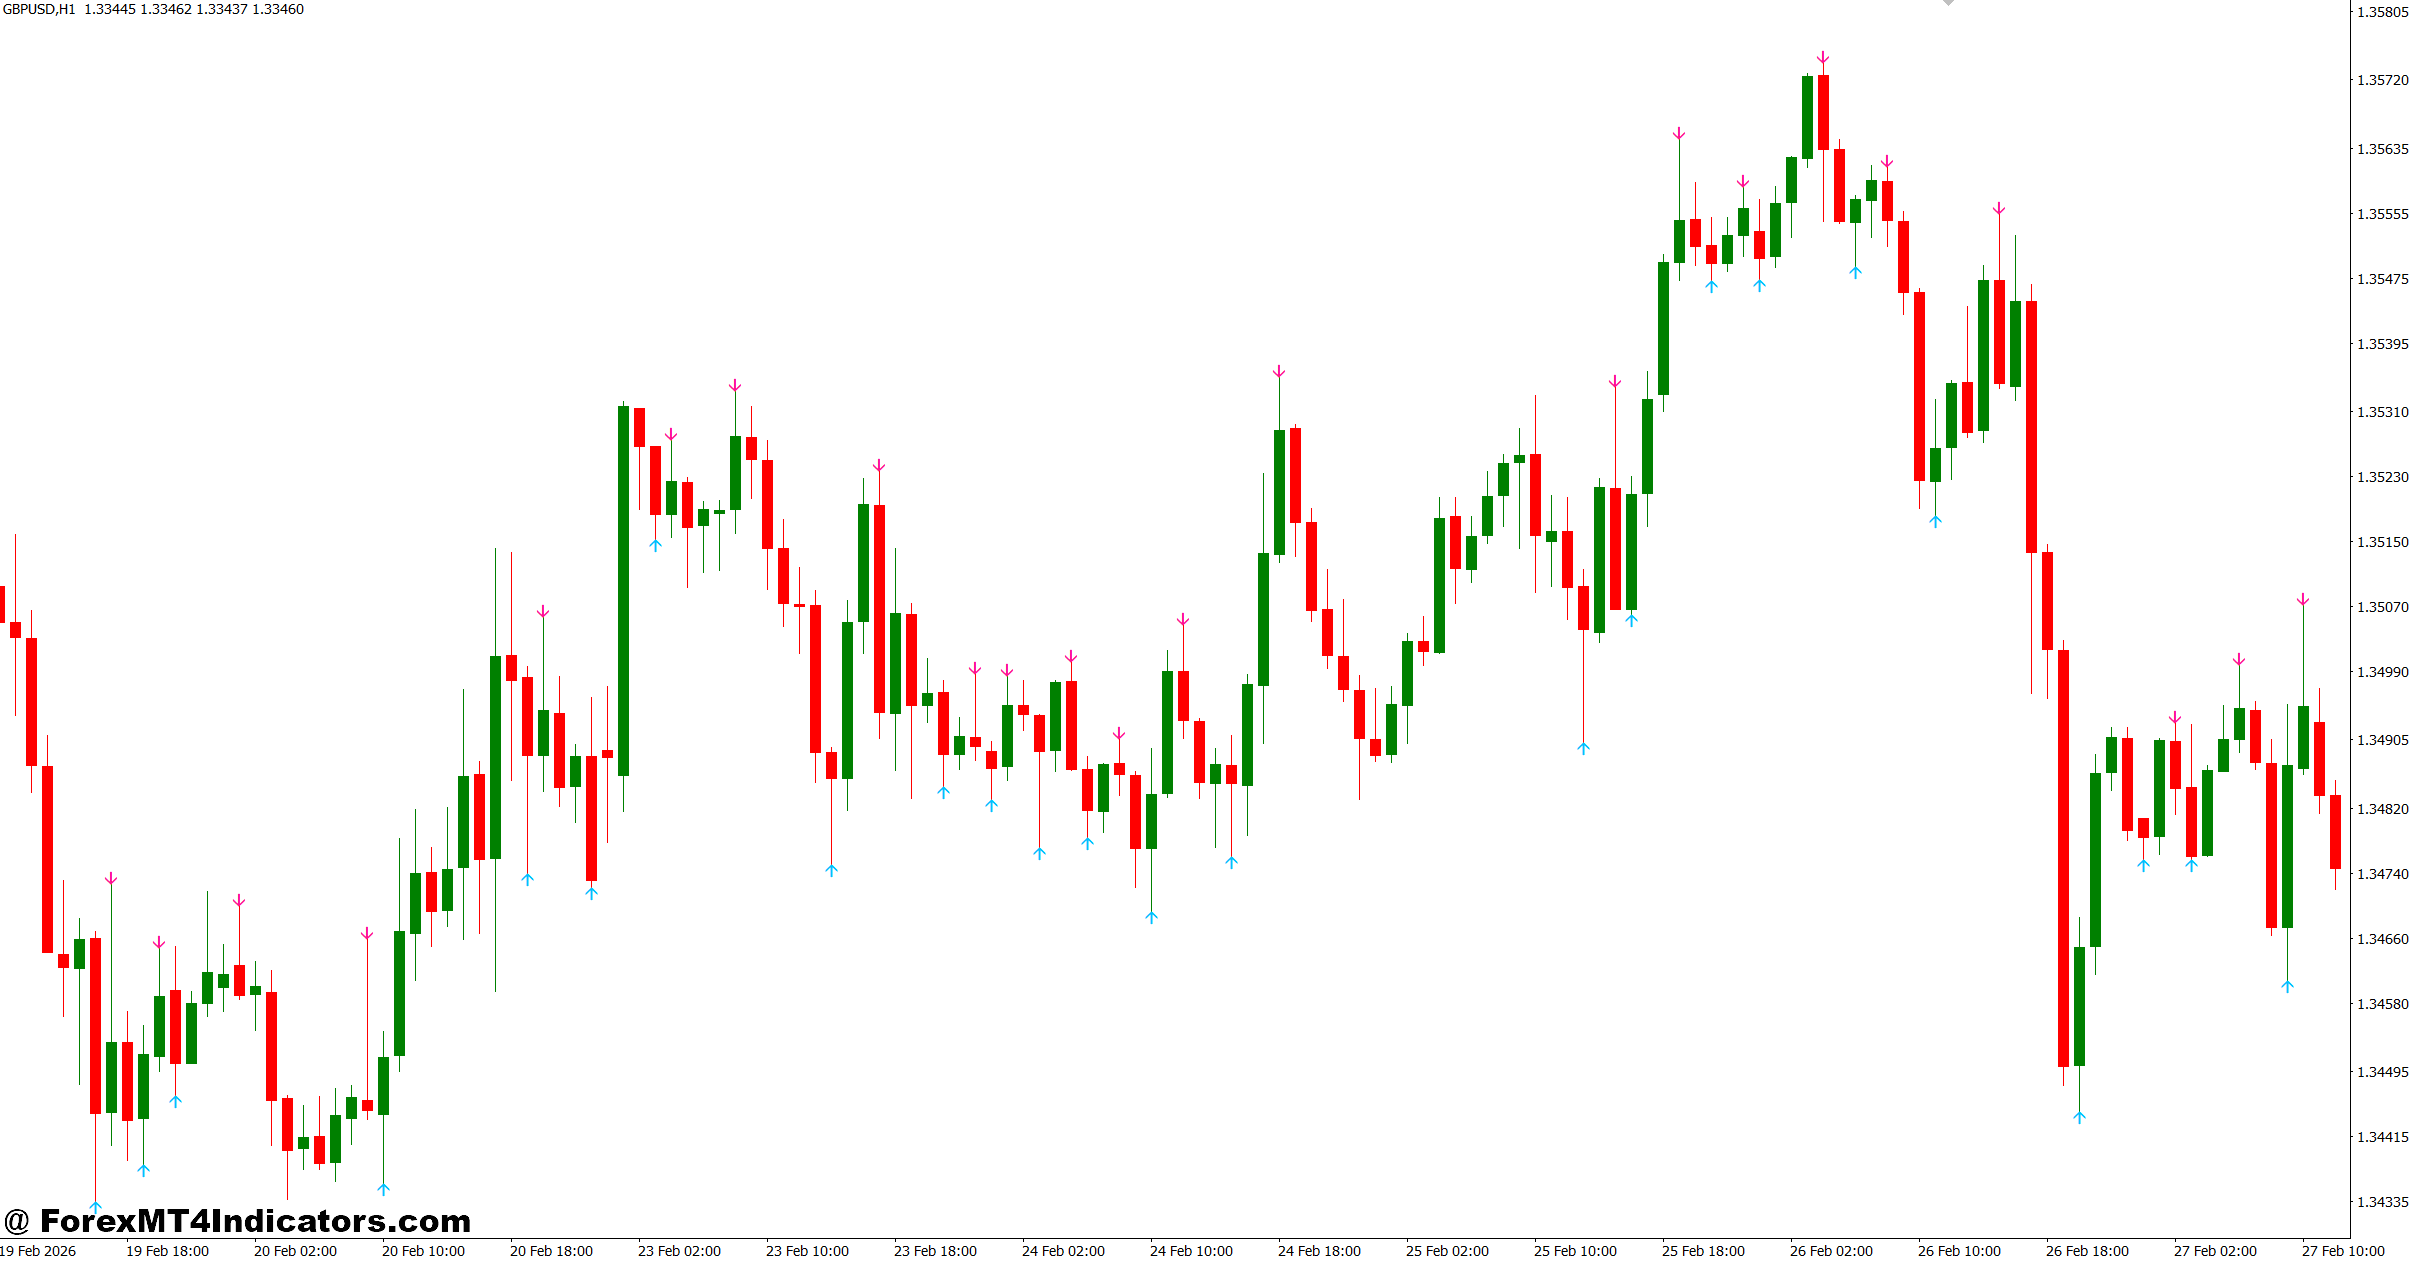
Many traders don’t use fractals alone. Instead, they combine them with moving averages, trendlines, or support and resistance zones.
Consider a practical example.
EUR/USD is trading above the 200 EMA on the 1-hour chart. The market pulls back approximately 35 pips before printing a bullish fractal near an existing support level. RSI remains above 50, suggesting buyers still control momentum. Instead of entering during the decline, the trader waits for price to break above the high of the bullish fractal. The trade then targets the previous swing high around 55 pips away while placing the stop-loss roughly 20 pips below the fractal low.
That confirmation reduces emotional entries.
Another example appears on USD/JPY during an established downtrend. A bearish fractal develops below a descending trendline after price rejects resistance. Once the next candle breaks below the fractal low, sellers gain additional confirmation that the trend may continue.
When testing this indicator during volatile Non-Farm Payroll releases, many traders notice that waiting for the news candle to close before trusting new fractals produces more consistent results. Large news spikes often create temporary swings that lose significance within minutes.
Trading forex carries substantial risk. No indicator guarantees profits. Proper position sizing and stop-loss placement remain essential regardless of the setup.
Best Settings and Customization Tips
Most No Repaint Fractal indicators don’t require many adjustments because the calculation follows Bill Williams’ original concept. Still, traders can customize how the signals appear on MT4.
Scalping
For 5-minute and 15-minute charts:
- Combine fractals with the 50 EMA.
- Focus only on London and New York sessions.
- Ignore signals during low-volume Asian session ranges.
Intraday Trading
On 1-hour charts:
- Pair the indicator with the 200 EMA.
- Confirm entries using MACD or RSI.
- Look for at least a 1:2 risk-to-reward ratio before entering.
Swing Trading
On the 4-hour and Daily charts:
- Use fractals to identify major swing points.
- Draw horizontal support and resistance from confirmed fractals.
- Wait for candle closes instead of entering immediately after a signal appears.
Currency pairs also matter. EUR/USD and GBP/USD generally produce cleaner fractal structures than highly volatile pairs such as GBP/JPY, where rapid price swings can generate more frequent signals.
Advantages, Limitations, and Comparison with Similar Indicators
The biggest strength of the Fractal Indicator MT4 No Repaint is its reliability after confirmation. Traders know the signal won’t disappear later, making chart analysis more consistent.
Another advantage is simplicity. The indicator works with almost every trading style and doesn’t overload the chart with unnecessary information.
But there are trade-offs.
Since confirmation requires two additional candles, entries happen later than they would with aggressive reversal indicators. Fast-moving trends may already cover 15 to 30 pips before the fractal becomes visible.
The indicator also struggles during choppy markets where price constantly changes direction. In these conditions, traders may see several alternating fractals without any meaningful trend developing.
Compared with the ZigZag indicator, fractals react sooner but identify smaller market swings. ZigZag highlights larger structural moves but often repaints until price fully develops.
Compared with Pivot Points, fractals are based entirely on current price action instead of mathematical support and resistance levels derived from previous sessions.
Against moving averages, fractals provide precise swing locations instead of overall trend direction. Many experienced traders combine both tools because each fills a different role in market analysis.
The strongest setups usually appear when a confirmed fractal aligns with trend direction, support or resistance, and momentum confirmation from another technical indicator.
How to Trade with Fractal Indicator MT4 No Repaint
Buy Entry
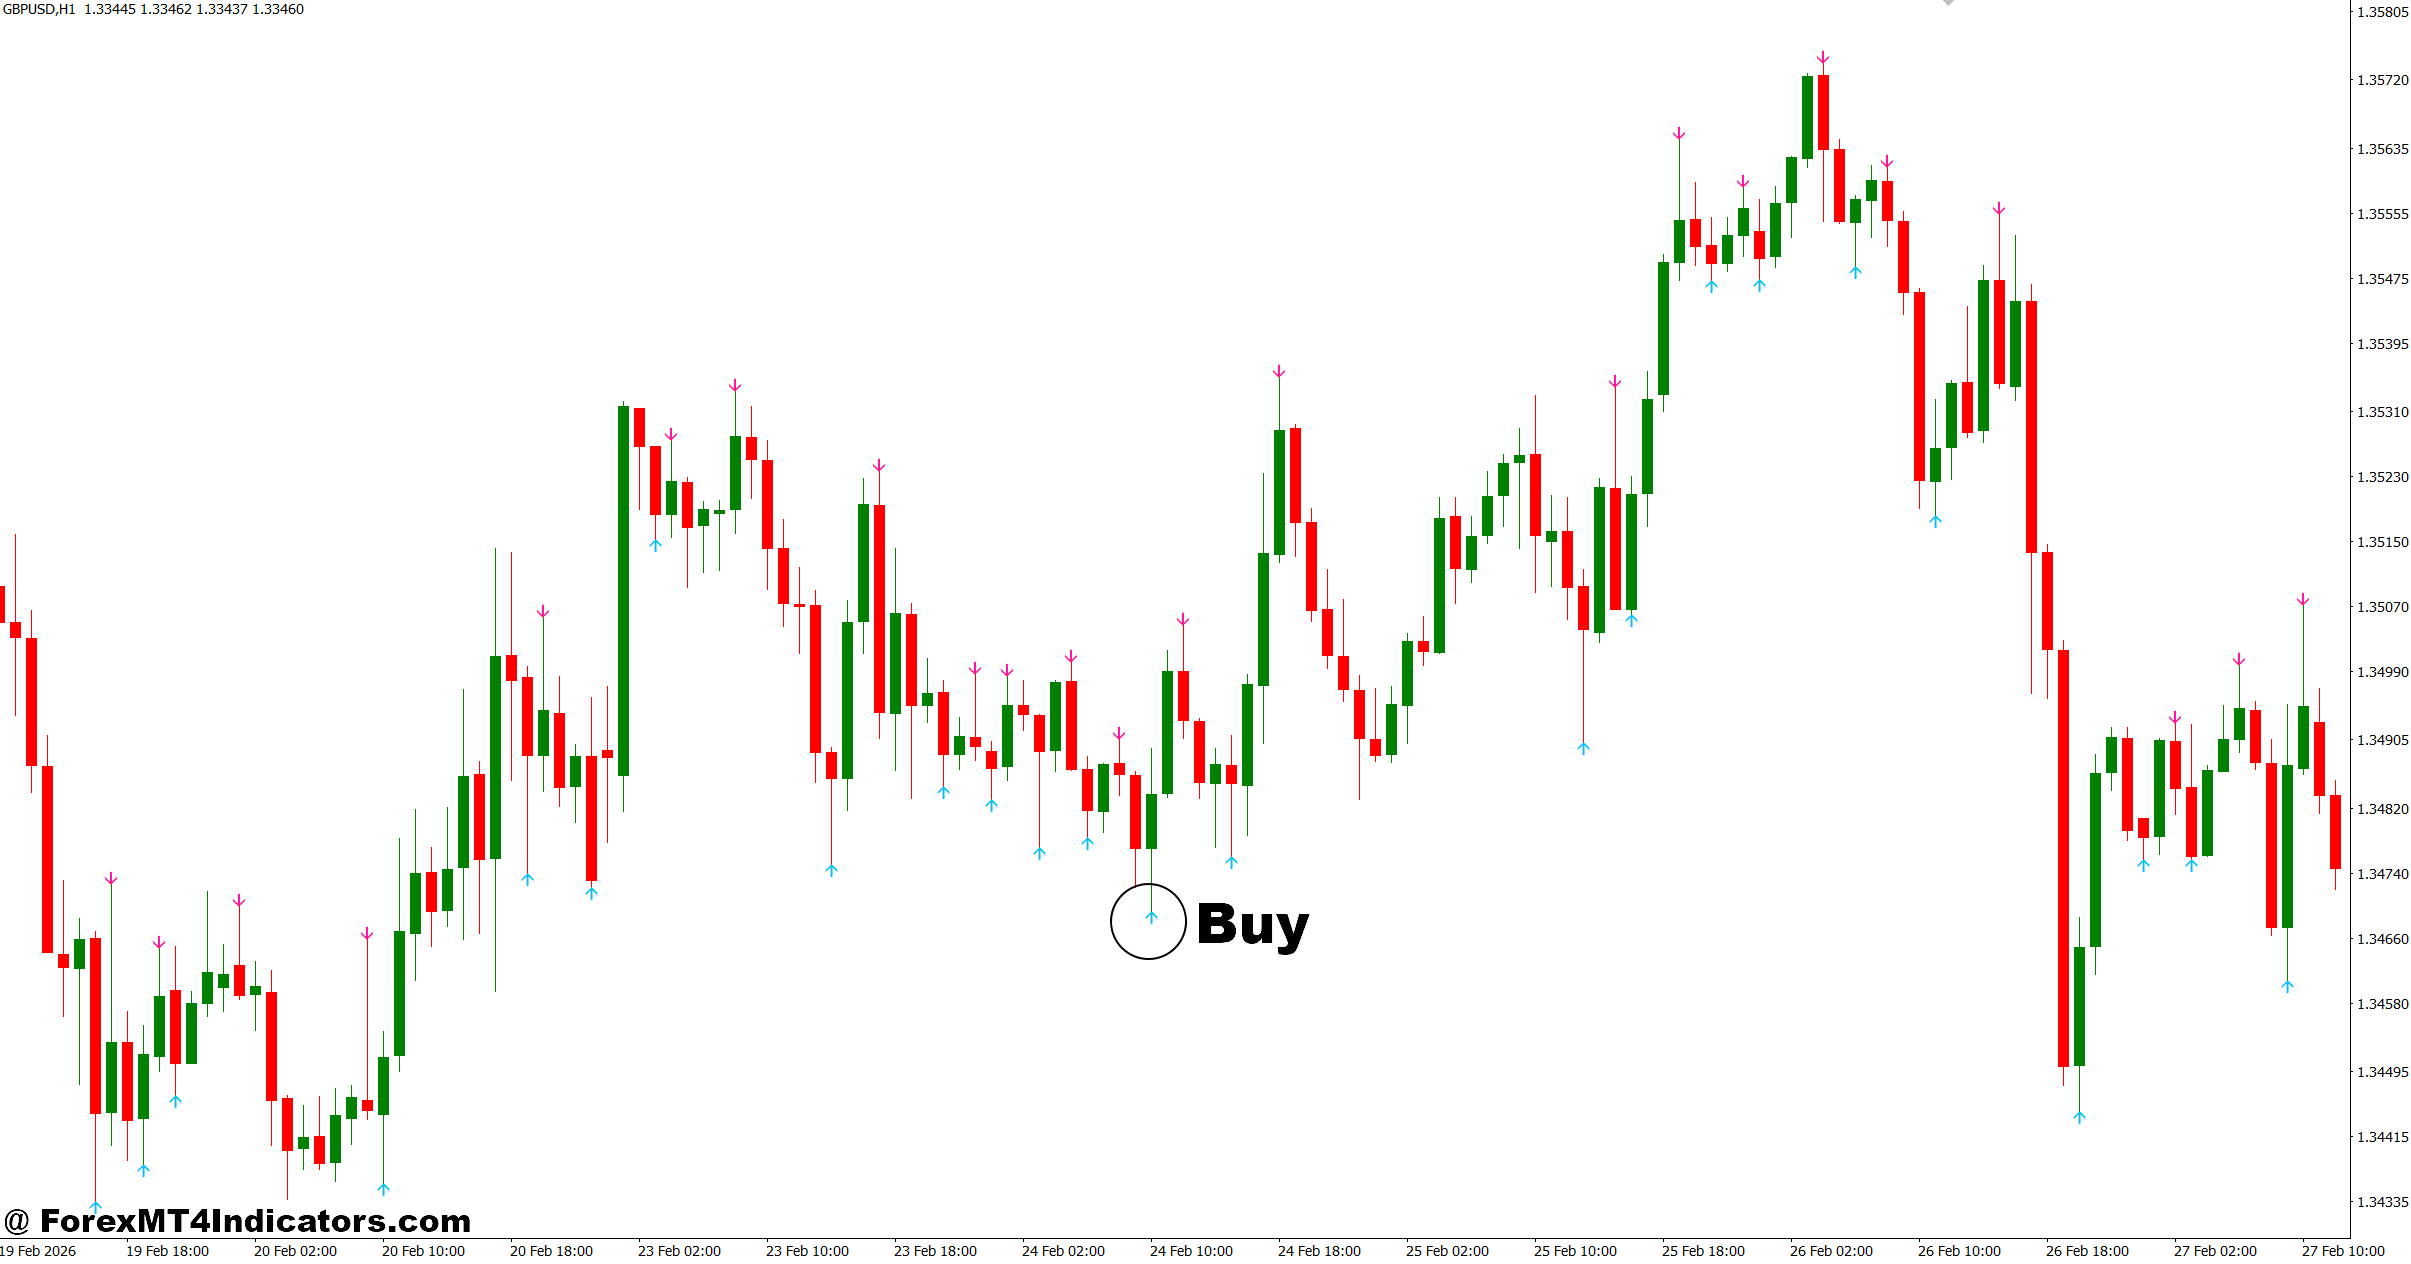
- Wait for a bullish fractal – Buy after price closes above the latest bullish fractal on the EUR/USD 1-hour chart.
- Trade with the trend – Only take buy signals when price stays above the 200 EMA on the 4-hour timeframe.
- Confirm with support – Enter if the bullish fractal forms near a strong support zone, aiming for 30-60 pips.
- Use RSI confirmation – Buy only if the 14-period RSI is above 50 after the fractal appears.
- Place a tight stop-loss – Set the stop 10-20 pips below the bullish fractal low.
- Target a healthy reward – Look for at least a 1:2 risk-to-reward ratio before entering.
- Avoid major news – Skip buy signals during NFP, CPI, or FOMC releases because volatility can create false setups.
- Manage your risk – Risk only 1-2% of your account on a single trade.
Sell Entry
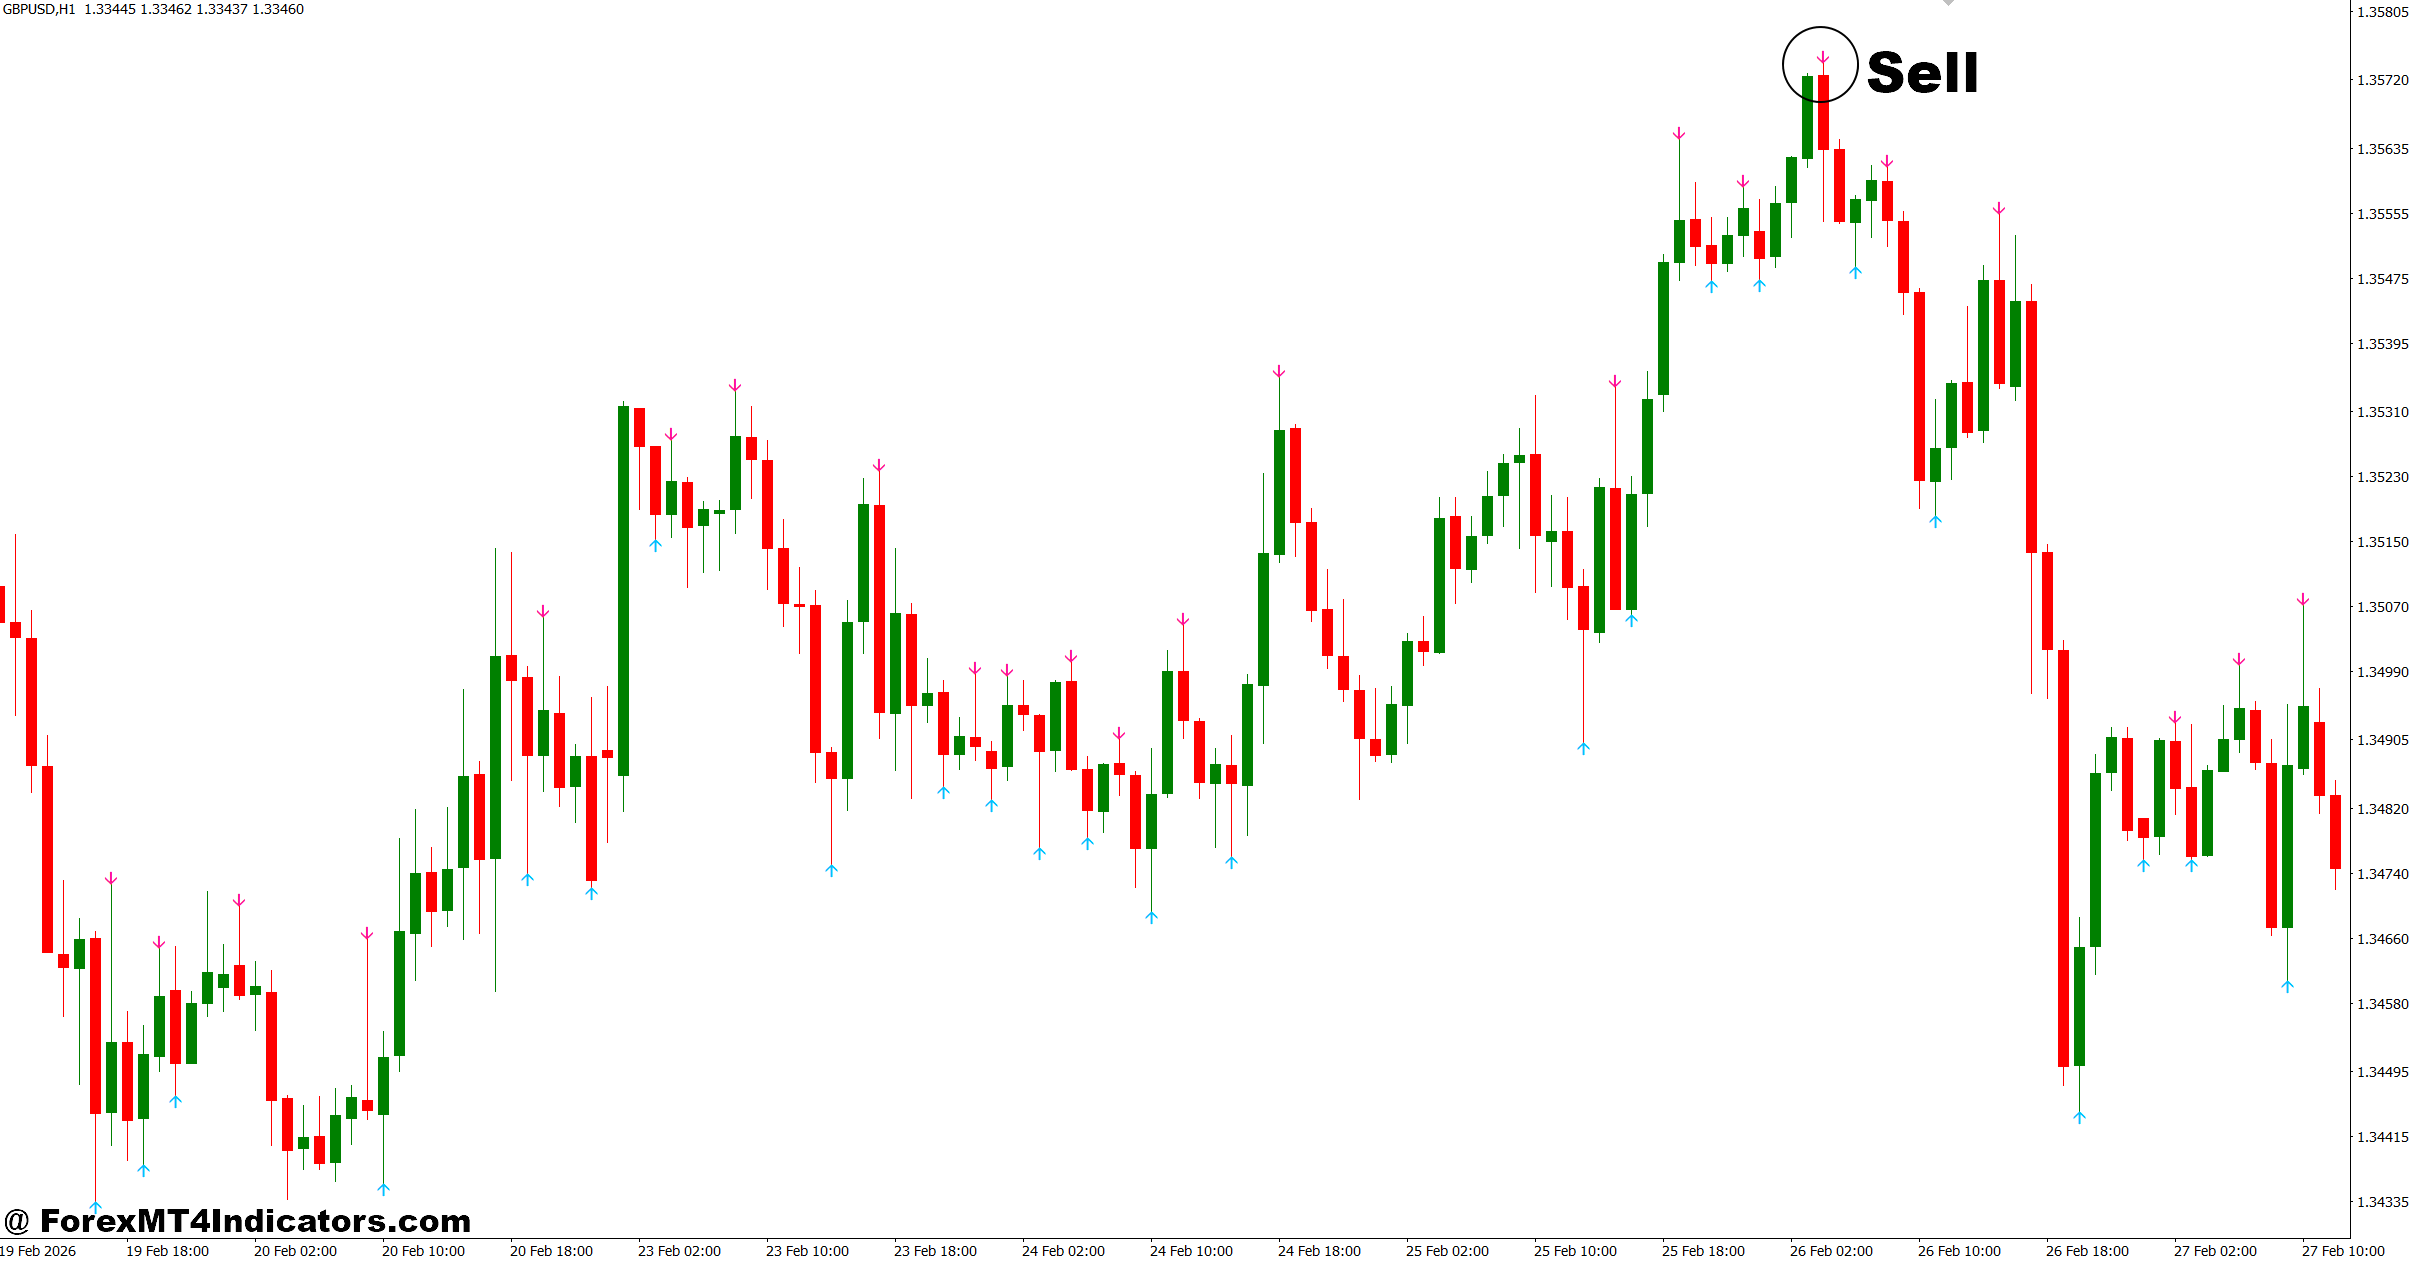
- Wait for a bearish fractal – Sell after price closes below the latest bearish fractal on the GBP/USD 1-hour chart.
- Follow the downtrend – Take sell entries only when price remains below the 200 EMA on the 4-hour chart.
- Sell near resistance – Enter if the bearish fractal forms at a resistance level with a 30-70 pip downside target.
- Check RSI weakness – Sell when the 14-period RSI stays below 50 after confirmation.
- Protect the trade – Place the stop-loss 10-20 pips above the bearish fractal high.
- Lock in good rewards – Aim for a minimum 1:2 risk-to-reward ratio before opening the trade.
- Avoid ranging markets – Don’t sell when price moves sideways because frequent fractals can create false signals.
- Control position size – Keep risk between 1-2% per trade and move the stop to breakeven after 20-30 pips in profit.
The Fractal Indicator MT4 No Repaint gives traders a practical way to identify confirmed swing highs and lows without worrying about disappearing signals. It helps improve market structure analysis, works well alongside moving averages and support or resistance levels, reduces many early reversal entries through confirmation, and fits both intraday and swing trading strategies. That said, it isn’t designed to work as a standalone trading system. Like any technical analysis tool, it performs best when combined with sound risk management and broader market context. Traders who spend time reviewing historical charts and practicing with the Fractal Indicator MT4 No Repaint often gain a better understanding of price structure, leading to more disciplined trading decisions over time.
Level up your trading
Learn to read the chart — not just the indicator
eBook · Instant PDF
Video Course · 12 modules
Recommended MT4/MT5 Brokers
- ✓ *FREE *$50 to start (withdrawable)
- ✓ Deposit bonus up to $5,000
- ✓ Negative balance protection
Trading forex and CFDs carries a significant risk of loss and is not suitable for everyone. Broker links are affiliate links — we may earn a commission at no cost to you.
Free MT4 Indicator Download

Enter Your Email Address below, download link will be sent to you.