

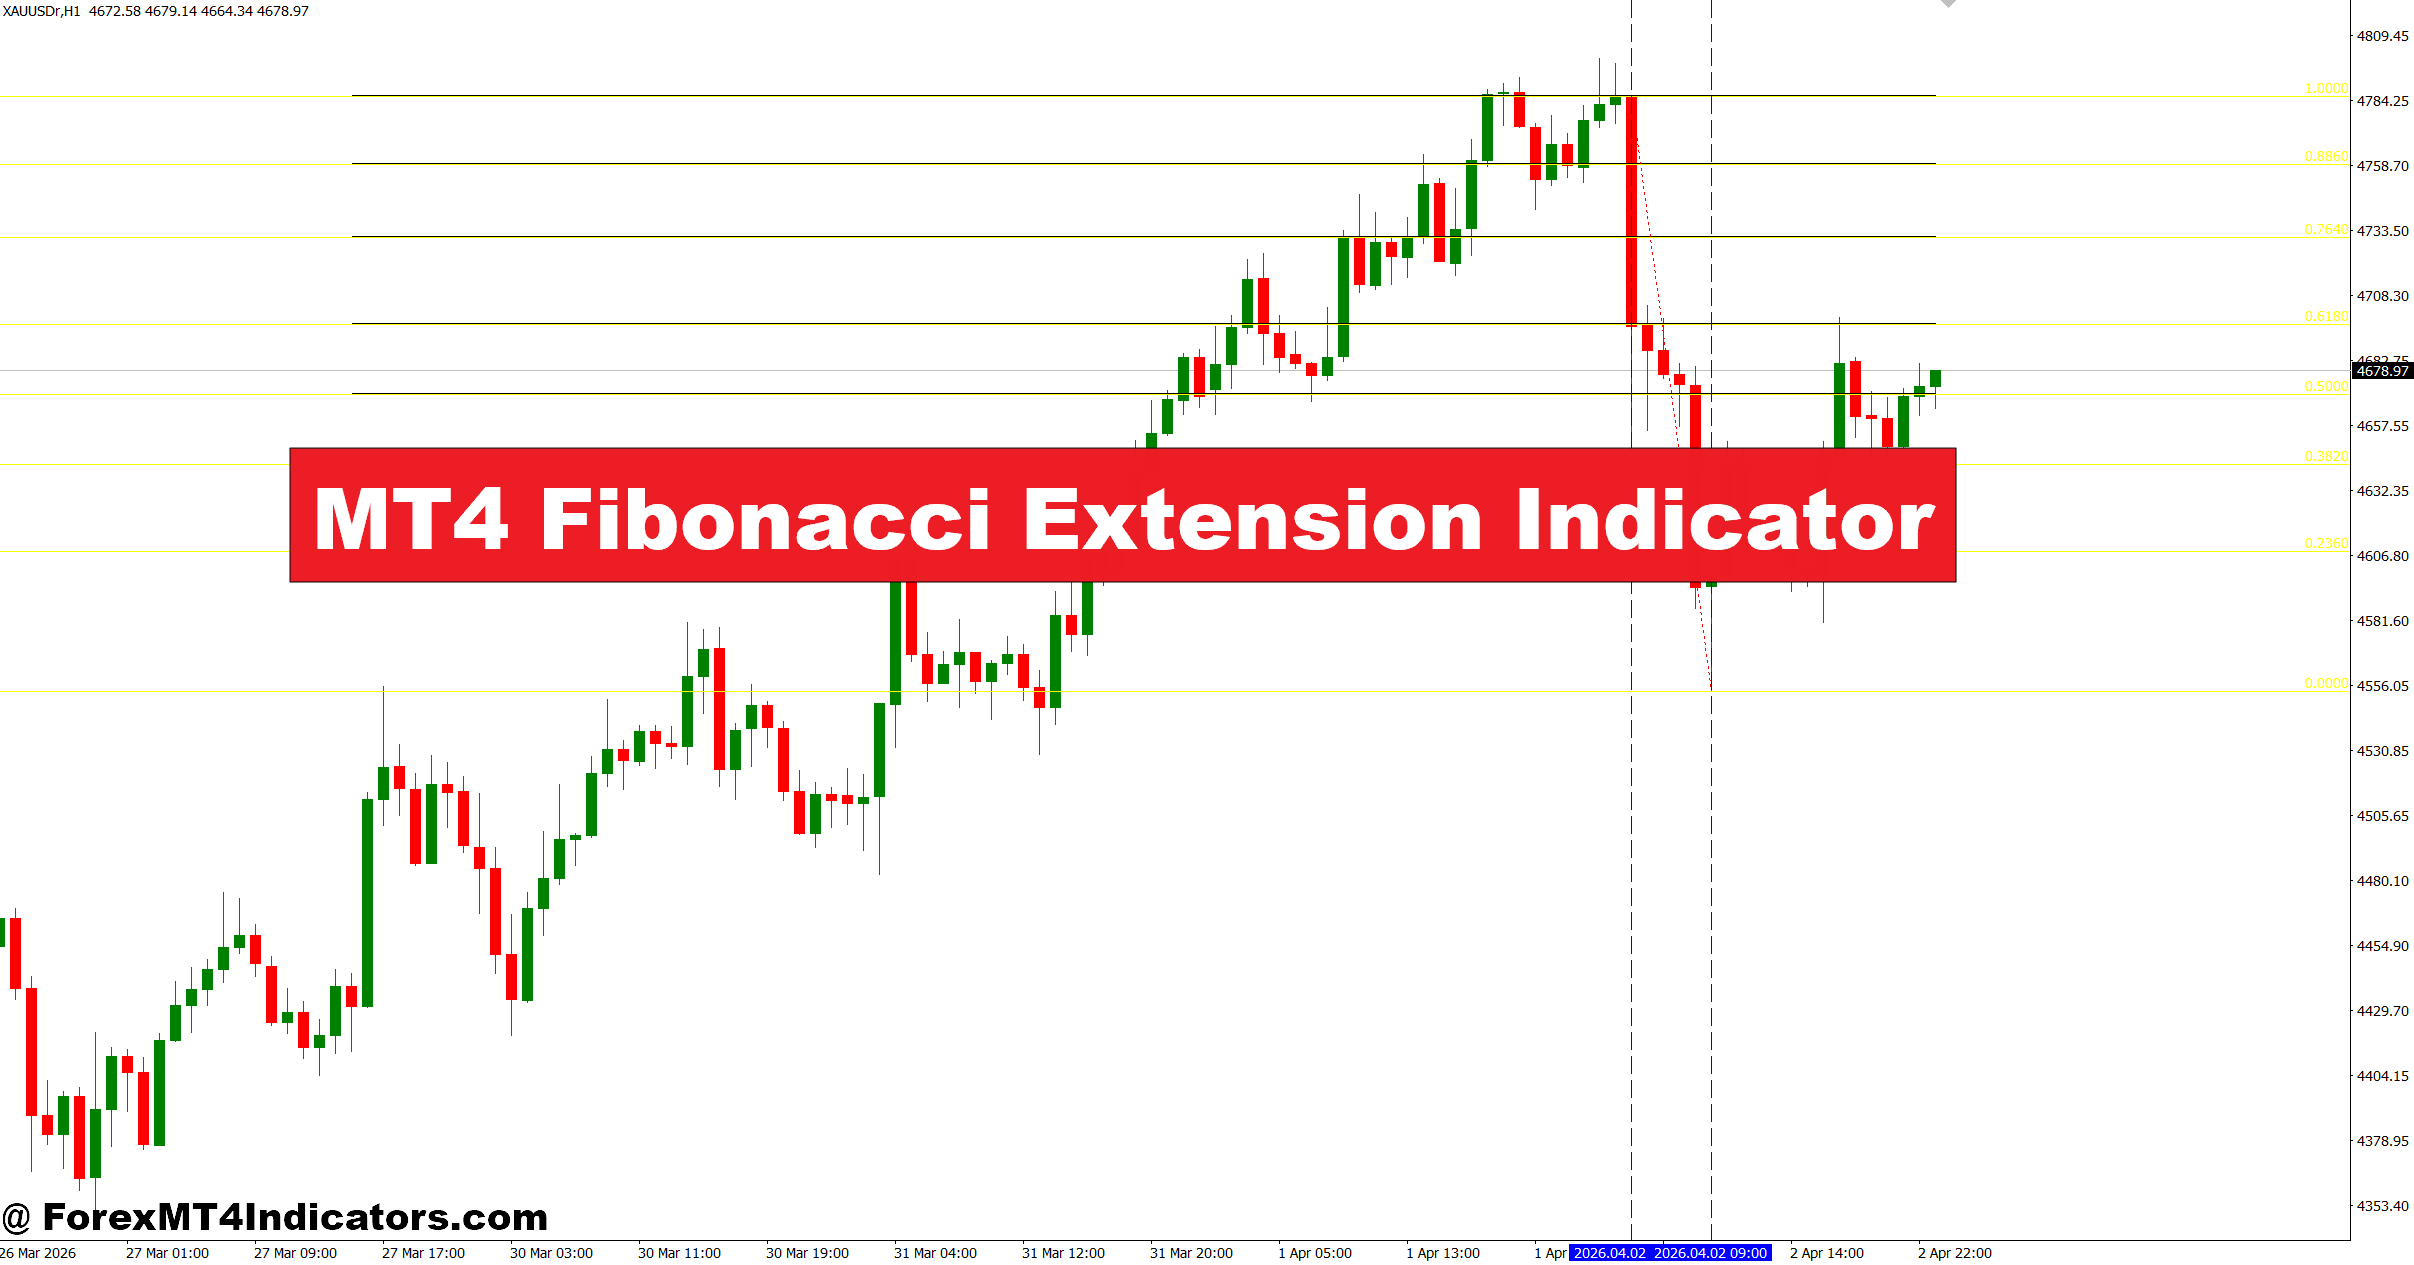
The MT4 Fibonacci Extension Indicator helps solve that problem by giving traders logical price objectives based on previous market swings rather than guesswork.
Poor exit decisions often lead to inconsistent results. A trader may correctly identify the trend, enter at the right time, and still lose potential profits because there was no clear exit strategy. That can create emotional trading, unnecessary stress, and even larger account drawdowns over time.
The MT4 Fibonacci Extension Indicator offers a structured way to project future price levels after a pullback. It doesn’t predict the future, but it helps traders estimate where price may slow down, reverse, or continue. Understanding how it works makes it much easier to manage trades with confidence.
Understanding the MT4 Fibonacci Extension Indicator
The MT4 Fibonacci Extension Indicator is a technical analysis tool that projects future price targets beyond the current trading range. It uses the mathematical Fibonacci sequence to calculate extension levels such as 127.2%, 161.8%, 261.8%, and 423.6%.
Unlike Fibonacci Retracement, which measures possible pullback areas, Fibonacci Extension focuses on where an existing trend may reach after the correction ends.
The indicator requires three points:
- The beginning of the trend
- The end of the initial impulse
- The end of the corrective pullback
After selecting these points, MT4 automatically plots extension levels above the previous high during an uptrend or below the previous low during a downtrend.
Many professional traders combine these projected levels with support and resistance zones, candlestick confirmation, and volume analysis before making trading decisions.
How the Indicator Calculates Future Price Targets
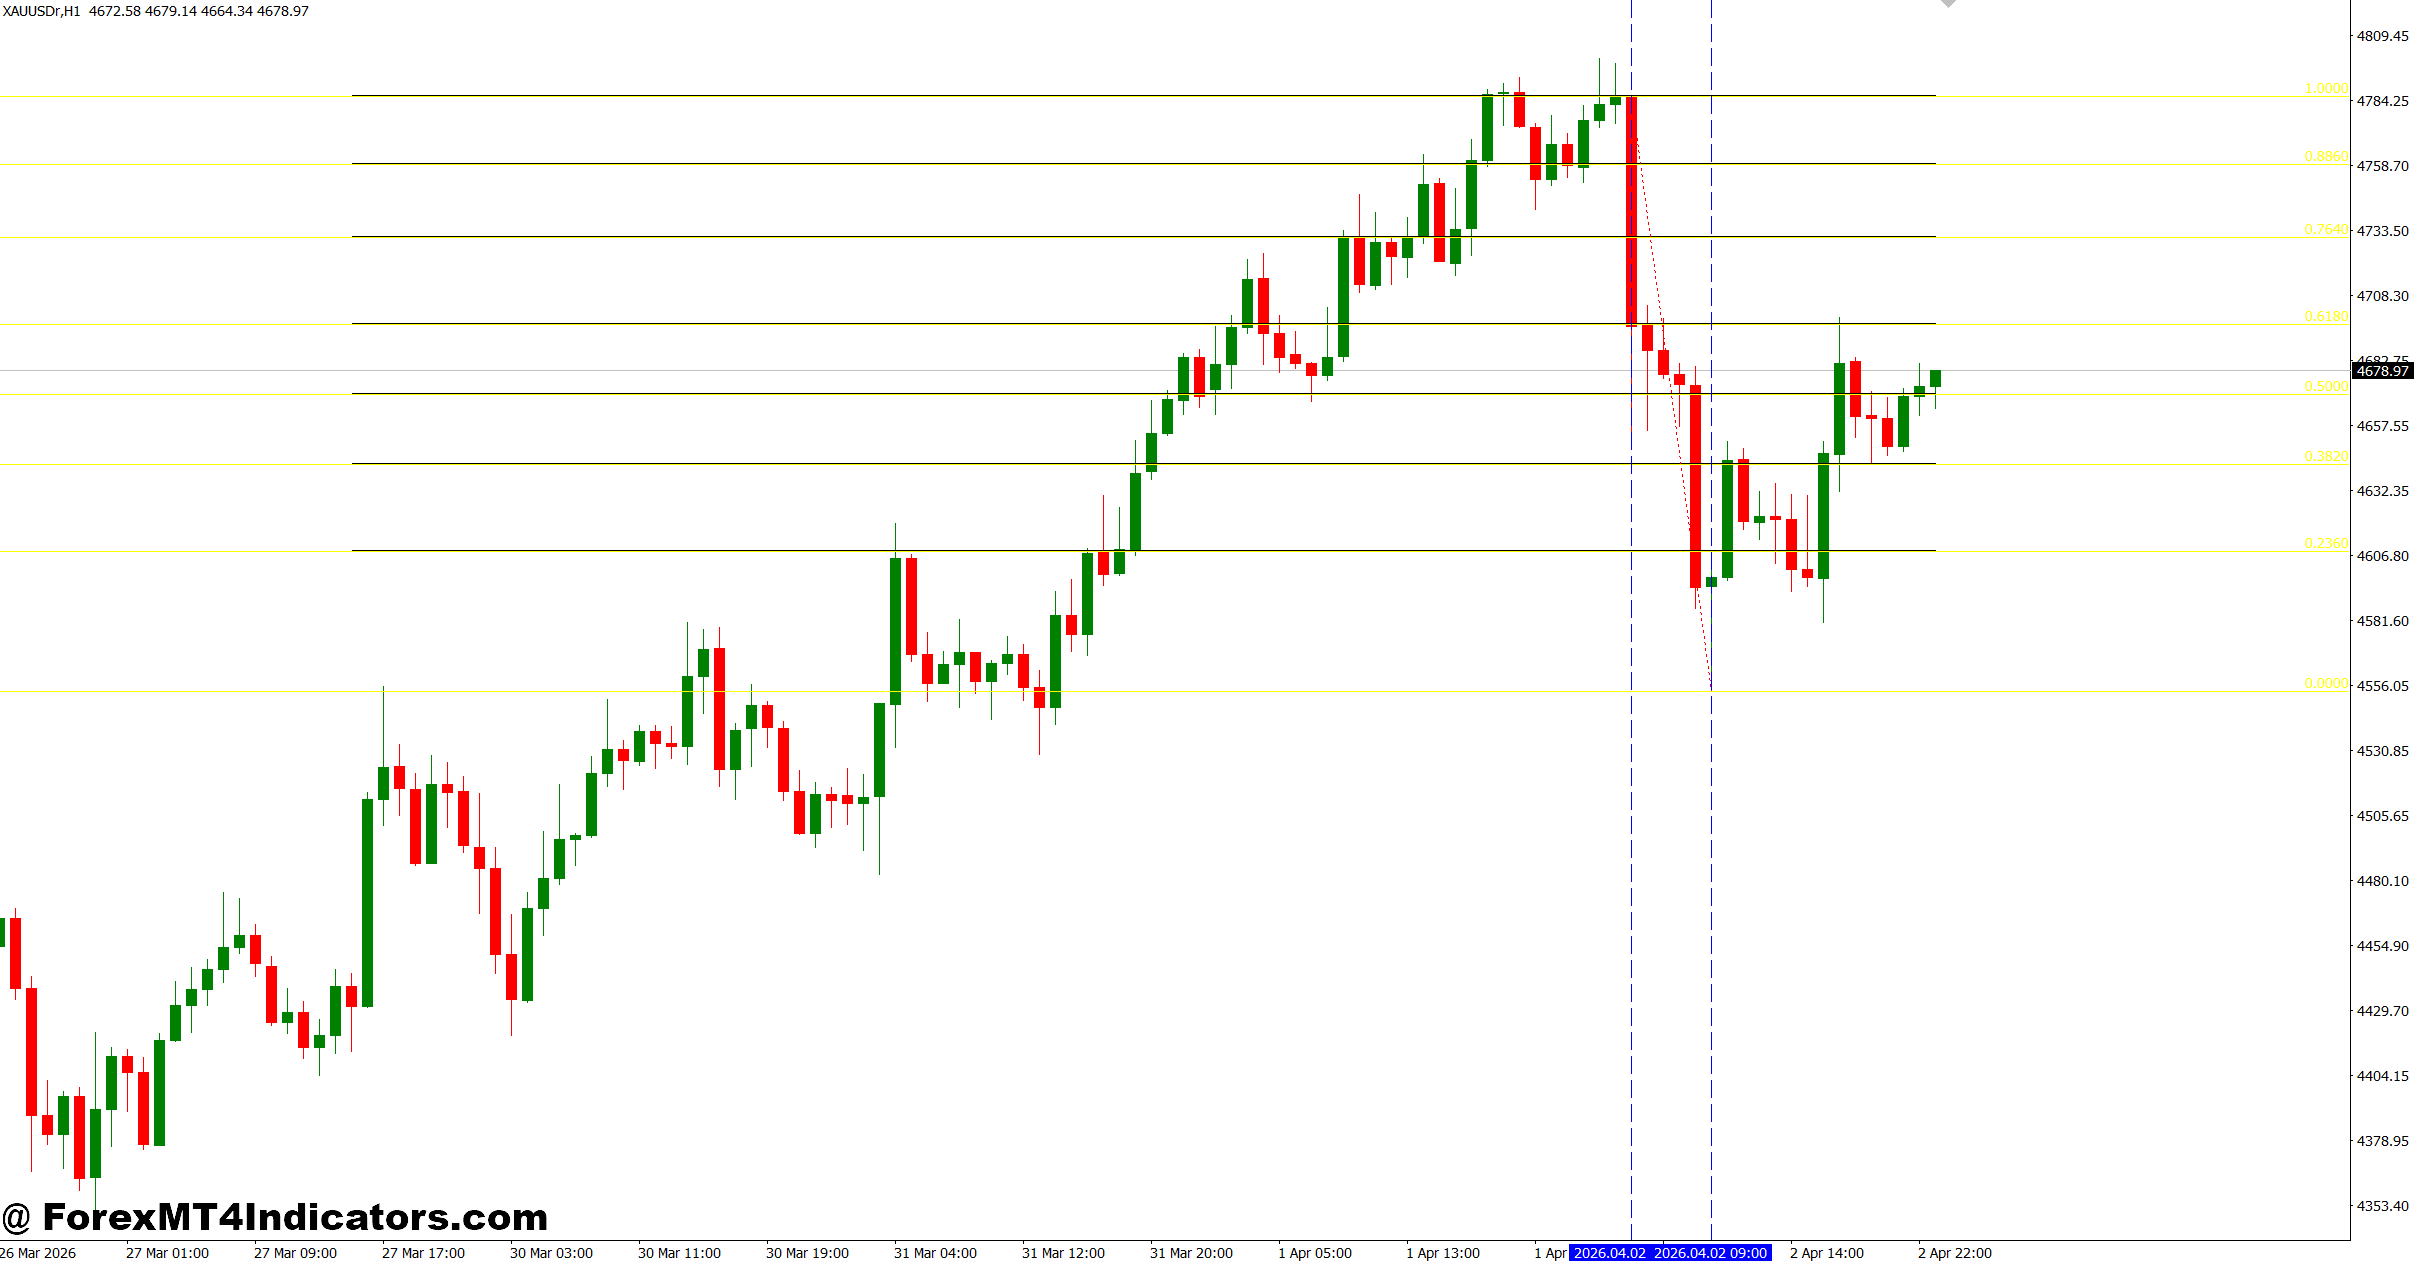
The logic behind the indicator is simple. It measures the length of the first impulse wave and applies Fibonacci ratios to estimate how far the next impulse could travel.
Suppose EUR/USD rises from 1.1000 to 1.1100, creating a 100-pip move. Price then retraces to 1.1050 before buyers return.
The indicator projects several possible targets:
- 127.2% Extension near 1.1127
- 161.8% Extension around 1.1162
- 261.8% Extension close to 1.1262
These aren’t guaranteed turning points. Instead, they identify areas where traders often reduce positions, tighten stop losses, or watch for reversal signals.
Here’s the thing—during strong trends, price frequently reaches the 161.8% extension before showing meaningful resistance. During weaker trends, the market may stall near the 127.2% level.
When testing this setup during high-volatility NFP releases, many traders notice that price can briefly overshoot extension levels before settling back into its trend. Waiting for the candle to close often reduces fake-outs.
Using Fibonacci Extensions in Real Trading
The indicator becomes much more effective when paired with market structure instead of being used alone.
Trending Market Example
Imagine GBP/USD on the 4-hour chart. Price breaks above resistance at 1.2950, rallies nearly 140 pips, and then retraces about 40% of the move.
A trader draws the Fibonacci Extension after the pullback finishes.
Price begins climbing again and approaches the 161.8% extension. At the same time, RSI remains above 55 and bullish candles continue forming.
Rather than closing the entire trade immediately, the trader exits half the position at the first extension level and trails the stop loss beneath higher swing lows. This approach allows participation if momentum continues while protecting existing gains.
Intraday Trading Example
On USD/JPY using the 15-minute chart, a breakout from the London session creates a clean bullish move.
The 127.2% extension sits only 18 pips above the breakout point.
Instead of aiming for an arbitrary 30-pip target, the trader chooses the Fibonacci level because it aligns with previous resistance formed during the Asian session. Price reaches the level within two hours before pulling back nearly 25 pips.
This combination of extension levels and historical resistance often produces more realistic trade management than fixed profit targets.
Trading forex carries substantial risk. No indicator guarantees profits. Proper position sizing and disciplined risk management remain essential regardless of the setup.
Best Settings and Practical Tips
The MT4 Fibonacci Extension Indicator doesn’t require traditional settings like moving averages because traders manually select swing points. Accuracy depends more on choosing meaningful highs and lows than changing indicator parameters.
For swing trading:
- Daily and 4-hour charts generally produce stronger extension levels.
- Focus on major trend swings instead of minor fluctuations.
- Combine extensions with weekly support and resistance.
For day trading:
- One-hour and 15-minute charts work well during London and New York sessions.
- Ignore small price movements during quiet market hours.
- Wait for pullbacks before drawing new extensions.
Currency pairs also matter.
EUR/USD and GBP/USD often respect Fibonacci extensions during trending markets because of their high liquidity. Gold (XAU/USD) can also react well, although its larger volatility may require wider stop losses and greater patience.
One practical habit experienced traders develop is redrawing the extension only after a confirmed swing forms. Constantly adjusting levels during every small candle usually creates confusion rather than better analysis.
Strengths, Weaknesses, and Comparison with Similar Tools
One reason traders continue using Fibonacci Extensions is their flexibility. The indicator works across nearly every timeframe and adapts well to trend-following strategies.
Its strengths include:
- Clear profit target planning
- Logical trade management
- Easy integration with trend analysis
- Useful for identifying potential reversal zones
Still, there are limitations.
The indicator depends heavily on selecting the correct swing points. Two traders may draw different extensions on the same chart and receive different targets. During sideways markets filled with chop, extension levels lose much of their reliability because trends lack momentum.
Compared with the Fibonacci Retracement tool, extensions focus on exits rather than entries. Compared with Pivot Points, Fibonacci Extensions adapt to recent market swings instead of using fixed daily calculations. Many traders combine all three tools to build a stronger trading plan rather than relying on only one indicator.
Successful traders rarely treat any technical indicator as a standalone system. Price action, market structure, trend confirmation, and risk control should always support every trading decision.
How to Trade with MT4 Fibonacci Extension Indicator
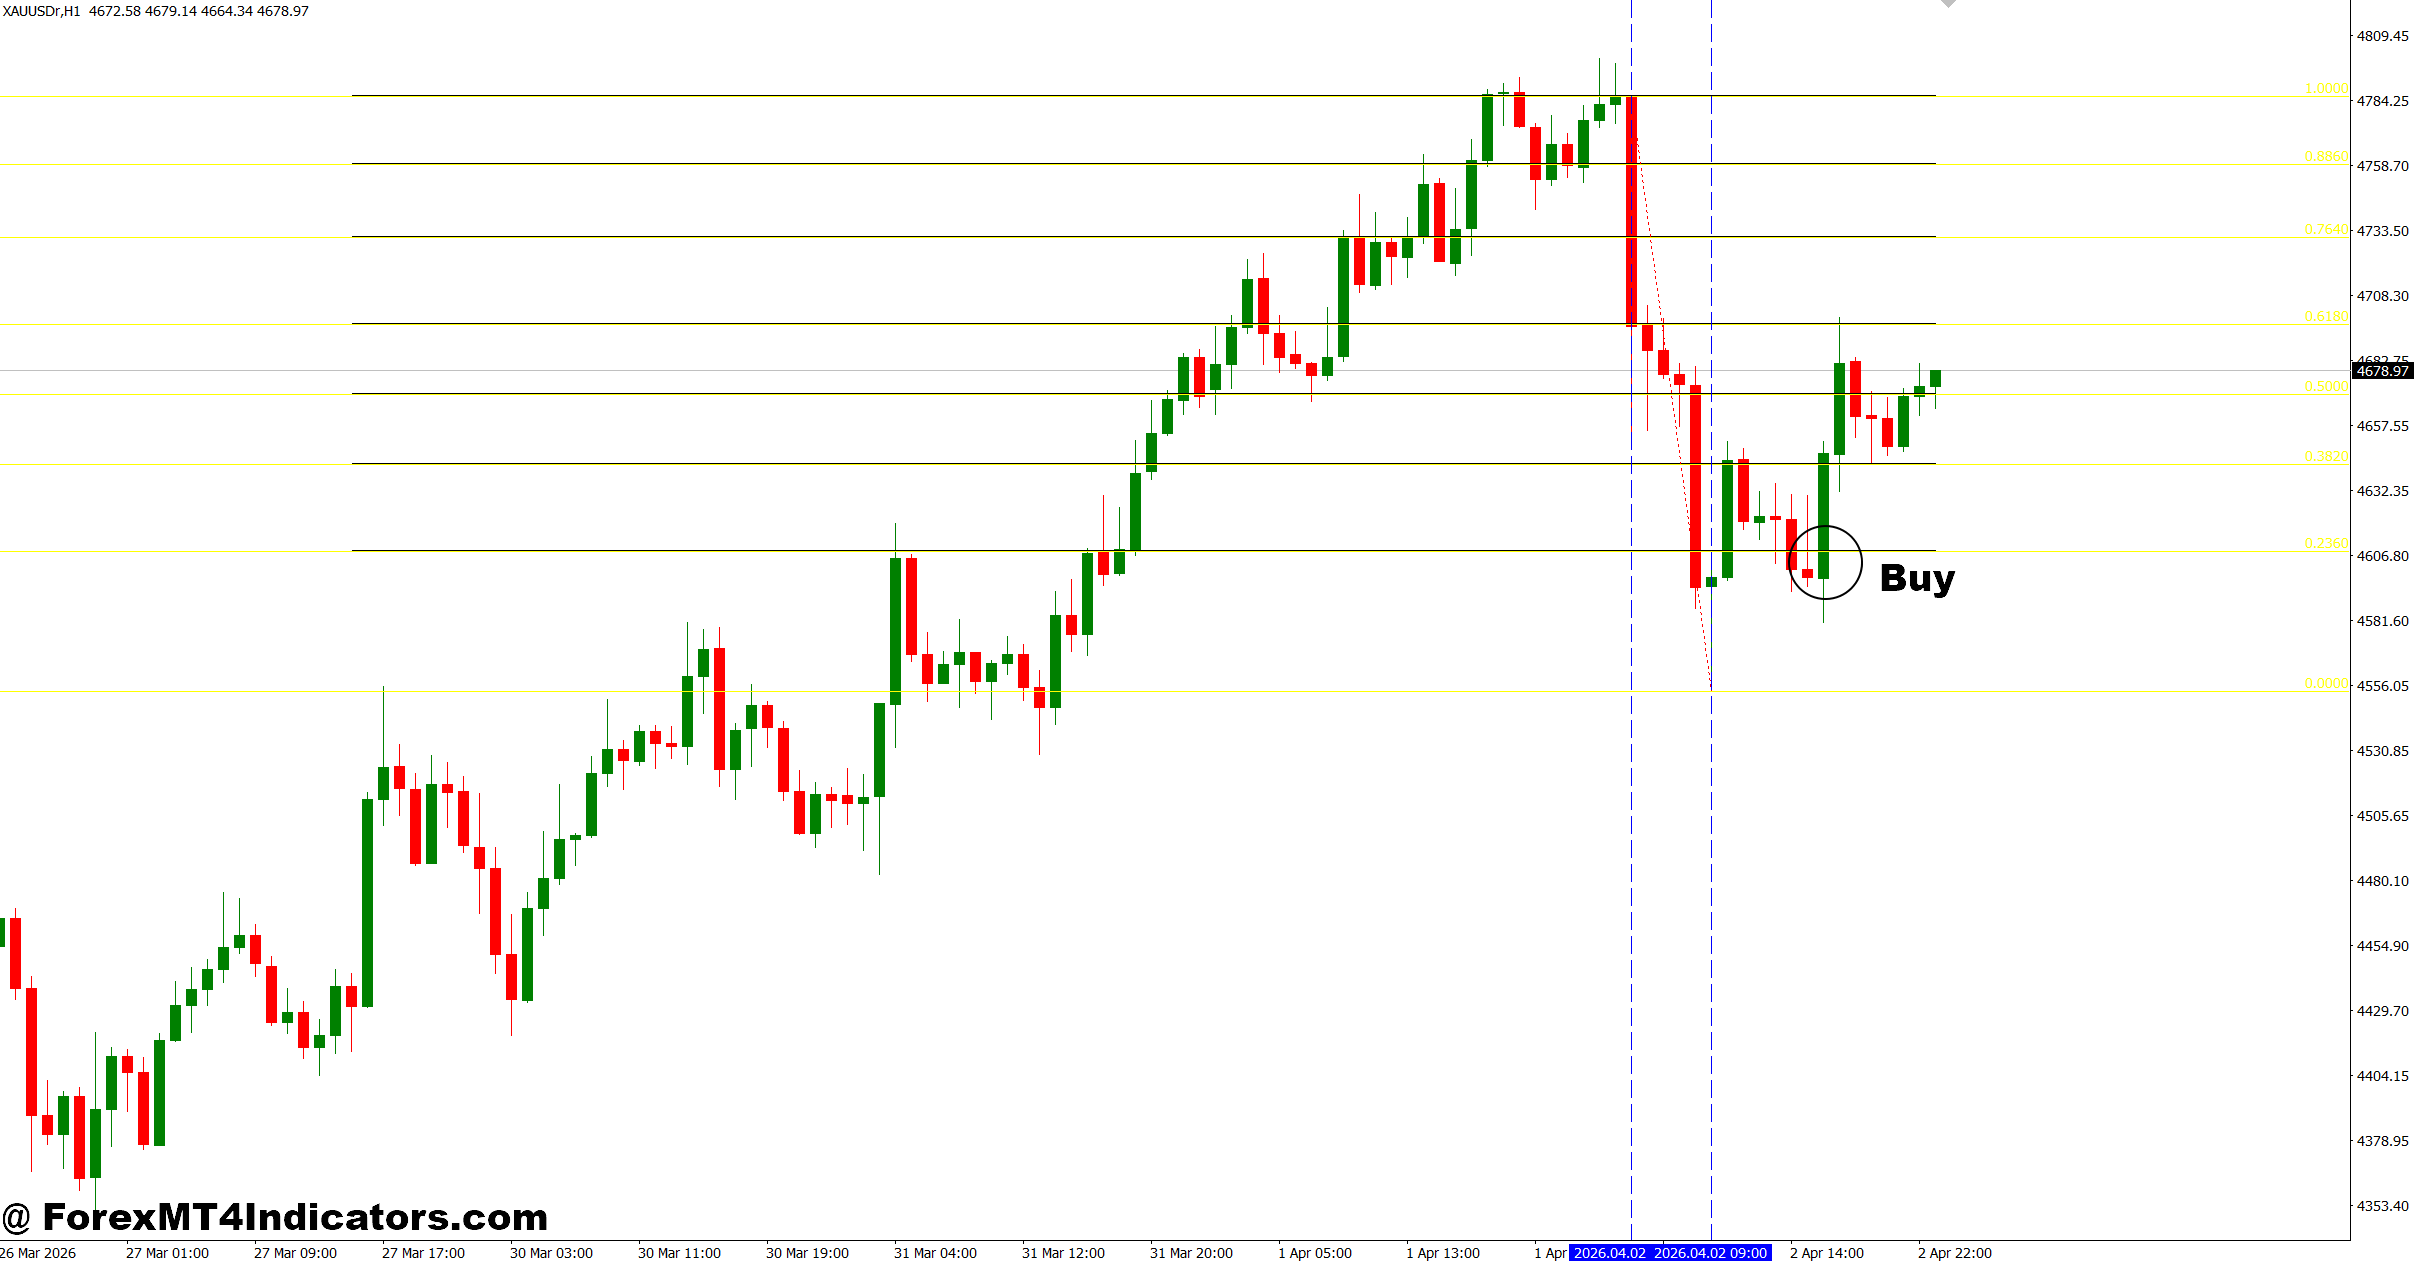
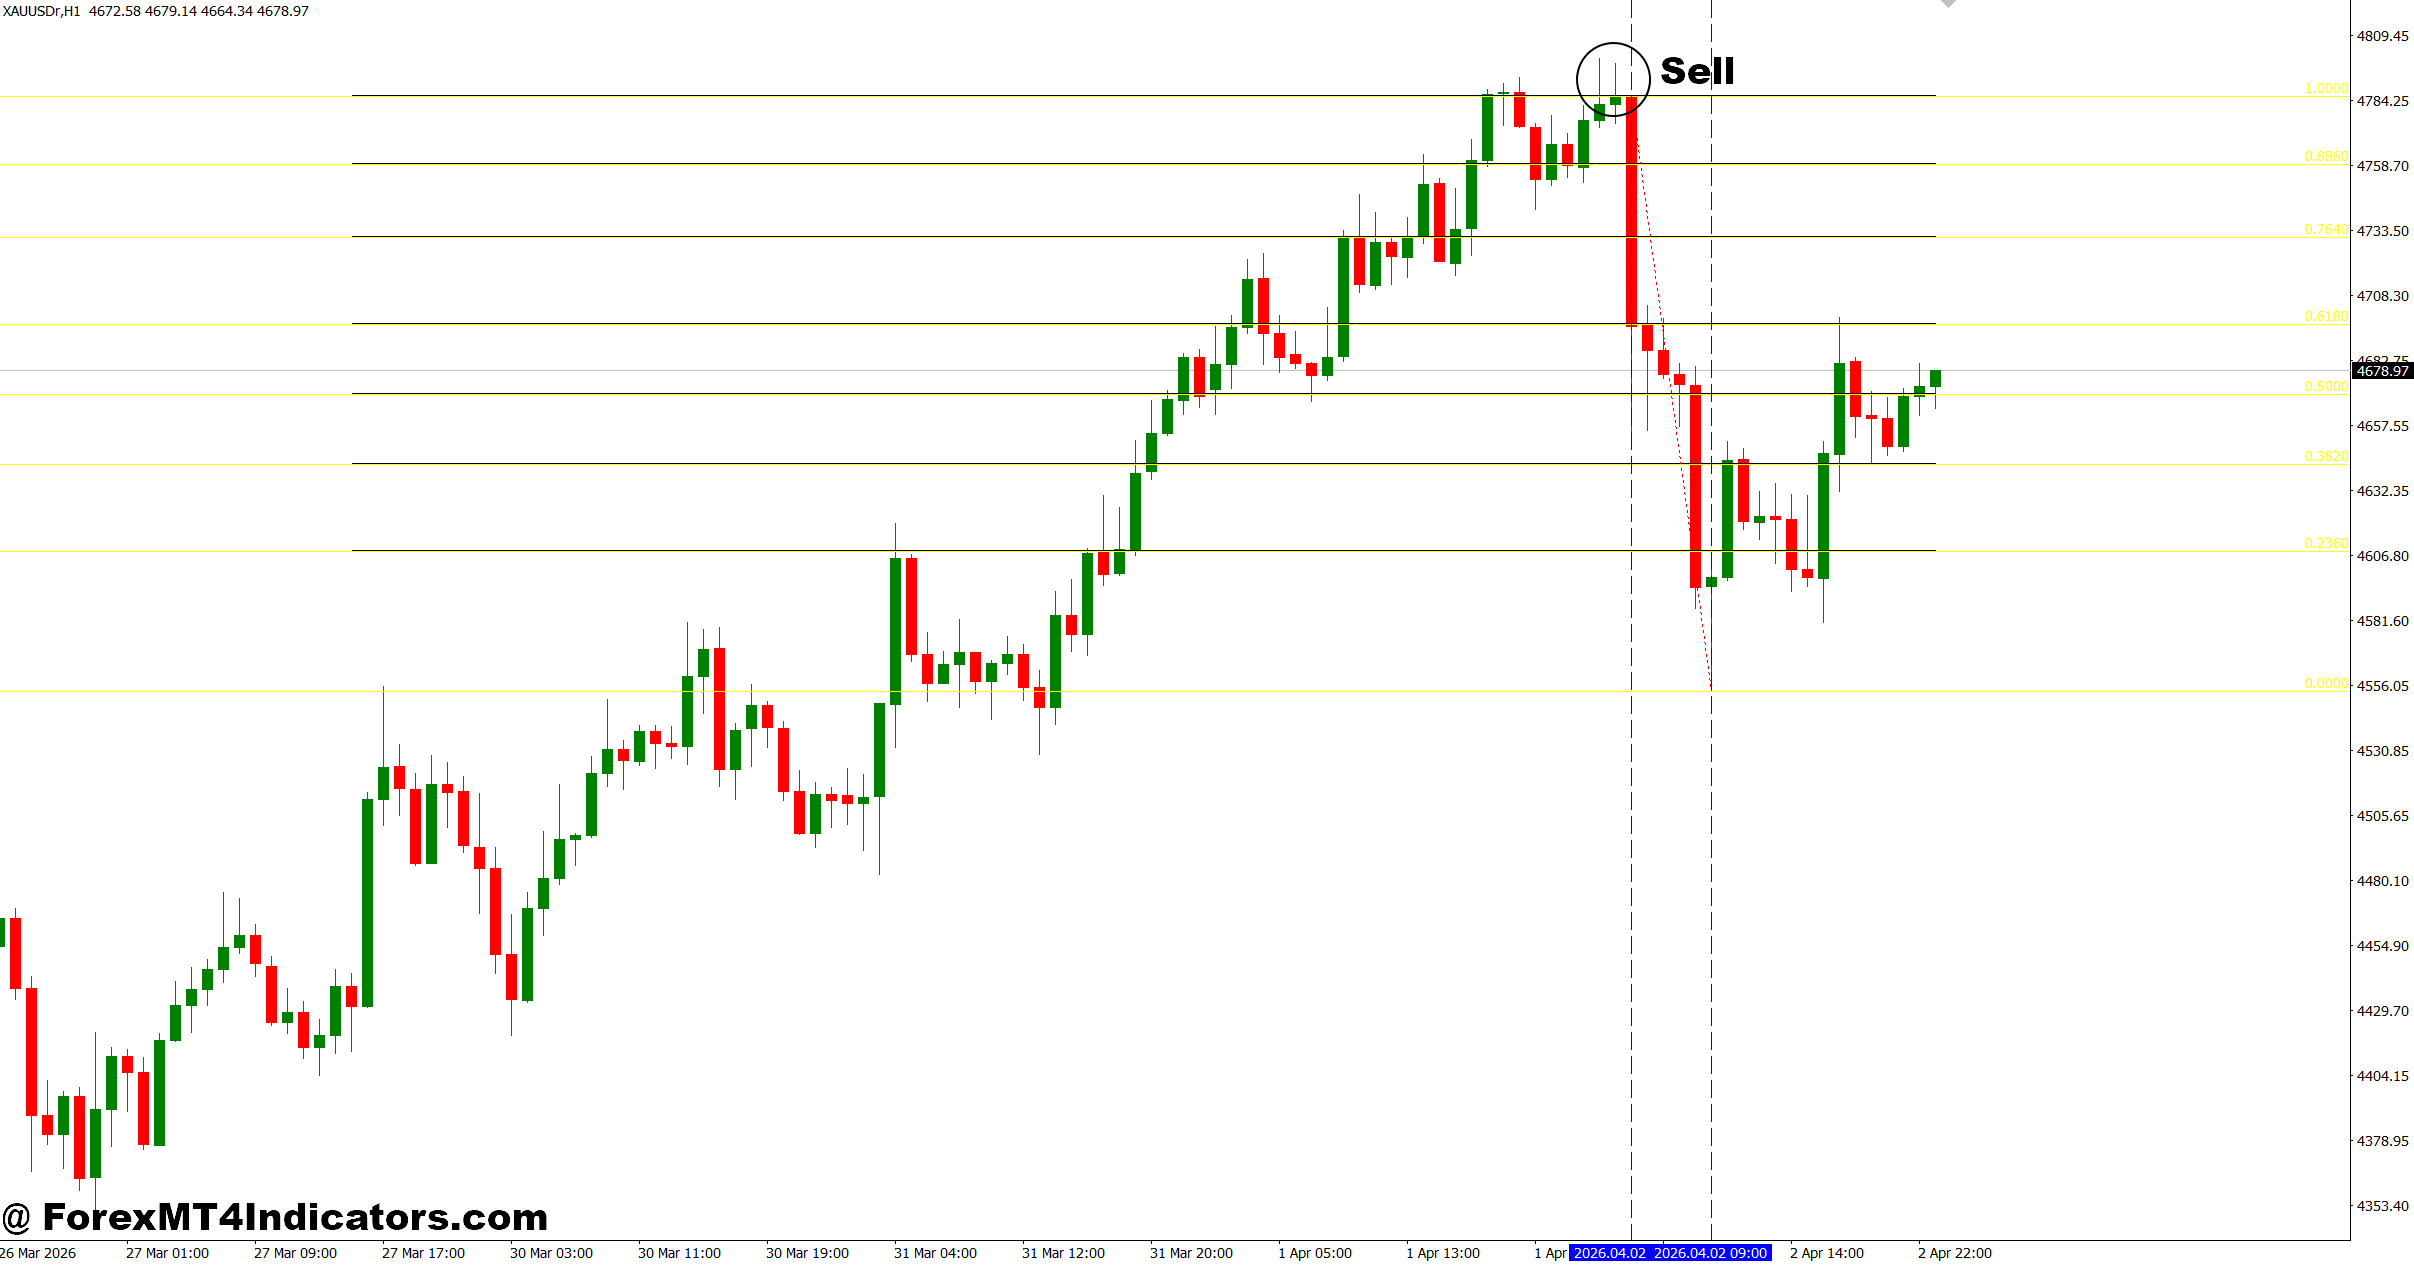

The MT4 Fibonacci Extension Indicator gives traders a practical way to estimate future price objectives instead of relying on emotion. It works best when traders identify strong market swings, draw accurate extension levels, and confirm signals with price action. The biggest lessons are simple: use the indicator to manage trades rather than predict every reversal, combine it with support and resistance for stronger analysis, respect its limitations during ranging markets, and never ignore risk management. Used with patience and discipline, the MT4 Fibonacci Extension Indicator can become a valuable part of a balanced forex trading strategy instead of the only reason to enter or exit a trade.
Level up your trading
Learn to read the chart — not just the indicator
eBook · Instant PDF
Video Course · 12 modules
Recommended MT4/MT5 Brokers
- ✓ *FREE *$50 to start (withdrawable)
- ✓ Deposit bonus up to $5,000
- ✓ Negative balance protection
Trading forex and CFDs carries a significant risk of loss and is not suitable for everyone. Broker links are affiliate links — we may earn a commission at no cost to you.
Free MT4 Indicator Download

Enter Your Email Address below, download link will be sent to you.
