


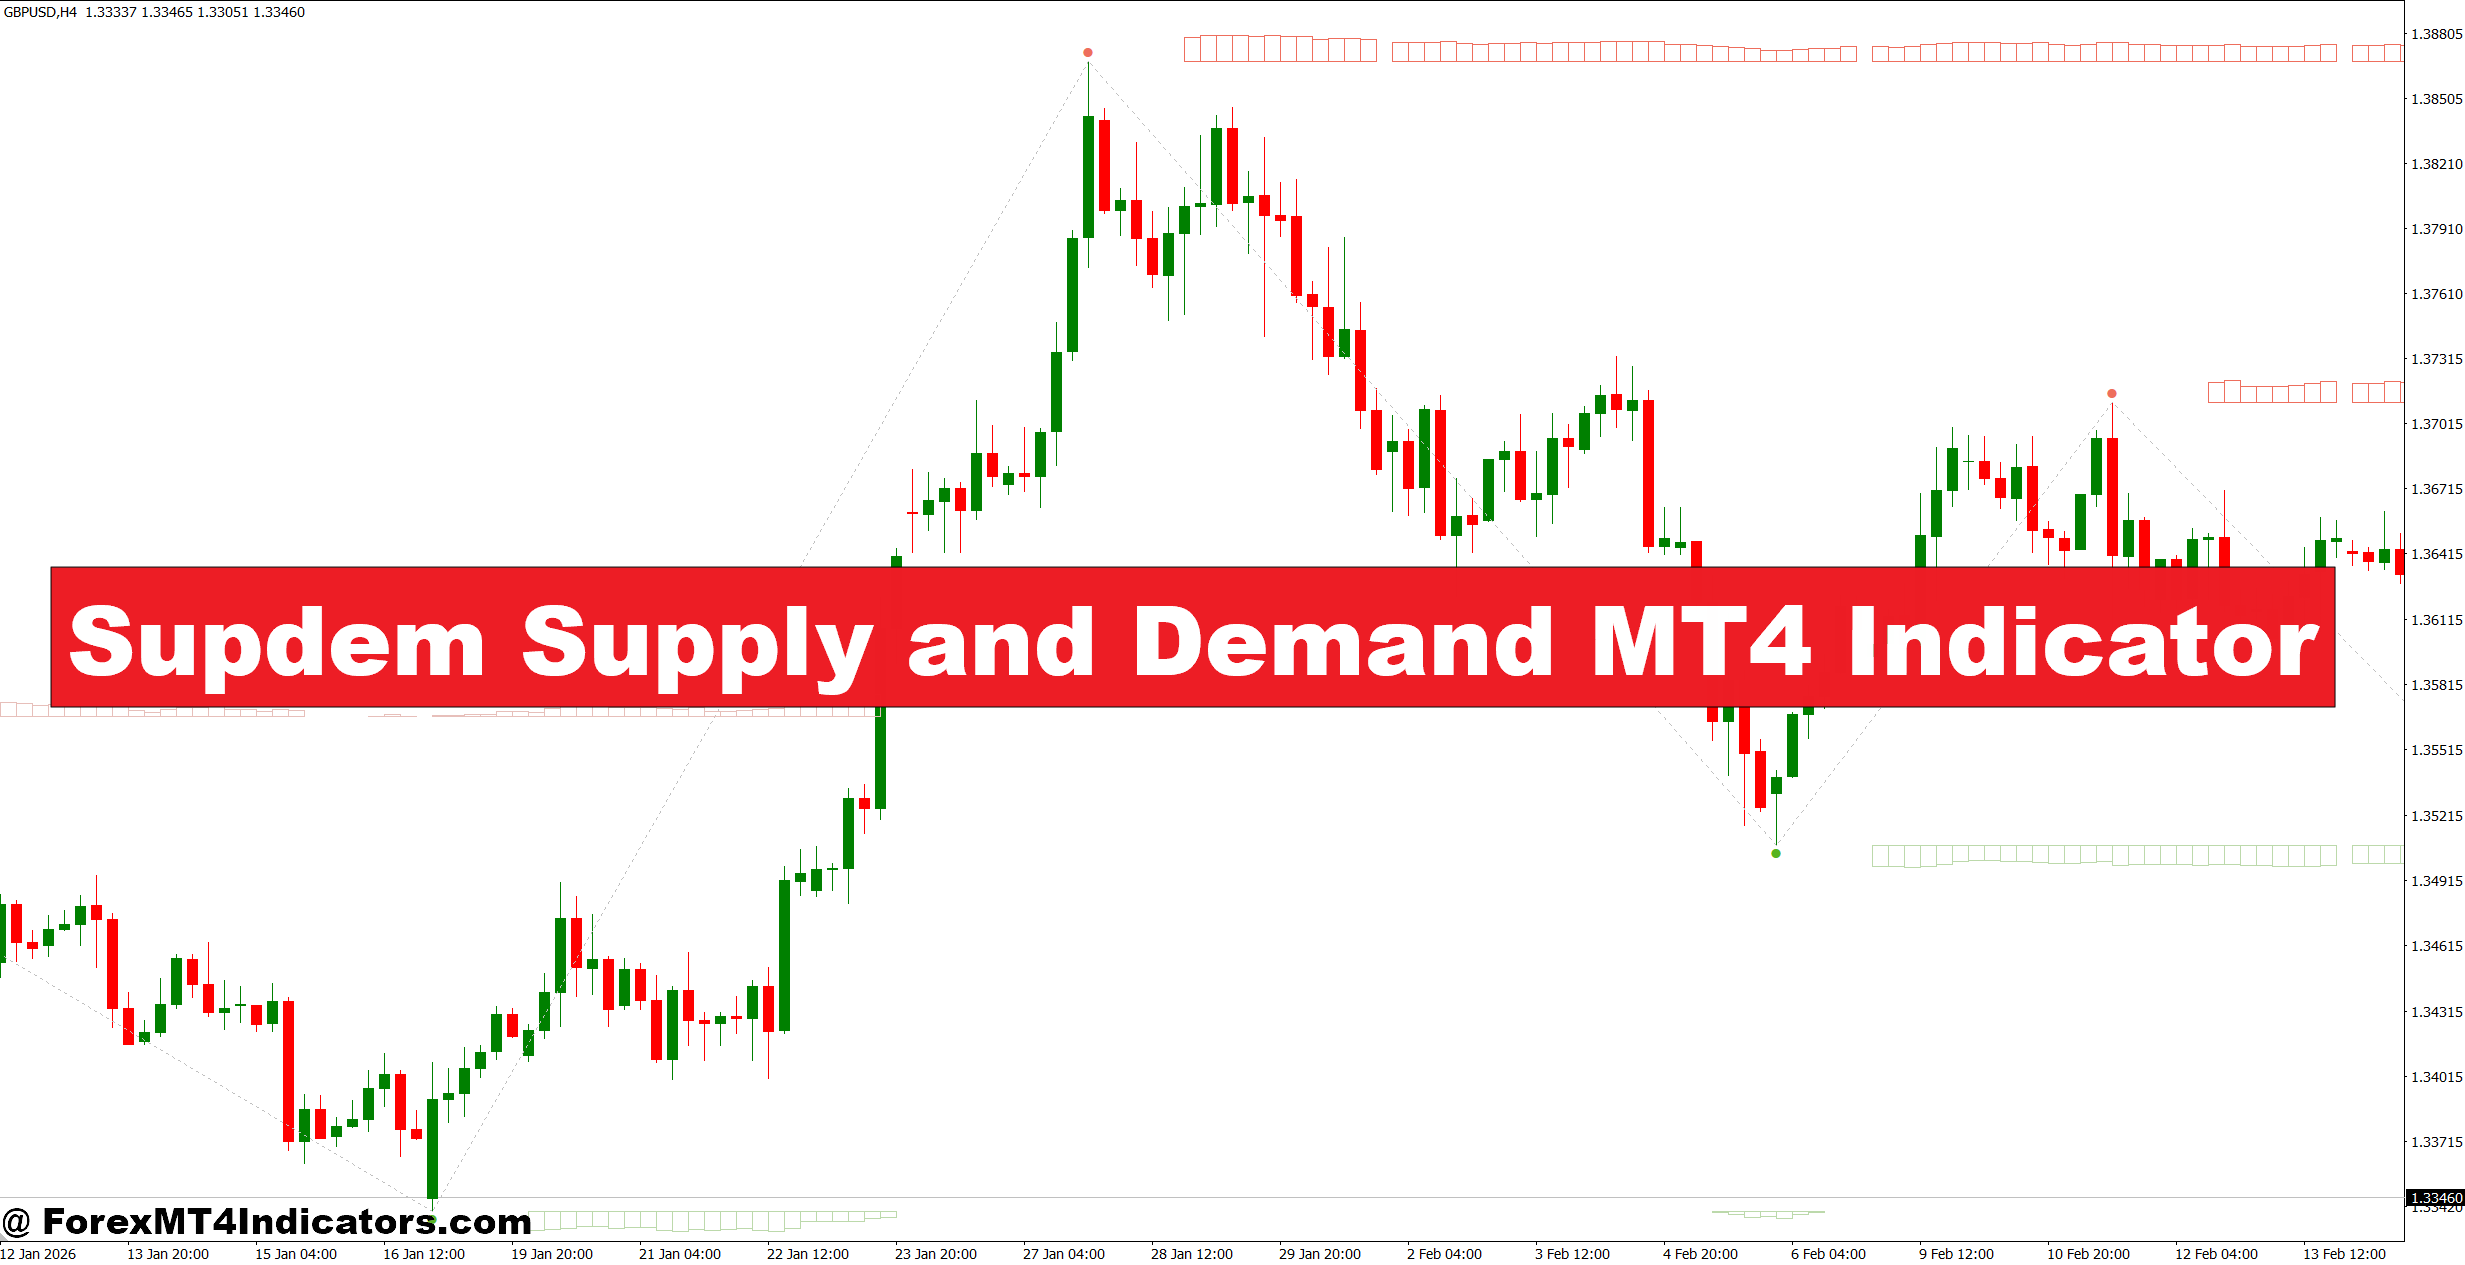
The Supdem Supply and Demand MT4 Indicator helps traders identify areas where buying or selling pressure has previously caused a strong price reaction. Without clear zones, traders often chase candles, enter after the move has already happened, or get caught in a fake-out. A few bad entries can create frustration and unnecessary account drawdown.
The indicator gives traders a visual way to study potential demand and supply areas directly on the MT4 chart. It can help organize price action, but it shouldn’t replace market structure or risk management. In practice, the strongest results come when traders combine the zones with trend direction, candle behavior, and confirmation.
What Is the Supdem Supply and Demand MT4 Indicator?
The Supdem Supply and Demand MT4 Indicator is a technical analysis tool designed to mark potential supply and demand zones on a MetaTrader 4 chart.
A demand zone generally represents an area where buyers previously entered with enough strength to push price upward. A supply zone works in the opposite direction. It marks an area where selling pressure previously produced a meaningful decline.
The indicator’s exact calculation can vary by version, but the basic logic usually focuses on price structure, strong directional moves, and the areas around which those moves originated. Instead of treating every support or resistance level equally, supply-and-demand tools attempt to highlight zones associated with stronger price displacement.
For example, suppose GBP/USD forms a narrow consolidation around 1.2700–1.2720 and then rallies 70 pips. A trader may treat that preceding area as a potential demand zone. If price later returns to 1.2710 and prints a bullish rejection candle, the zone becomes more interesting than a random horizontal level.
That distinction matters. Supply and demand are normally areas, not single-price lines.
Settings and Timeframe Considerations
Supdem indicators often provide settings that control how aggressively zones are detected. Traders should understand that changing these values can dramatically affect the number and size of zones displayed.
On lower timeframes such as M5 or M15, a tighter setting may identify many short-term zones. That can help scalpers, but it also creates more noise and fake-outs.
For H1 and H4 trading, a trader may prefer settings that produce fewer, wider zones. The goal isn’t to fill the chart with colored areas. Too many zones make decision-making harder.
A sensible workflow is to use higher timeframes for context and lower timeframes for entries. For instance, a trader could identify a demand zone on H4, wait for price to reach it, and then switch to M15 to look for a bullish structure break.
The same approach can be tested across different pairs. EUR/USD and USD/JPY often behave differently around major economic releases. Gold can move through zones much more aggressively than many major currency pairs, so stops that work on EUR/USD may be too tight for XAU/USD.
When testing the indicator on volatile NFP days, traders should also expect wider spreads, rapid candles, and occasional zone violations. A technically valid zone doesn’t guarantee a clean reaction during extreme volatility.
Strengths, Limitations, and Comparison With Other Tools
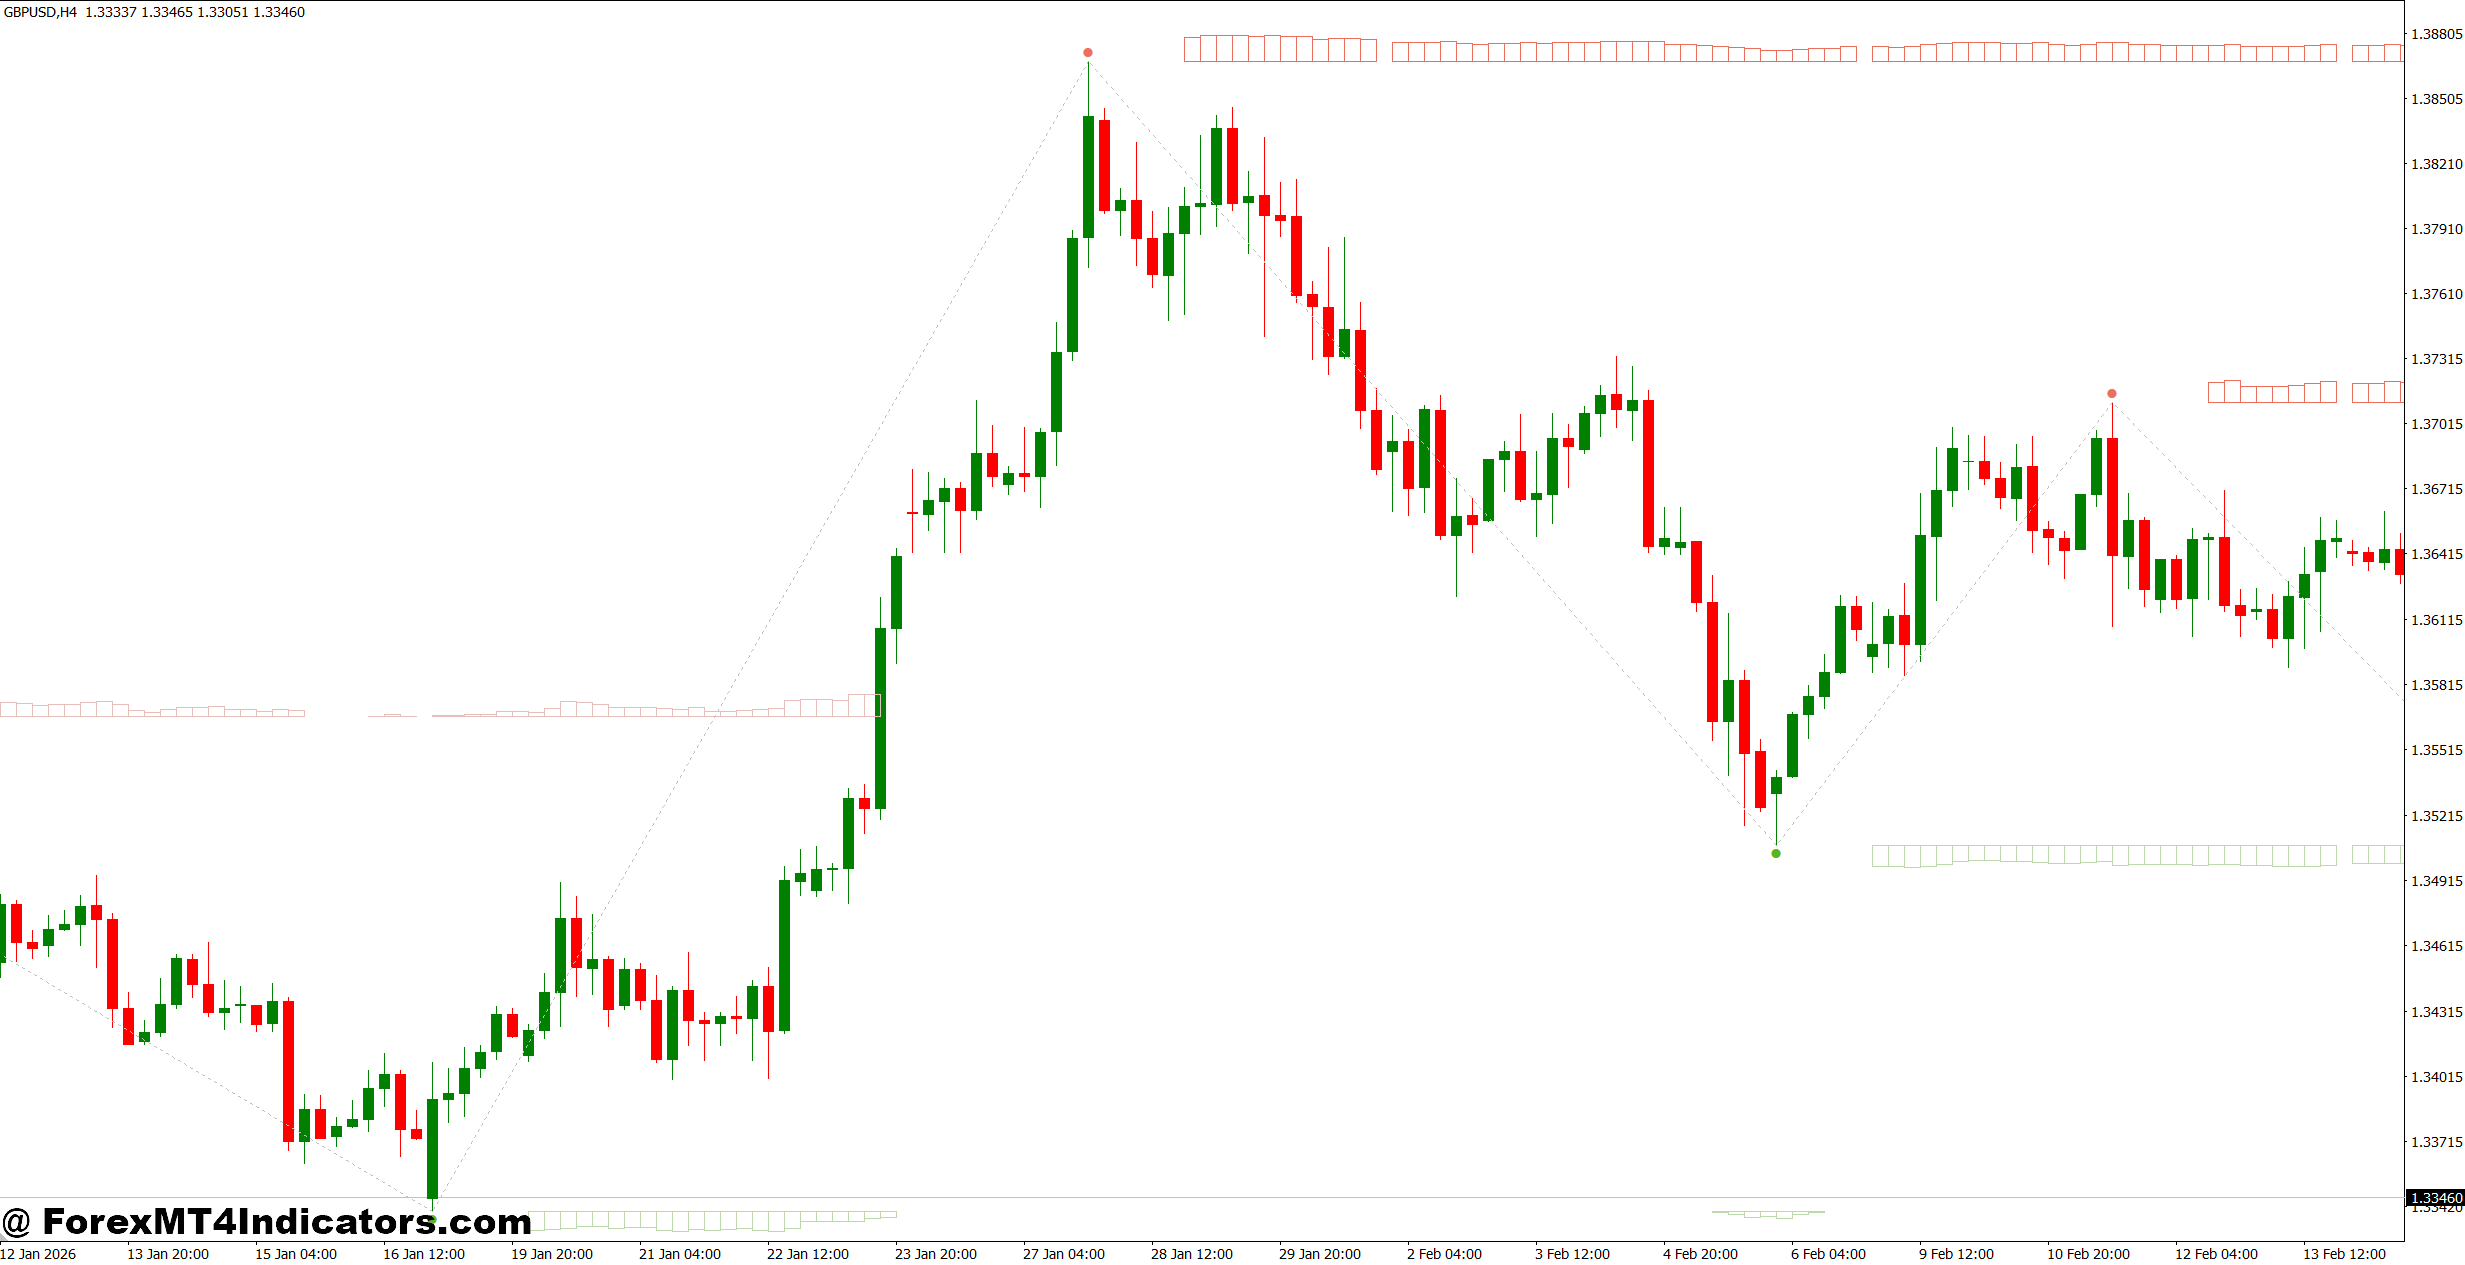
One useful feature of a supply-and-demand indicator is visual simplicity. Instead of manually marking every reaction area, traders can use the indicator as a starting point for chart analysis.
It can also complement traditional support and resistance. A horizontal resistance level might sit at 1.2700, while the supply zone extends from 1.2680 to 1.2715. That wider area gives the trader a more realistic view of where sellers may become active.
Compared with the 14-period RSI, the Supdem indicator focuses on price location rather than momentum conditions. RSI might show an overbought reading near 70, but that doesn’t tell the trader exactly where sellers may react. Supply and demand analysis can provide that location.
Moving averages serve another purpose. A 50-period EMA can help define trend direction, while a supply-and-demand indicator can identify potential entry areas. Combining the two can reduce some countertrend trades.
Still, there are weaknesses. Some zones will fail. Others may become less relevant after multiple retests because the original buying or selling orders may have already been absorbed. Indicator-generated zones can also appear different after new candles form, depending on the version’s calculation rules.
That said, traders shouldn’t assume a zone is strong simply because it is displayed on the chart. Fresh zones that produced a sharp displacement and haven’t been repeatedly tested generally deserve more attention than an old area that price has touched four or five times.
Risk management remains essential. A trader risking 2% on every setup can experience significant drawdown during a losing streak, even with a sound method. Many traders therefore keep individual trade risk around 0.5%–1% while testing a new indicator.
A Practical Trading Routine
A straightforward process can make the indicator easier to use.
First, check the higher-timeframe trend. If EUR/USD is clearly bearish on H4, traders can give greater weight to supply zones than isolated demand zones.
Next, mark the nearest fresh zone. Then check whether the area caused a strong previous displacement. A 60–100 pip reaction is generally more meaningful than a tiny 10-pip bounce.
When price returns, don’t enter automatically. Watch the candles. Rejection, engulfing patterns, momentum shifts, or a lower-timeframe structure break can provide additional confirmation.
Finally, calculate the stop-loss and position size before entering. A trade should still make sense if the stop is triggered.
Trading forex carries substantial risk. No indicator guarantees profits.
How to Trade with Supdem Supply and Demand MT4 Indicator
Buy Entry
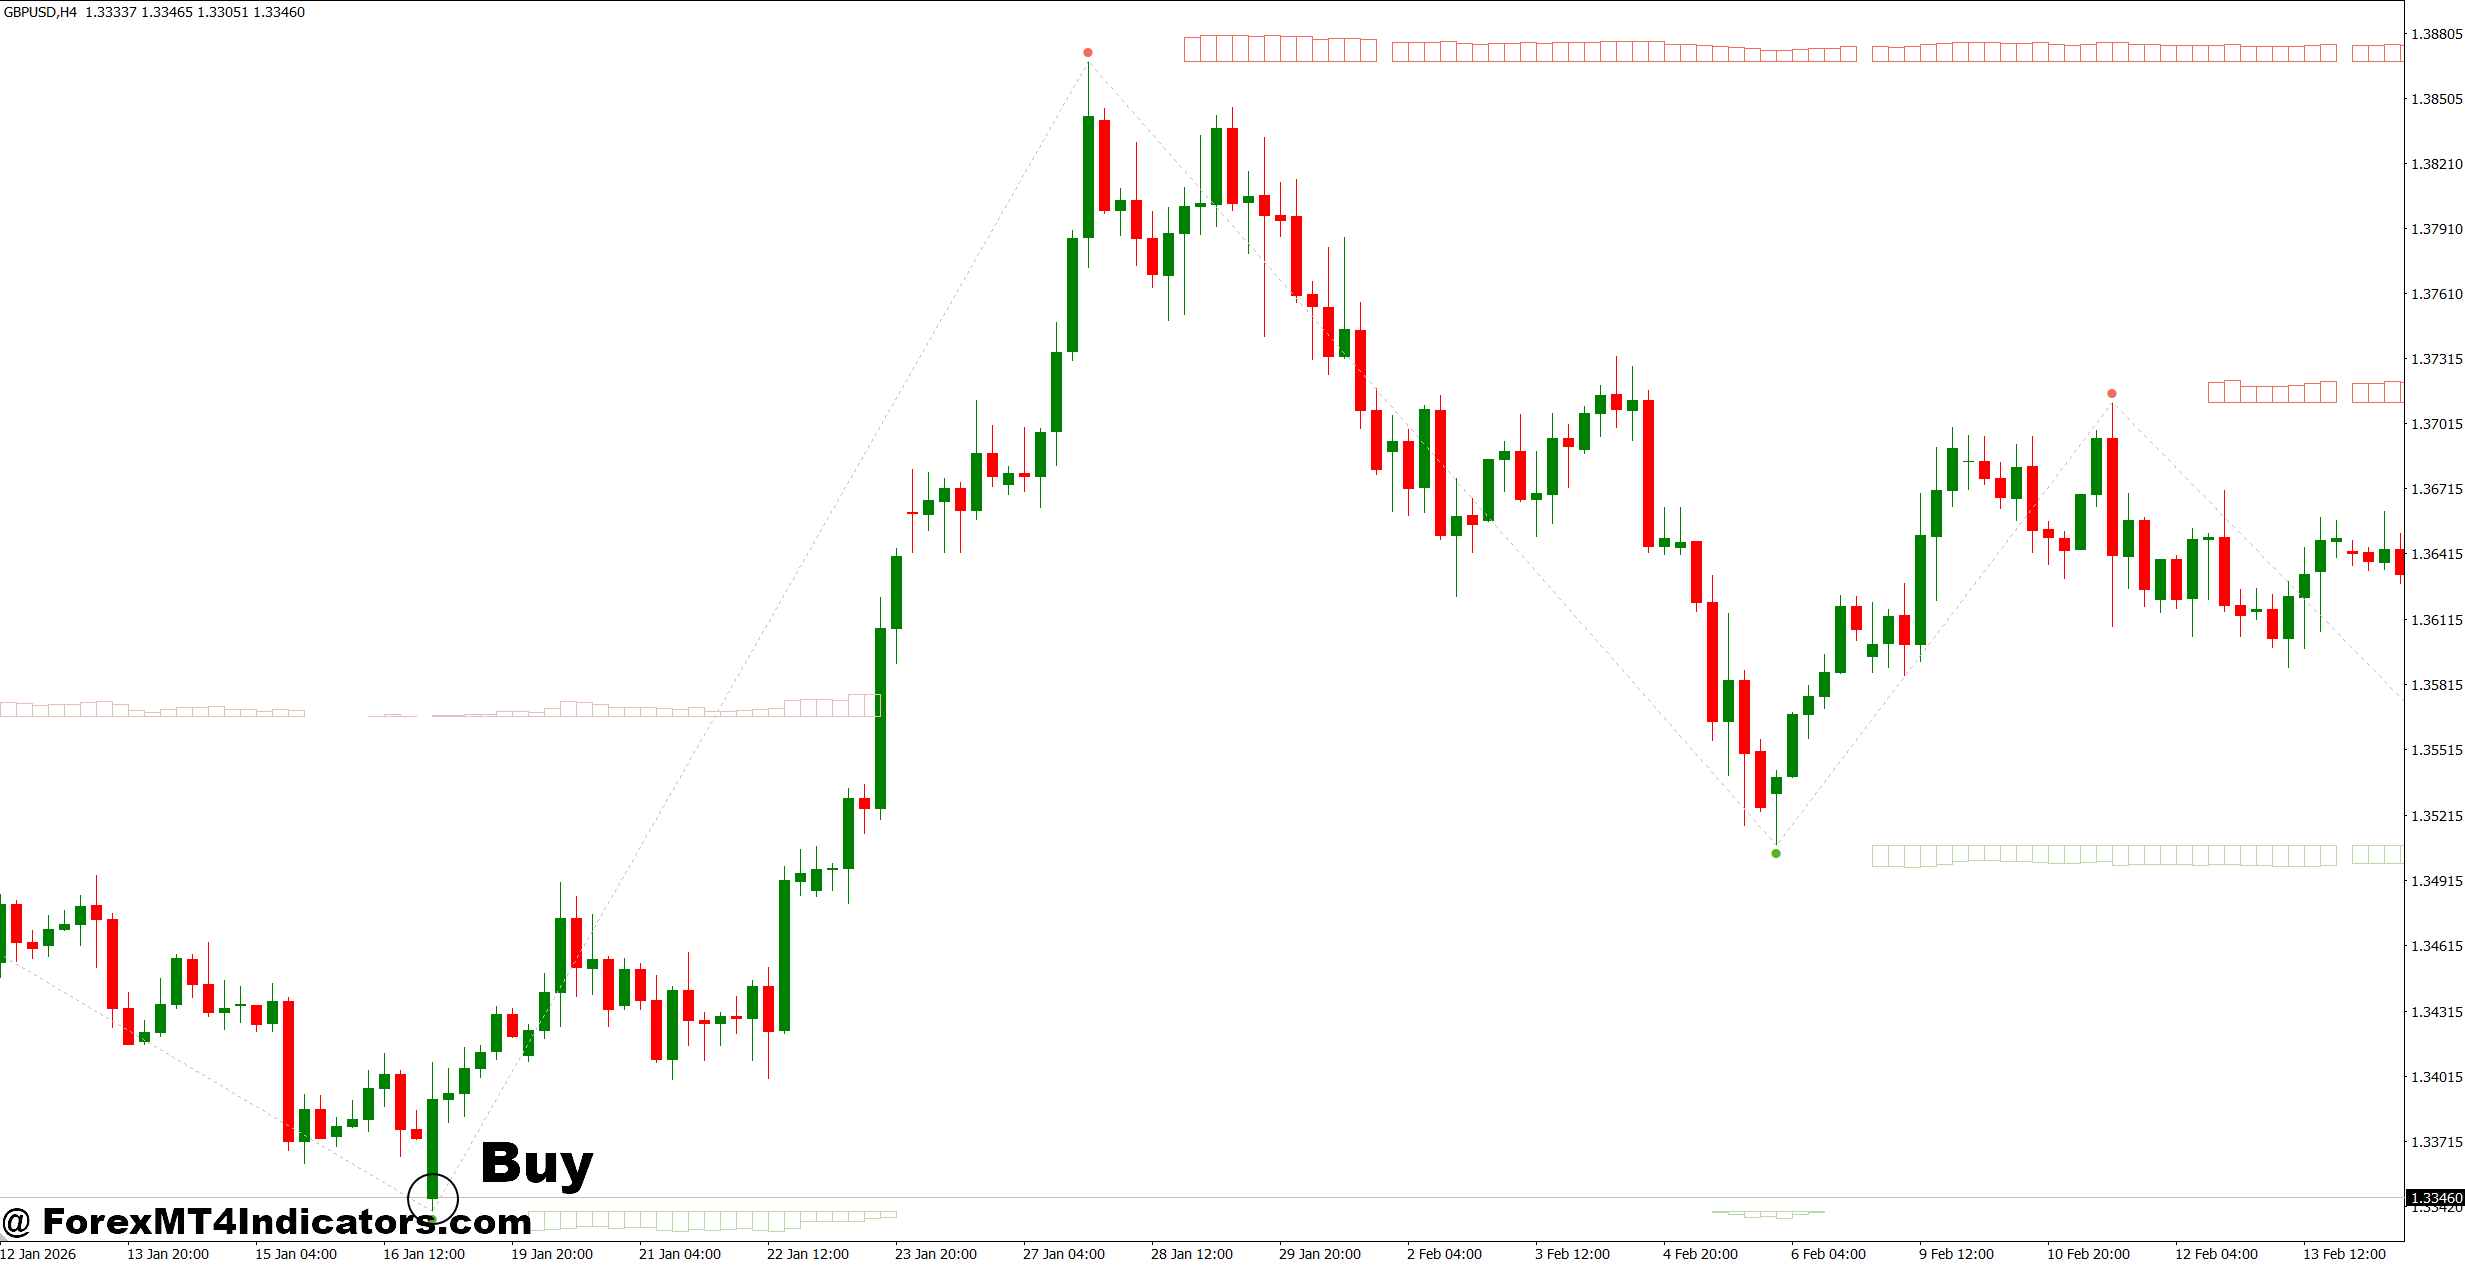
- Buy at fresh demand – Enter EUR/USD on the 1-hour chart when price rejects a fresh demand zone and moves 15–20 pips higher.
- Confirm bullish structure – Wait for a higher high on the 1-hour chart before buying; avoid entries while price keeps making lower lows.
- Use H4 confirmation – Prefer BUY setups when the 4-hour trend is bullish and the demand zone sits below current price.
- Watch strong rejection – A bullish candle with a 10+ pip lower wick inside demand can provide useful entry confirmation.
- Target 1:2 reward – If the stop is 25 pips, aim for at least 50 pips of potential profit before entering.
- Limit trade risk – Risk no more than 1% of account equity per BUY setup, especially when testing the indicator.
- Avoid weak zones – Don’t buy GBP/USD if price breaks 20–30 pips below the marked demand zone with strong bearish candles.
- Check daily direction – Favor BUY trades when the Daily chart supports higher prices; skip countertrend setups unless confirmation is unusually strong.
Sell Entry
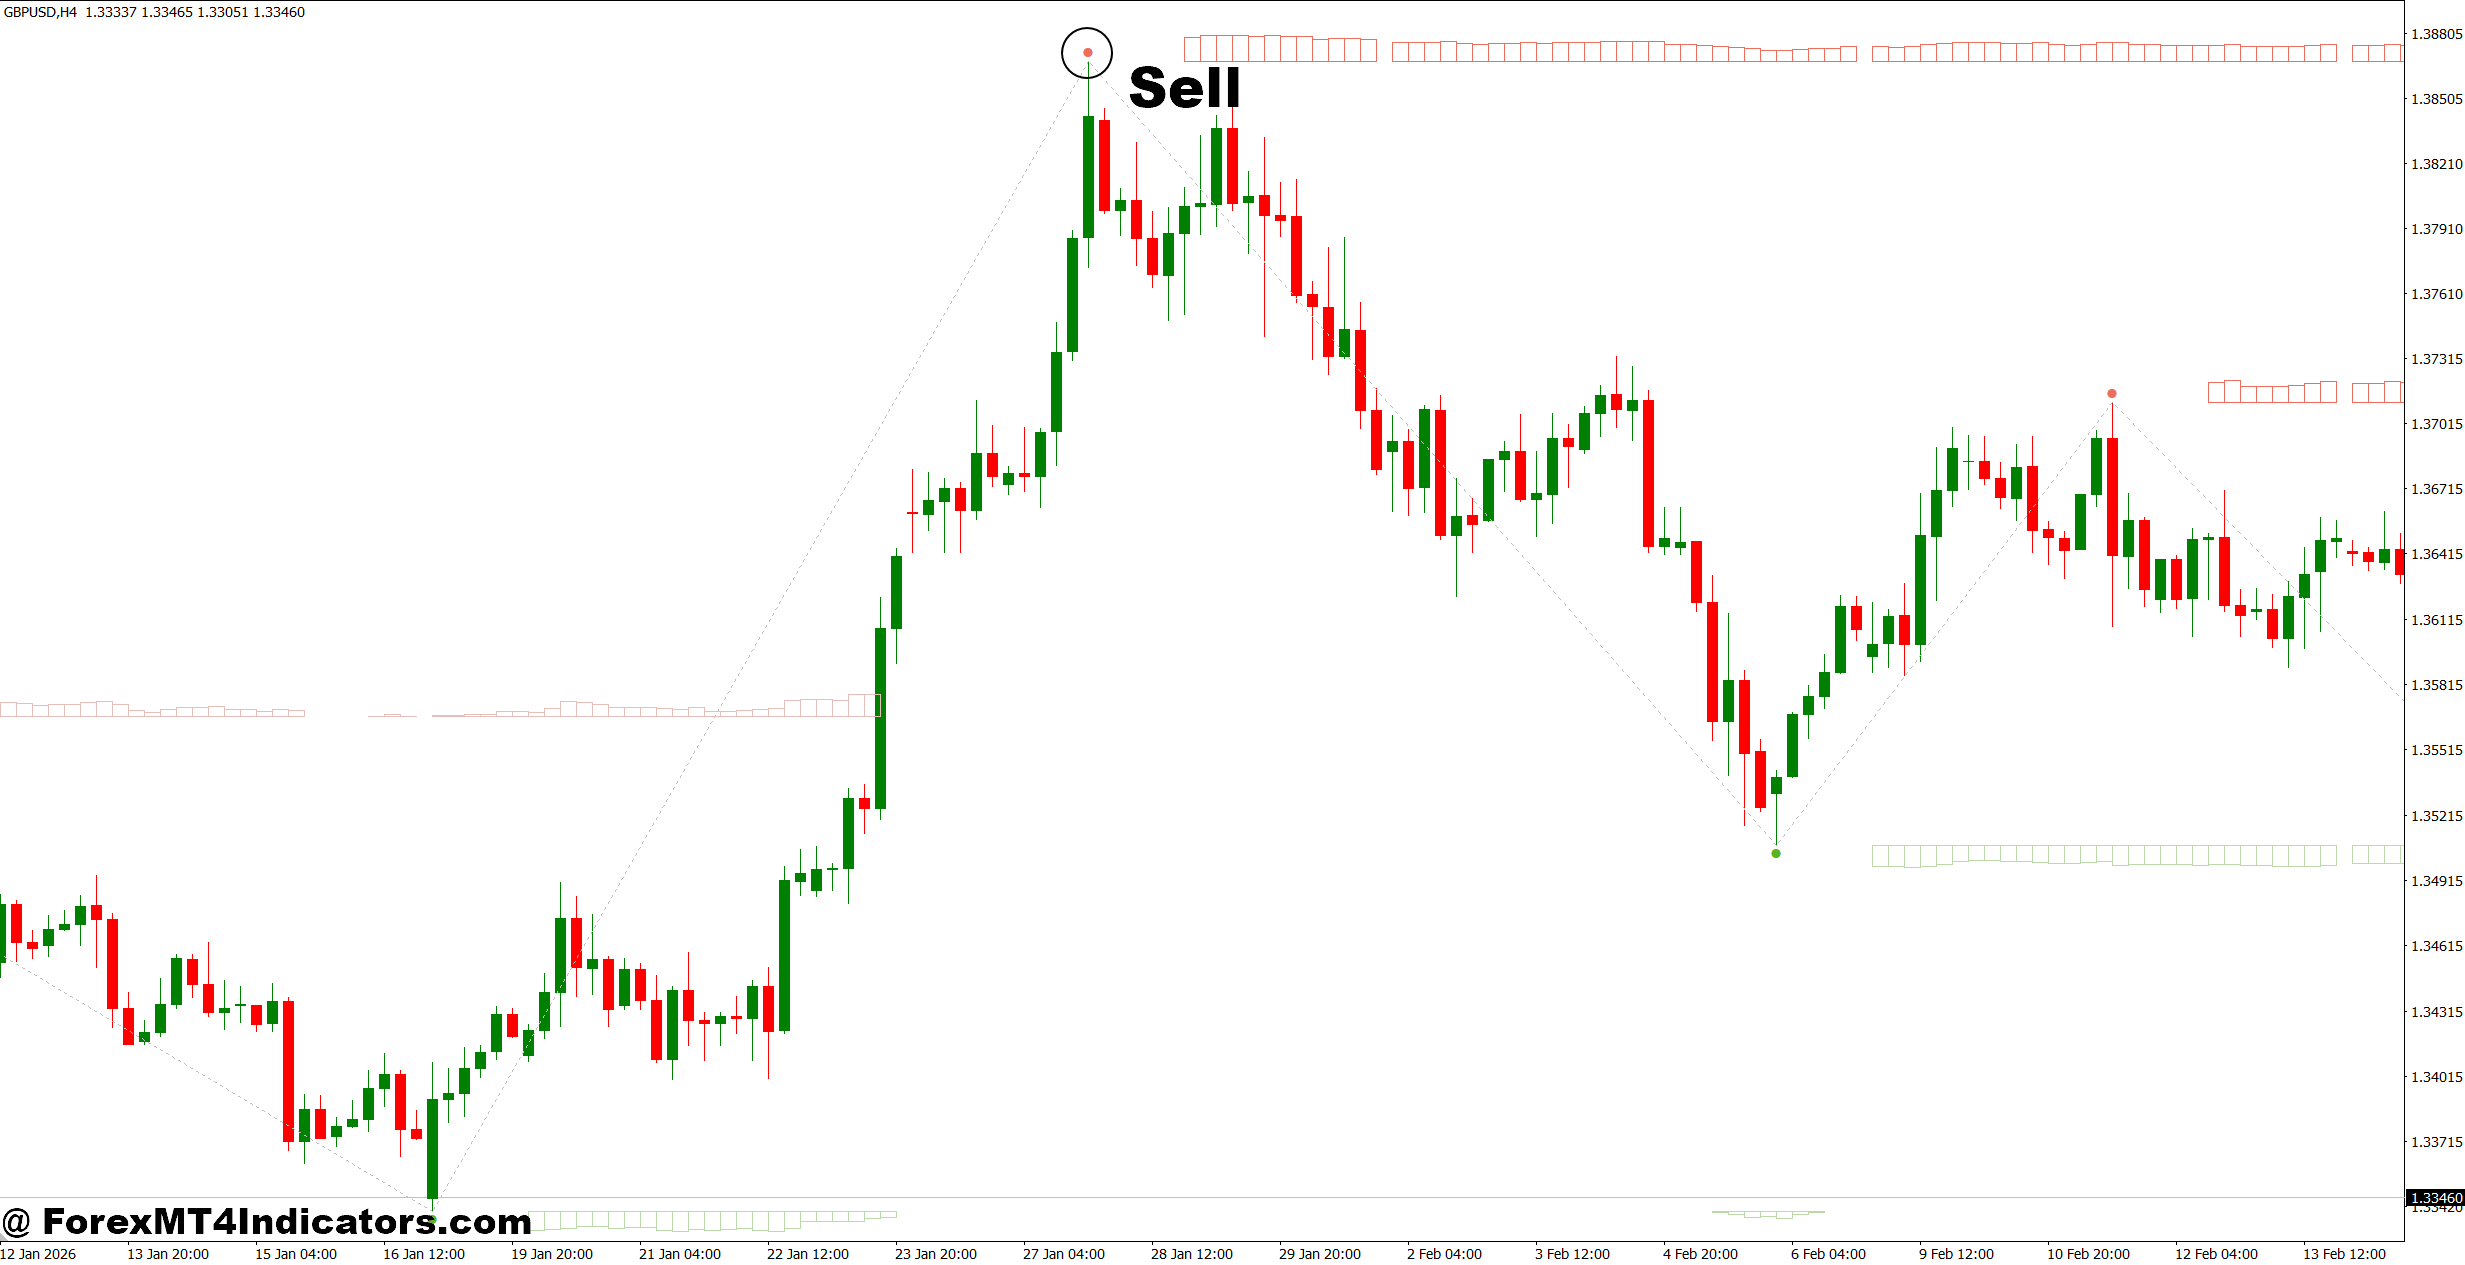
- Sell at fresh supply – Look for GBP/USD on the 1-hour chart to reject a supply zone and fall at least 15 pips before considering entry.
- Confirm bearish structure – Wait for a lower low or lower high on H1 before selling instead of entering during a strong bullish move.
- Use H4 confirmation – Give more weight to SELL signals when the 4-hour trend is bearish and price retraces into supply.
- Watch rejection candles – A 10+ pip upper wick inside supply can signal selling pressure when followed by a bearish close.
- Set a 1:2 target – With a 30-pip stop-loss, look for approximately 60 pips of realistic downside before entering.
- Keep risk below 1% – Reduce position size when the supply zone requires a wider stop, especially on volatile pairs.
- Avoid broken supply – Don’t sell EUR/USD if price closes 20–30 pips above supply with strong bullish momentum.
- Check Daily resistance – Favor SELL setups when the Daily chart shows resistance near the H1/H4 supply zone; avoid selling directly into strong support.
Conclusion
The Supdem Supply and Demand MT4 Indicator can be a useful charting aid for traders who want a clearer way to study potential buying and selling zones. Its biggest value comes from helping traders focus on where price may react rather than chasing every strong candle.
- Supply and demand zones should be treated as areas, not exact lines.
- Higher-timeframe structure can help filter weaker setups.
- Candle confirmation can reduce some fake-outs and whipsaws.
- Position sizing and stop-loss discipline matter more than any indicator setting.
The best approach is to test the indicator on a demo account across several pairs and market conditions before risking real money. A trader who learns to question each zone instead of blindly trading it will usually get far more value from the tool.
Level up your trading
Learn to read the chart — not just the indicator
eBook · Instant PDF
Video Course · 12 modules
Recommended MT4/MT5 Brokers
- ✓ *FREE *$50 to start (withdrawable)
- ✓ Deposit bonus up to $5,000
- ✓ Negative balance protection
Trading forex and CFDs carries a significant risk of loss and is not suitable for everyone. Broker links are affiliate links — we may earn a commission at no cost to you.
Free MT4 Indicator Download

Enter Your Email Address below, download link will be sent to you.
