

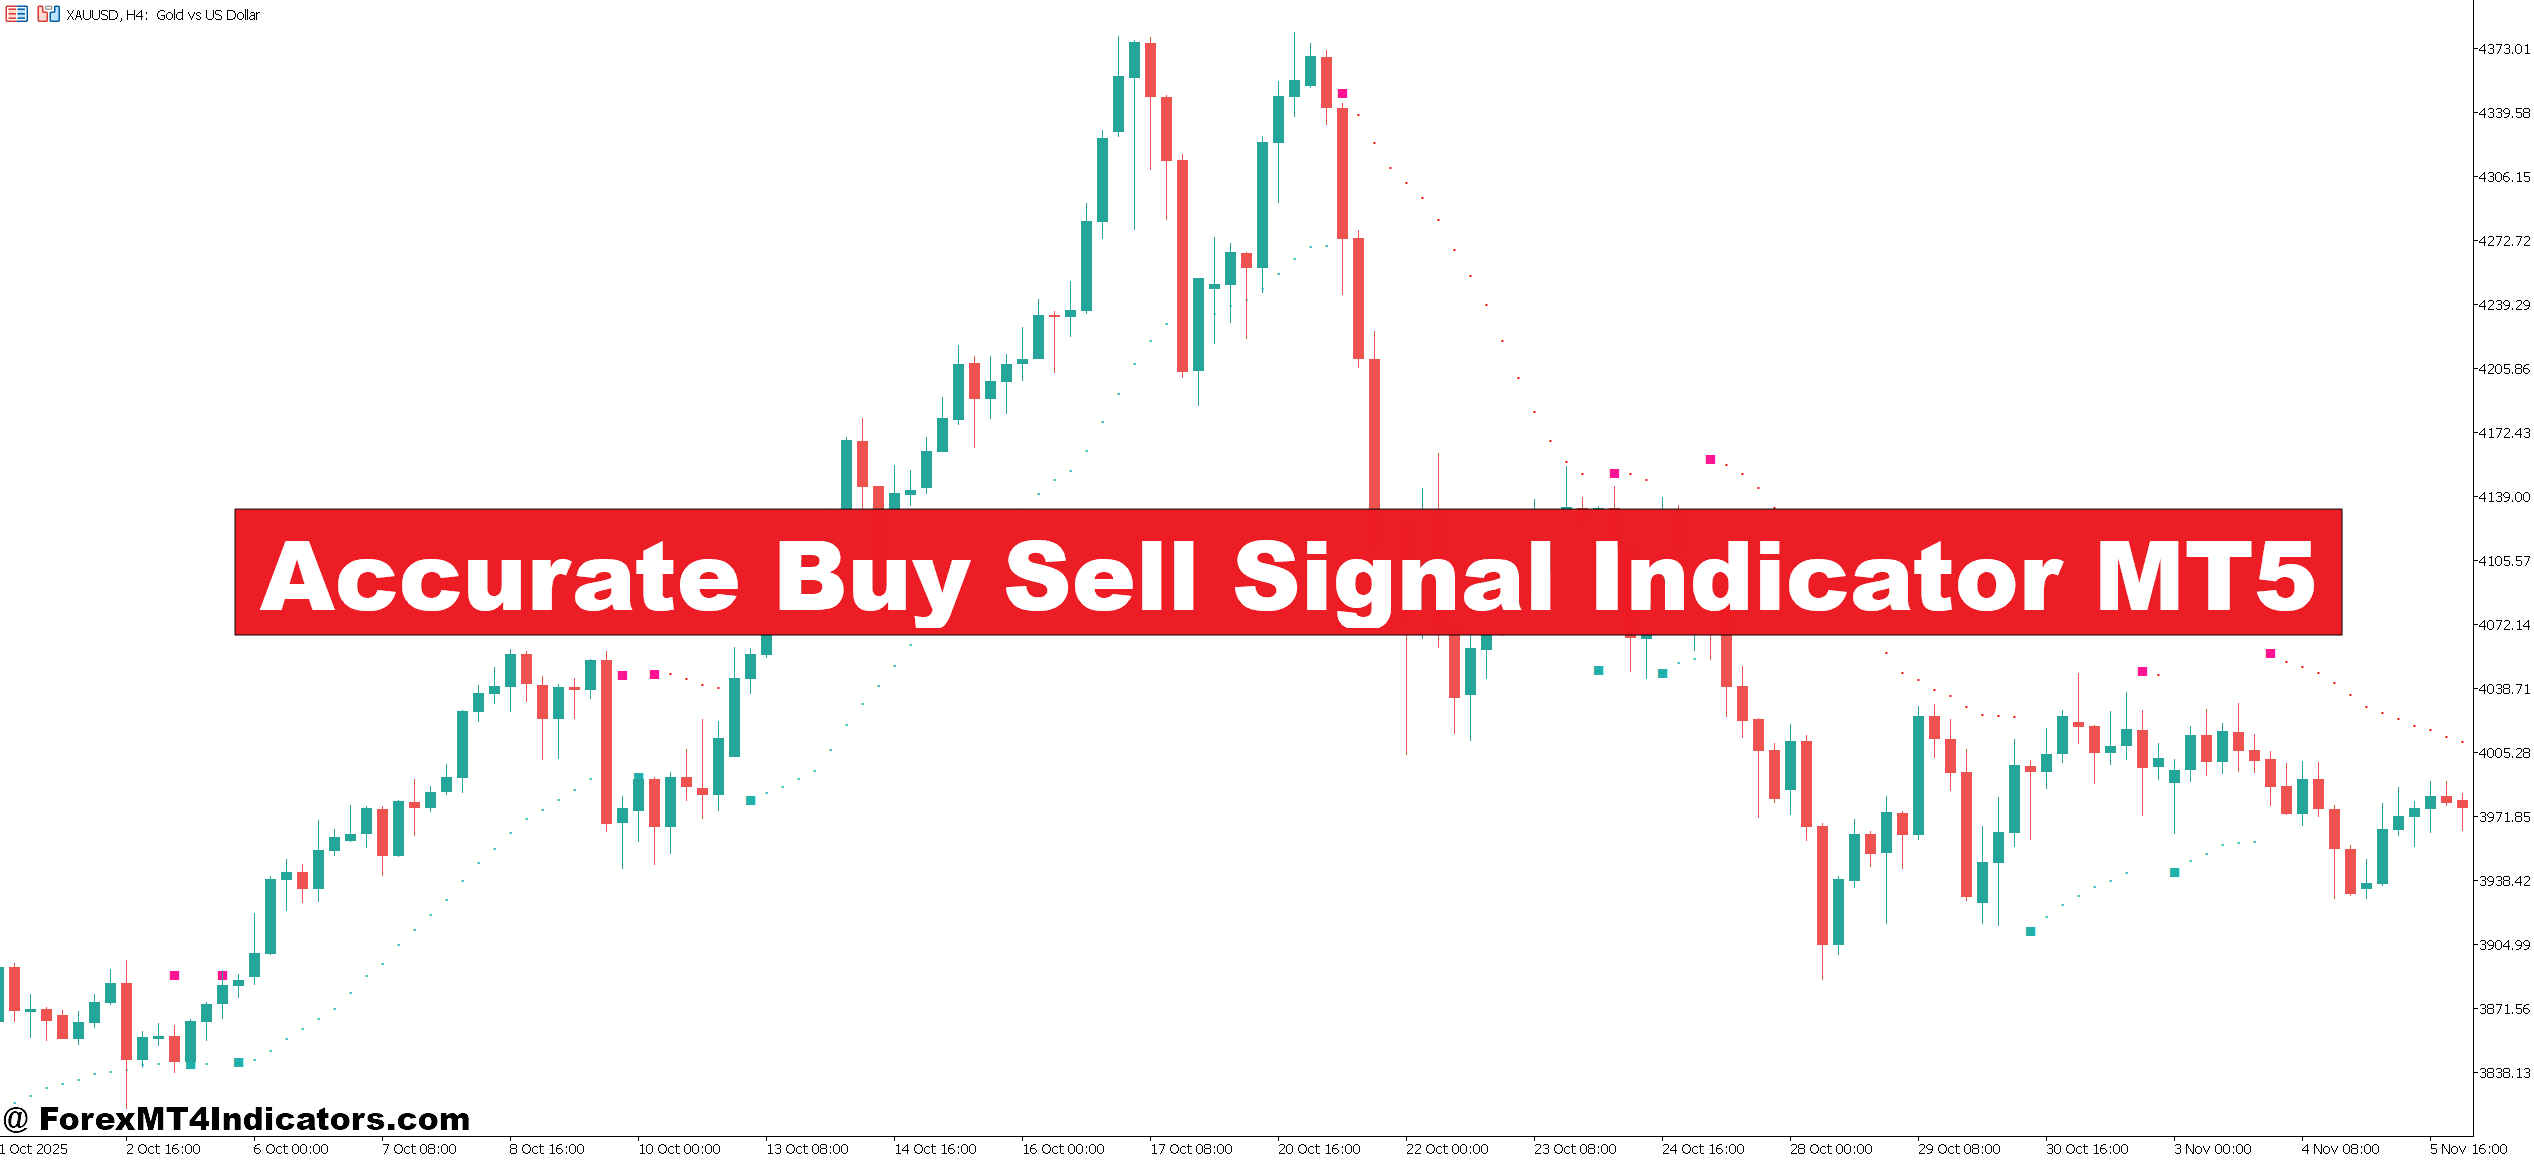
The buy sell signal indicator for MT5 automates the process of scanning for trade entries. When conditions align, it paints an arrow or symbol on the chart — typically a blue or green arrow for a buy and a red arrow for a sell. Traders don’t need to manually check RSI levels, moving average crossovers, or candlestick patterns. The indicator does that in real time.
Most MT5 signal indicators combine several technical elements under the hood. The more reliable ones layer trend direction, momentum, and volatility filters together. A basic version might trigger on a simple moving average crossover — when the 9 EMA crosses above the 21 EMA, a buy signal appears. More sophisticated builds incorporate ATR-based filters to avoid entries during low-volatility chop, or use price action conditions like higher lows to confirm the trend is genuine before signaling.
What makes the MT5 platform particularly well-suited for these tools is its native support for custom indicators through MQL5. That gives developers deep access to price data, allowing signal logic to be complex without slowing down the chart.
How the Signal Logic Works
The calculation process varies by indicator, but here’s a practical example of how a well-built buy sell signal indicator MT5 tool typically operates.
Take a trend-following signal indicator built on a combination of the 50 EMA, a smoothed RSI set to 14 periods, and a volatility gate based on ATR. For a buy signal to fire, three things need to happen: price must be trading above the 50 EMA (confirming an uptrend), the RSI must cross above 50 from below (momentum turning bullish), and the ATR must be above its 10-period average (enough volatility to sustain a move). Only when all three conditions are met does the indicator paint the arrow.
That kind of layered logic filters out a lot of the fake-outs that plague single-indicator systems. On a EUR/USD 1-hour chart during a trending session, this type of setup typically catches the middle portion of moves rather than picking exact tops and bottoms — which is actually fine. Consistent mid-trend entries with proper stop placement outperform trying to nail every reversal.
Here’s the thing: the signal is only as good as the underlying logic. Some indicators repaint — meaning the arrow appears and then disappears as new candles form. Always verify whether a signal indicator repaints before trusting it in live trading. This can be checked by running the indicator on historical data and seeing whether past arrows remain fixed.
Using the Indicator in Real Trading Scenarios
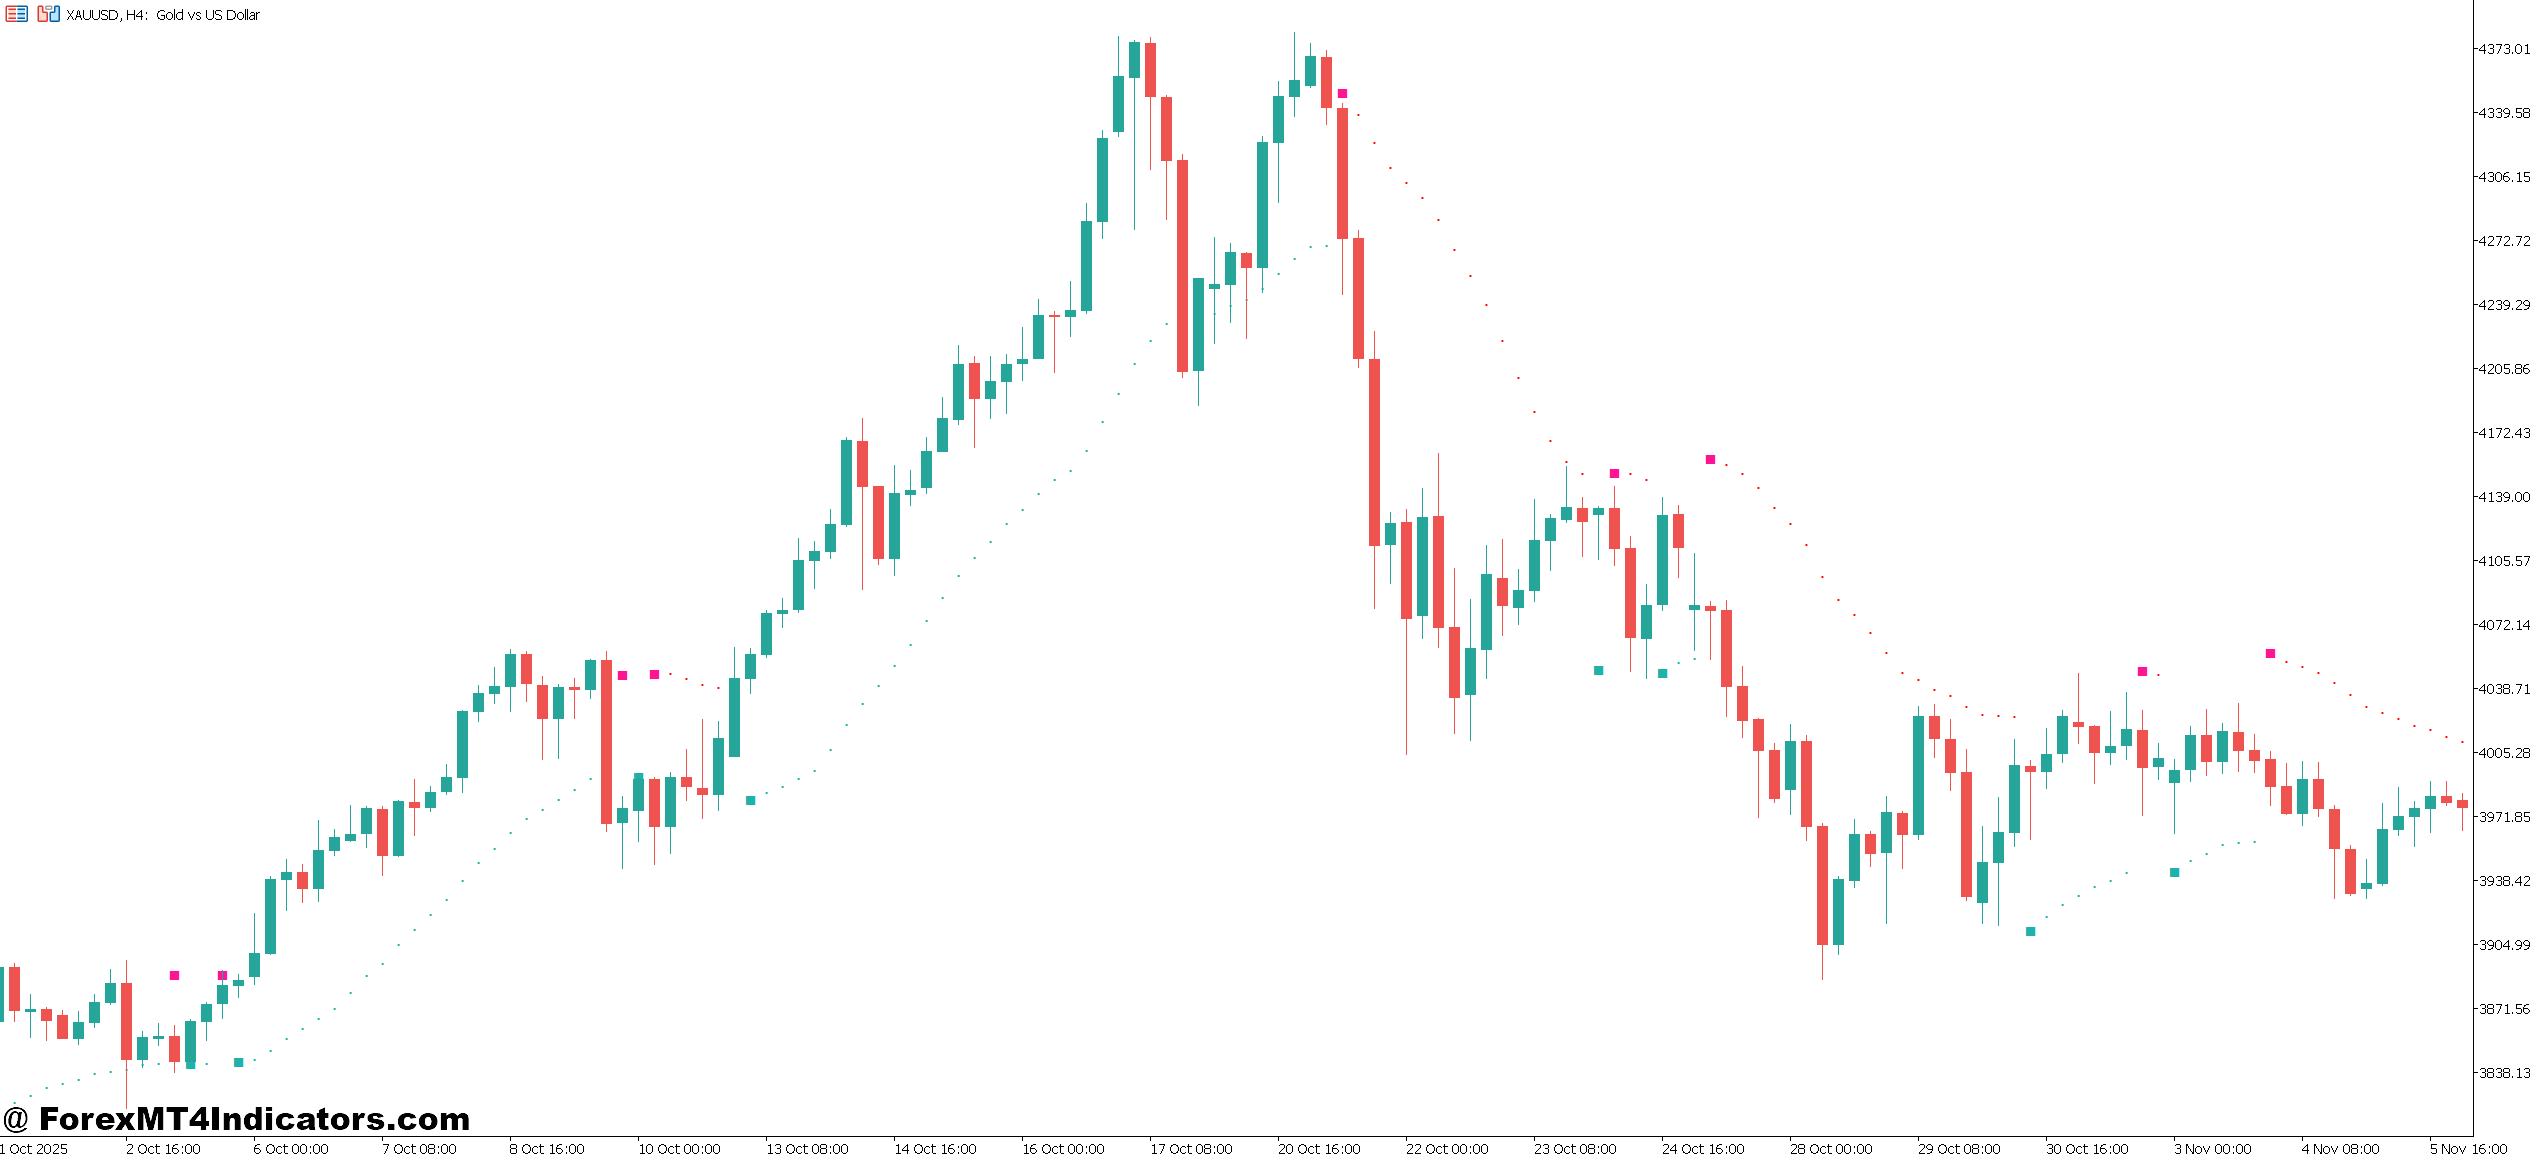
In practice, the most effective approach isn’t to trade every signal blindly. That leads to overtrading, especially in ranging markets.
When testing a buy sell signal indicator on GBP/JPY during the London session, a common finding is that signals fired on the 15-minute chart perform better between 7:00 AM and 11:00 AM GMT than during the Asian session. The pair trends more cleanly during London, so momentum-based signals have higher follow-through.
A practical workflow looks like this: identify the higher timeframe direction first. If the 4-hour chart on USD/CAD shows a clear downtrend — price below the 200 EMA, lower highs in place — then on the 1-hour chart, only sell signals from the indicator get taken. Buy signals are ignored regardless of how clean they look. Filtering signals by higher timeframe bias cuts the number of trades significantly, but it also improves the win rate noticeably.
Stop placement matters too. Putting a stop just below the signal candle’s low for buys (or above the high for sells) keeps risk tight and gives the trade structure. Risking 1% of account equity per trade with that kind of stop placement lets traders weather a losing streak without serious drawdown.
Accurate Buy Sell Signal Indicator MT5 Settings and Customization
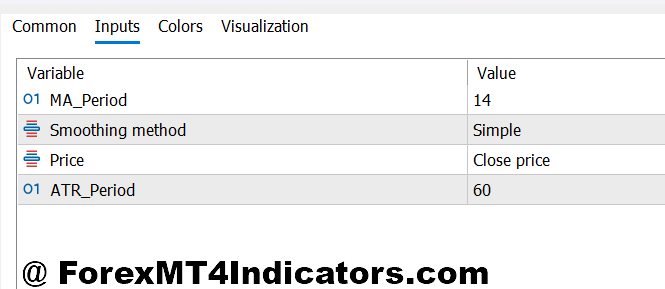
Most MT5 signal indicators expose several adjustable parameters. Understanding what they do helps tune the tool to different markets and timeframes.
Lookback period controls how many candles the indicator analyzes to determine trend and momentum. A shorter period like 8-10 makes the indicator react faster — good for scalping on the 5-minute chart, but it also generates more false signals. A longer period like 20-30 smooths things out and works better for swing trading on the 4-hour or daily chart.
Signal sensitivity is sometimes labeled as a threshold or filter level. Lowering sensitivity on a volatile pair like GBP/USD or USD/JPY reduces noise during news-driven whipsaw conditions. On quieter pairs like EUR/CHF, keeping it at default often works fine.
Alert settings let traders set up pop-up, email, or push notifications when a signal fires. This is genuinely useful for traders who don’t watch charts all day — they can set the indicator on the daily chart and receive an alert when a setup appears, then assess manually whether to take the trade.
For day trading, the 15-minute and 1-hour charts with moderate sensitivity settings tend to offer the best balance between signal frequency and quality. For swing traders, the 4-hour chart with a higher lookback period reduces overtrading and keeps exposure to major moves.
Advantages and Limitations
The main advantage is speed. A buy sell signal indicator processes multiple conditions simultaneously and displays results instantly. That removes hesitation and makes execution more mechanical, which helps traders stick to a plan rather than getting emotional about entries.
Signals also give traders a reference point for structuring trades — where to enter, where to logically place a stop, and where the next resistance or support level sits as a target.
That said, the limitations are real. No indicator works consistently across all market conditions. During extended sideways periods — think EUR/USD ranging in a 40-pip band for two days before an ECB decision — signal indicators tend to churn out losing trades because the logic assumes trending behavior. Recognizing ranging conditions and stepping aside is a skill the indicator won’t develop for the trader.
Backtesting results on a single timeframe or currency pair don’t guarantee future performance. Markets shift. A signal strategy that worked beautifully on AUD/USD through 2022 may underperform in 2024 if volatility patterns or correlations have changed. Regular review and occasional re-optimization of settings are part of using these tools responsibly.
Trading forex carries substantial risk. No indicator guarantees profits, and past performance on historical data does not ensure future results. Always use proper risk management and only trade with capital you can afford to lose.
How to Trade with Accurate Buy Sell Signal Indicator MT5
Buy Entry
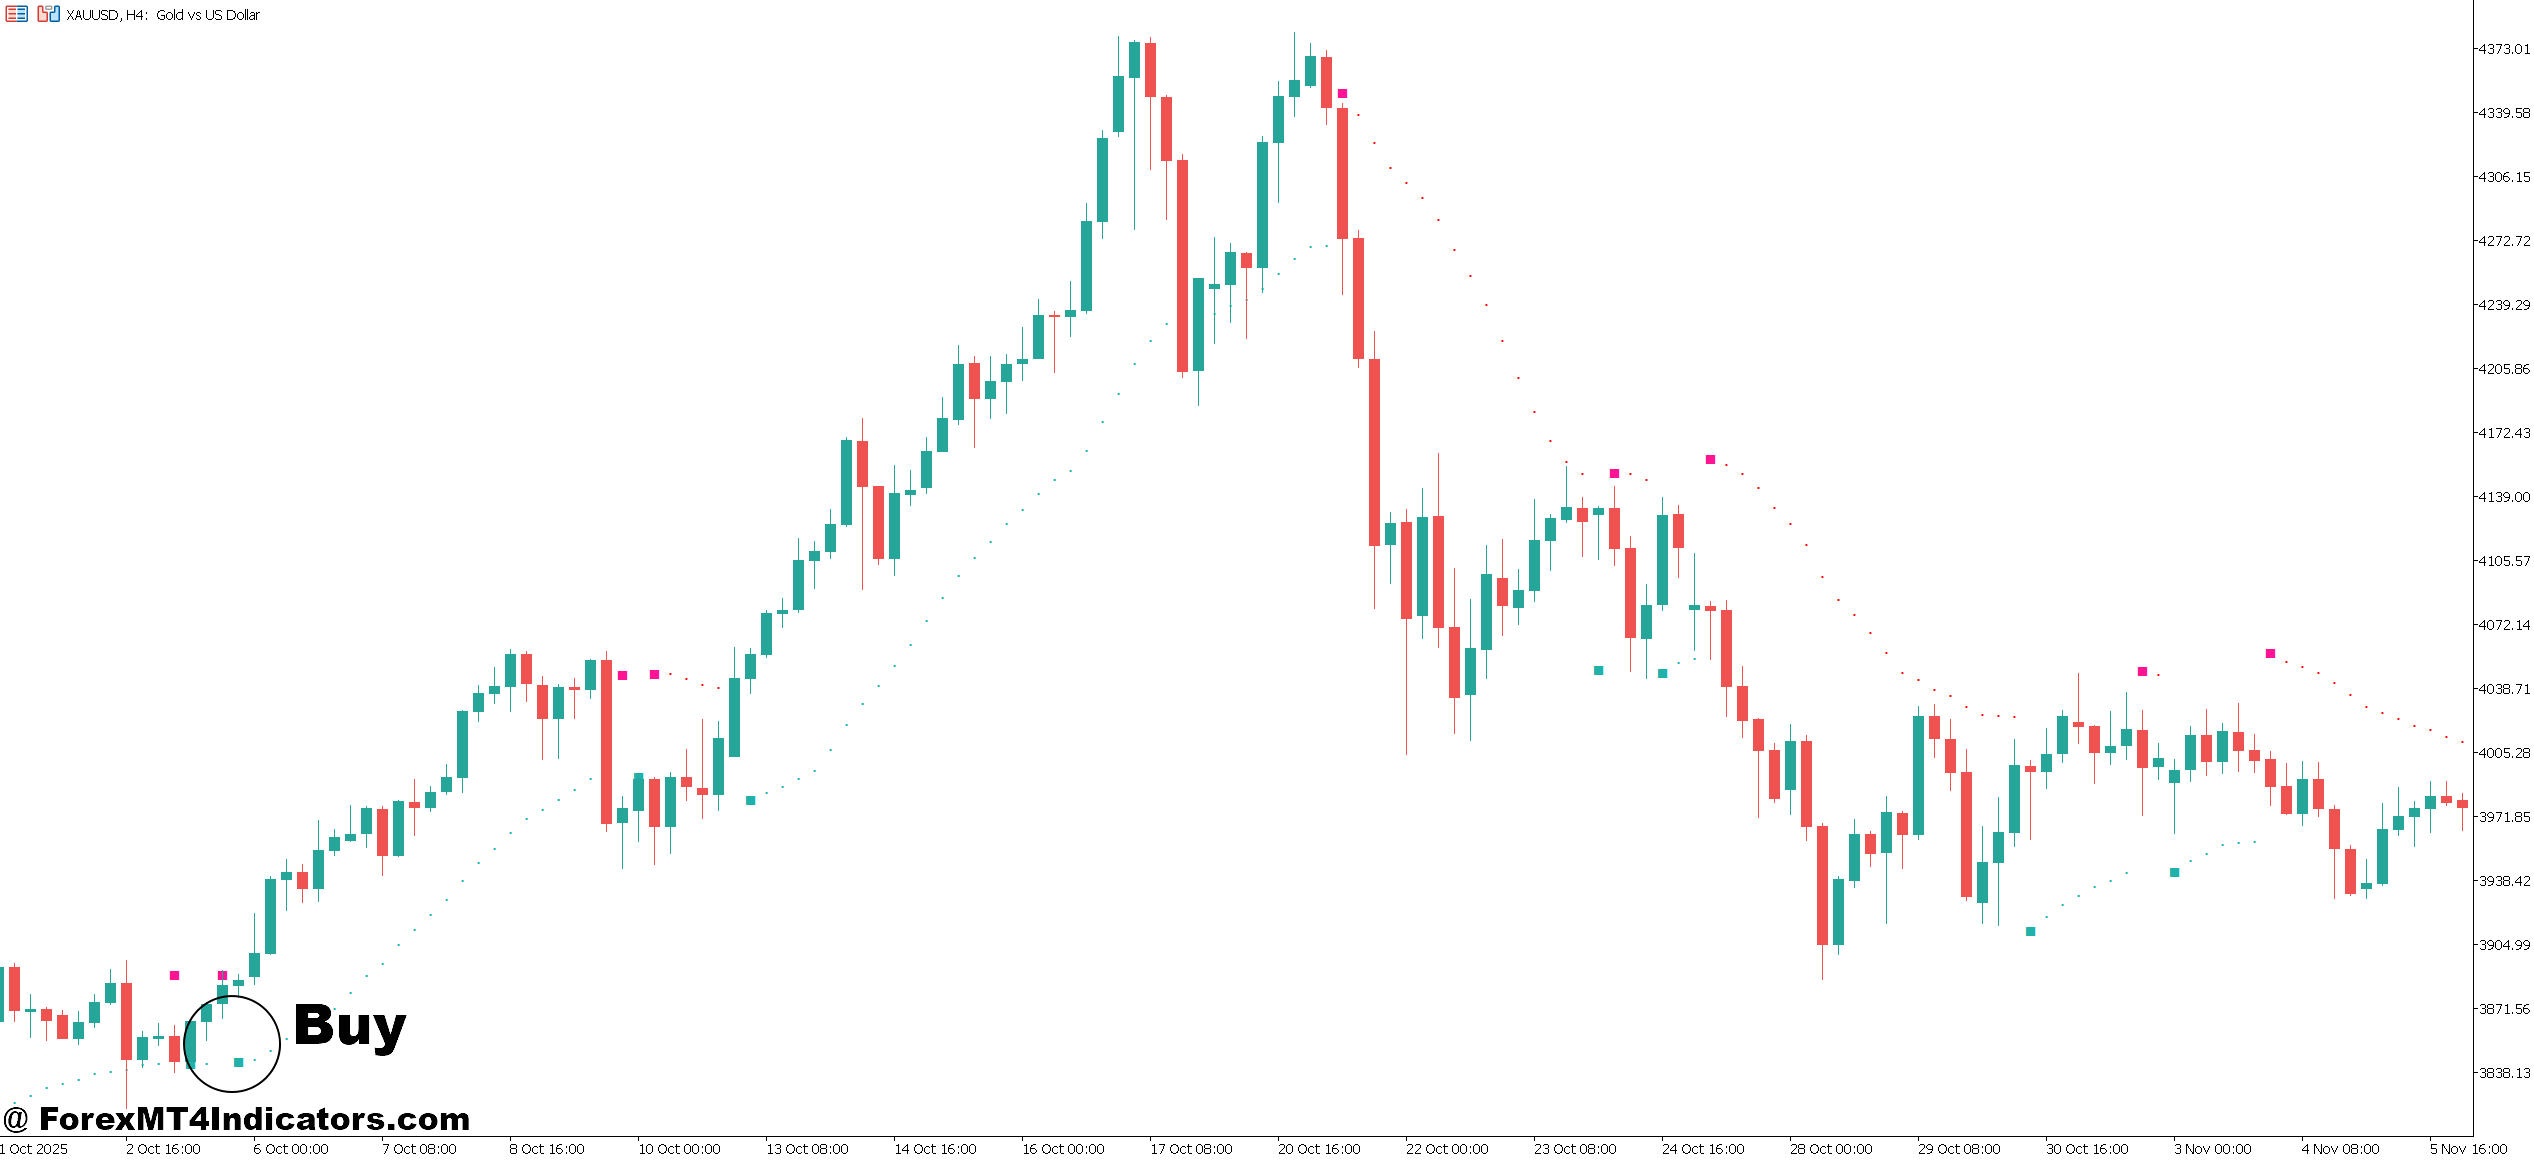
- Wait for blue arrow confirmation– Only enter after the buy arrow fully forms and the candle closes. Never jump in mid-candle — a half-formed signal on EUR/USD 1-hour has faked out many traders.
- Check 4-hour trend alignment– If the 4-hour chart shows price above the 50 EMA, the buy signal is valid. Trading against the higher timeframe trend drops win rate by 30–40%.
- Enter at market open of next candle– Place the buy order at the open of the candle following the signal. This gives a cleaner entry and tighter spread, especially on GBP/USD during London session.
- Set stop loss 5–10 pips below signal candle low– Keep risk fixed. A 10-pip stop on a standard lot risks $100 — size your position so that’s 1% of your account max.
- Target the nearest resistance level– Aim for a 1:2 risk-reward minimum. If your stop is 8 pips, target at least 16 pips profit before closing the trade.
- Skip signals during major news events– Avoid taking buys within 30 minutes of NFP, CPI, or central bank decisions. The spread widens and slippage can turn a good signal into a bad trade.
- Confirm with volume or momentum– On the daily chart, a buy signal with above-average volume (or rising RSI above 50) adds confidence. Low-volume signals in chop tend to fail faster.
- Use daily chart signals for swing trades– A buy arrow on the EUR/USD daily chart holds more weight than a 15-minute signal. Swing traders should prioritize higher timeframe entries and hold 3–5 days minimum.
Sell Entry
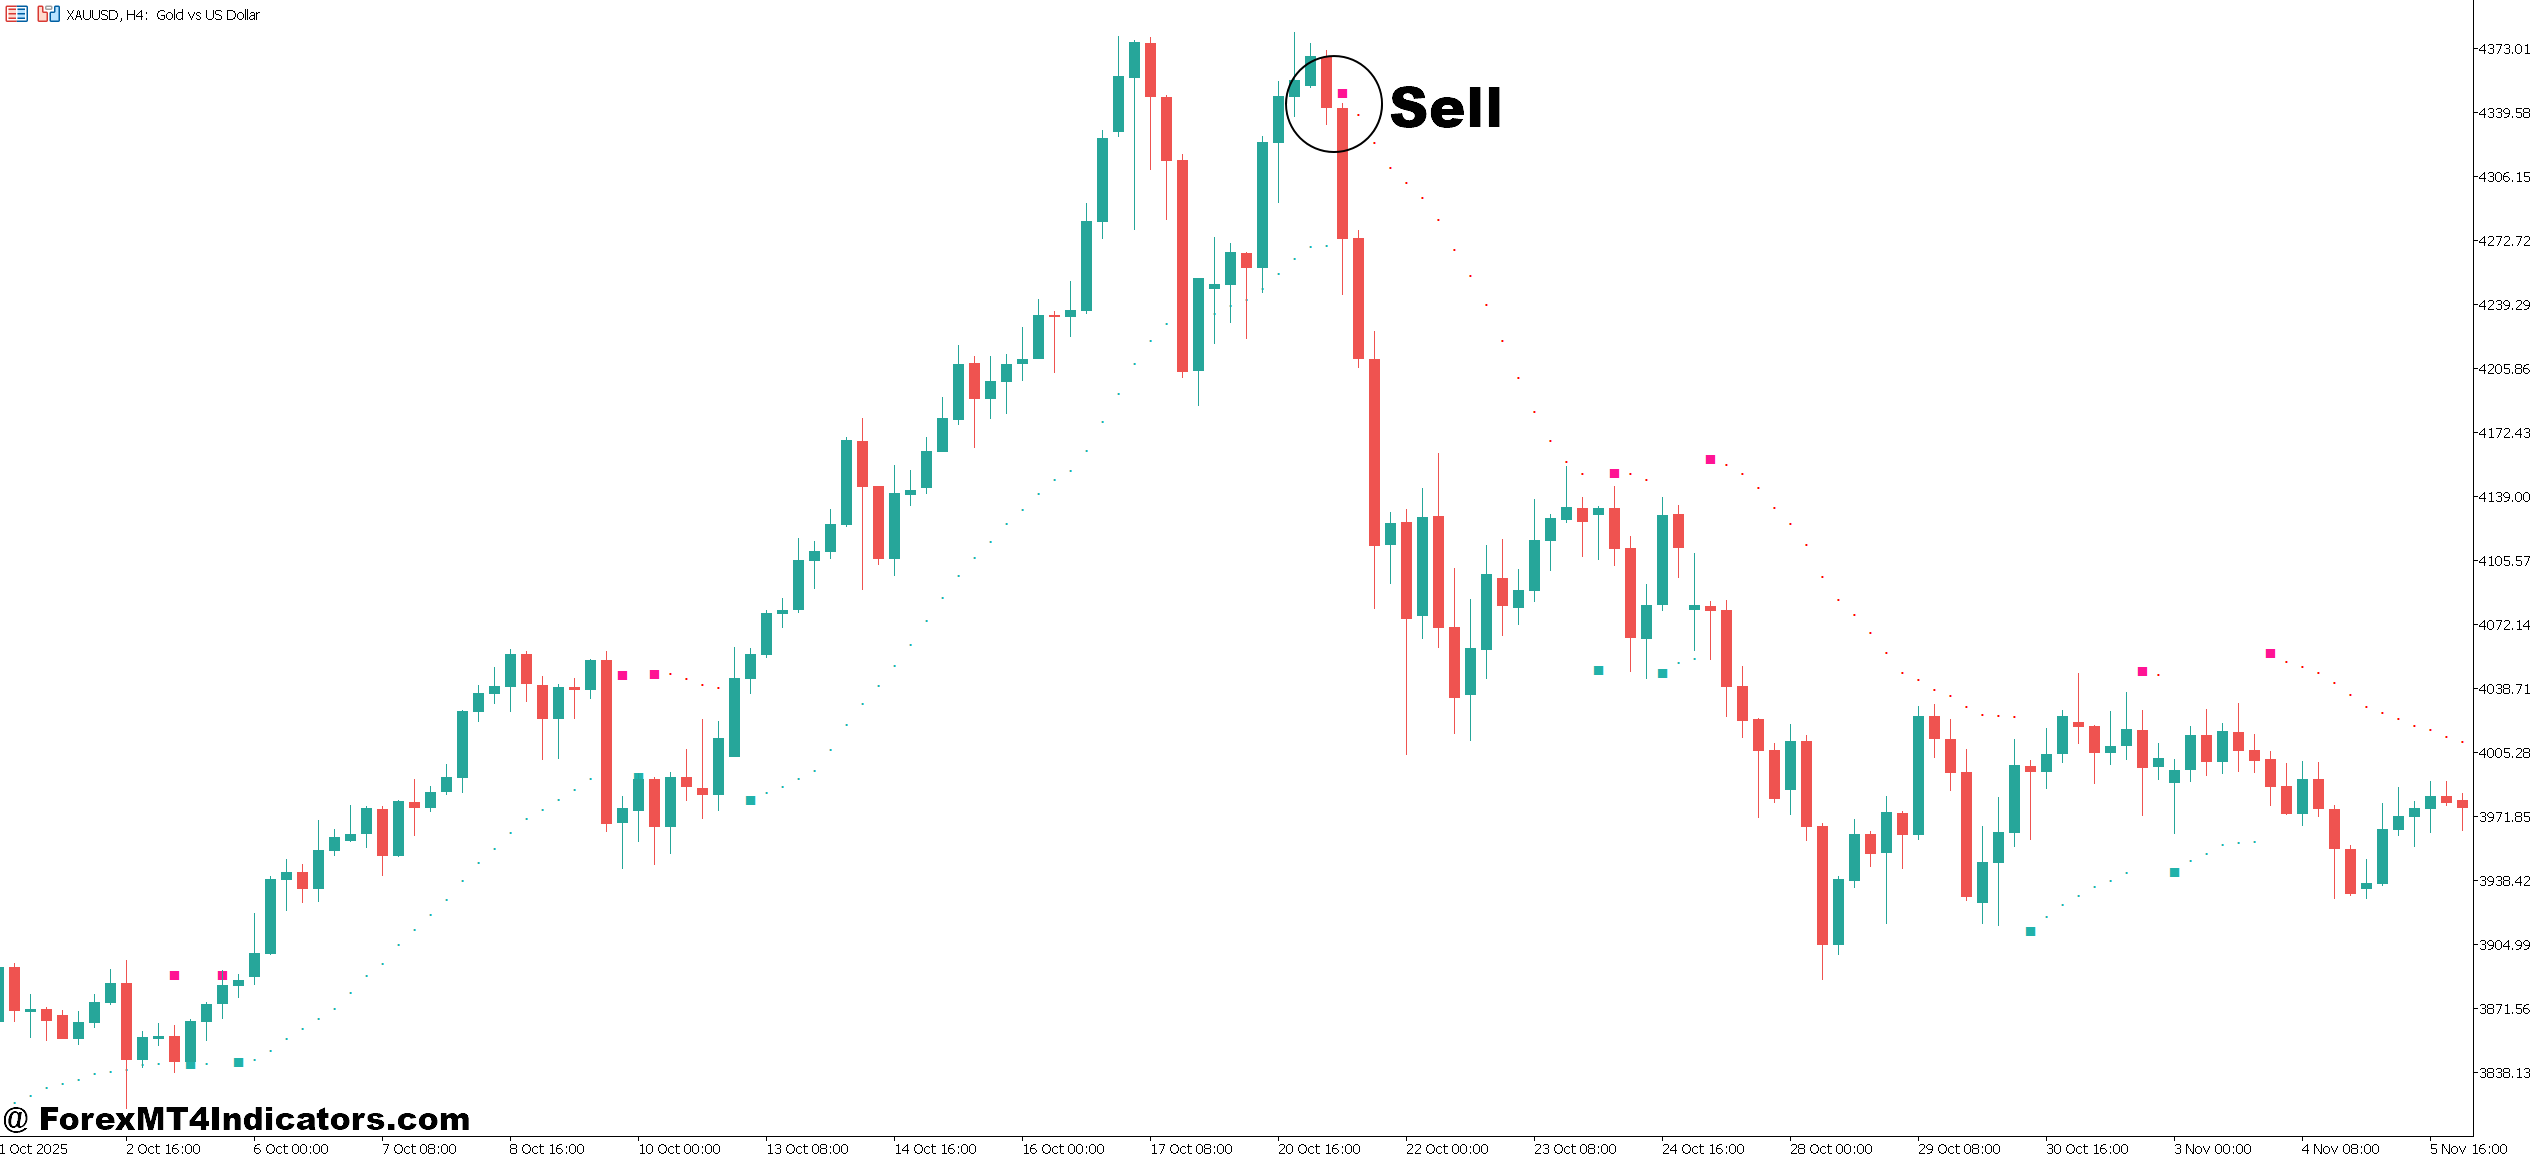
- Wait for red arrow to close fully– Same rule as buys — let the candle close before acting. A signal on GBP/USD that disappears before candle close is a repaint trap, not a trade.
- Confirm 4-hour downtrend structure– Price should be making lower highs on the 4-hour chart. Selling into an uptrend because a sell arrow appeared on the 15-minute chart is one of the most common losing patterns.
- Enter at open of next candle– Place the sell order at the start of the following candle. Avoid market orders during the last 5 minutes of a session — spreads spike.
- Place stop loss 5–10 pips above signal candle high– Tight, logical stop placement. On volatile pairs like GBP/JPY, consider 12–15 pips to account for natural price noise without getting stopped on a wick.
- Target nearest support zone for exit– Identify the closest support level below entry and set take profit there. Don’t move targets further away mid-trade hoping for more — take what the market offers.
- Avoid sell signals near key support levels– If price is sitting right on major daily support, a sell signal on the 1-hour chart is risky. The bigger timeframe level usually wins.
- Skip signals in ranging conditions– When EUR/USD has been moving in a 30–40 pip range for 6+ hours with no clear direction, sell signals churn out losses. Wait for a breakout or sit out.
- Trail stop after 15+ pips in profit– Once a sell trade moves 15 pips in your favor, move stop to breakeven. Let the indicator or a trailing stop handle the rest rather than closing early out of fear.
Final Thoughts
A well-built accurate buy sell signal indicator for MT5 is a legitimate tool for simplifying trade entry decisions. It doesn’t replace market understanding, and it won’t compensate for poor risk management. But for traders who’ve built a directional framework — whether that’s trend following, momentum trading, or mean reversion — a reliable signal indicator adds consistency to execution.
The traders who get the most out of these tools treat the signal as one input, not a final answer. They confirm it against the broader market context, manage position size with discipline, and accept that losses are part of the process. Used that way, a quality buy sell signal indicator becomes a practical part of a repeatable trading approach — not a shortcut, but a structured aid.
Level up your trading Learn to read the chart — not just the indicator eBook · Instant PDF Video Course · 12 modules Trading forex and CFDs carries a significant risk of loss and is not suitable for everyone. Broker links are affiliate links — we may earn a commission at no cost to you.Recommended MT4/MT5 Brokers
Free MT4 Indicator Download

Enter Your Email Address below, download link will be sent to you.