


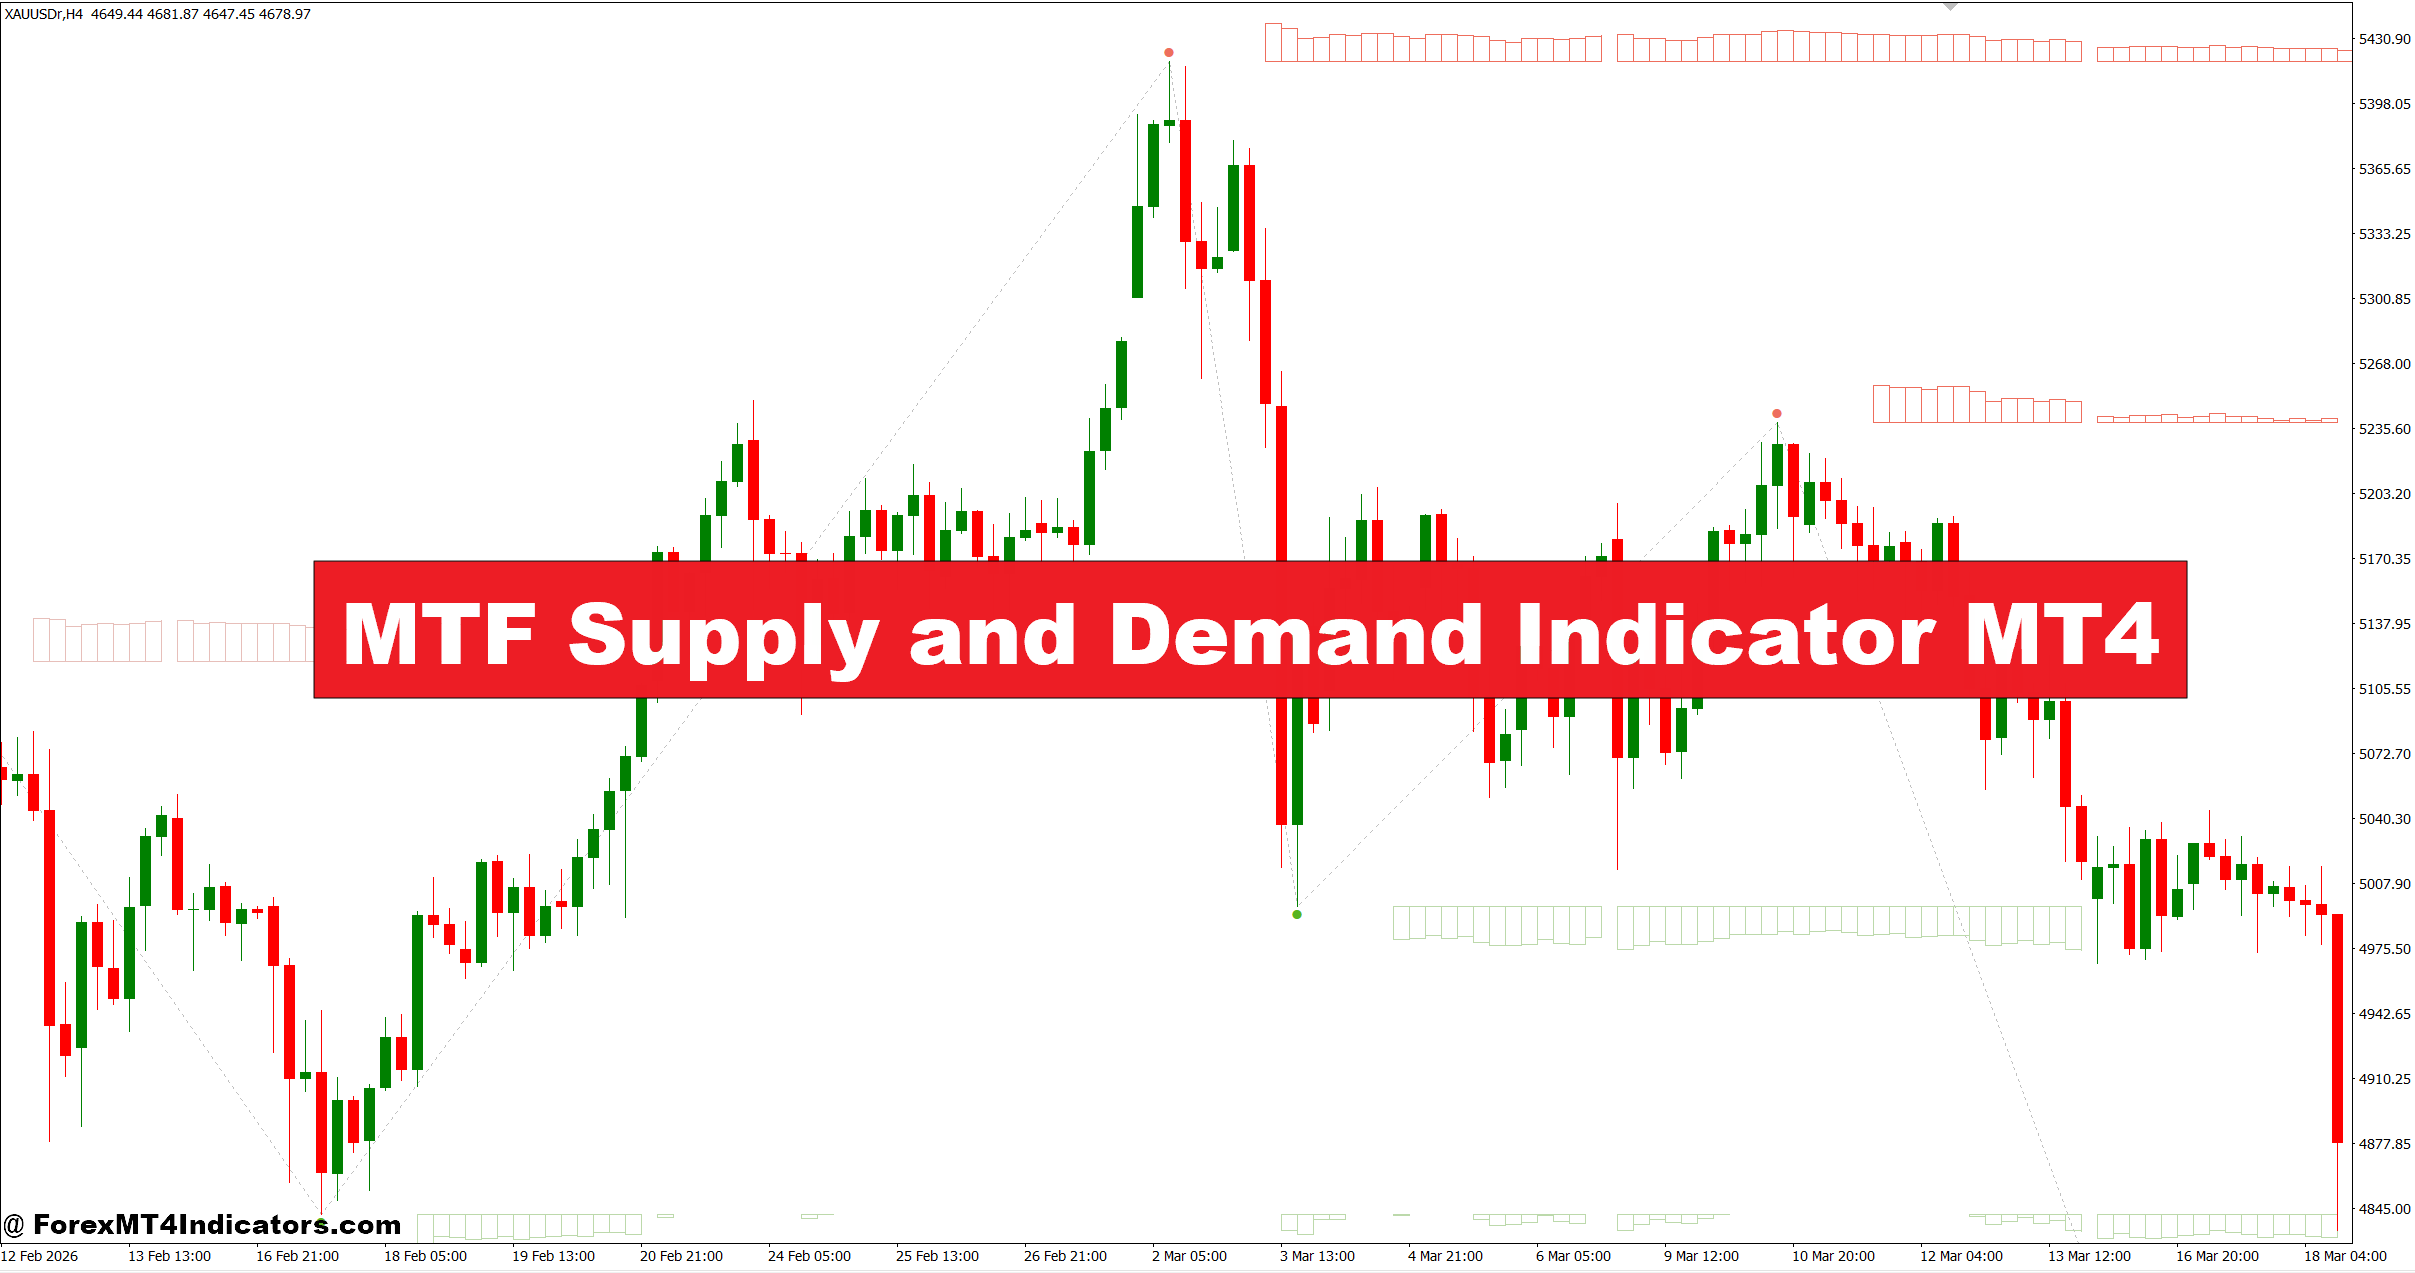
The MTF Supply and Demand Indicator MT4 helps reduce that problem by displaying supply and demand zones from multiple timeframes on one chart, making it easier to spot stronger price levels before entering a trade.
Missing these higher-timeframe zones often leads to poor entries, unnecessary losses, and emotional decisions. A trader might buy directly into a daily supply area without realizing it, only to watch the market reverse within minutes. Those repeated mistakes can slowly damage confidence and trading discipline.
This indicator offers a practical way to see where institutional buying and selling pressure has appeared in the past. Instead of guessing which support or resistance level matters most, traders can make decisions using broader market structure. Let’s look at how it works, where it performs well, and what traders should know before adding it to their trading plan.
Understanding the MTF Supply and Demand Indicator MT4
The MTF Supply and Demand Indicator MT4 is a technical analysis tool that automatically identifies supply and demand zones across several timeframes. MTF stands for “Multi-Timeframe,” meaning the indicator can display areas from charts such as H4, Daily, or Weekly while the trader works on a lower timeframe like M15 or H1.
Supply zones highlight areas where strong selling pressure previously pushed prices lower. Demand zones show where buyers entered aggressively and created upward momentum. These zones often act as potential reversal or reaction areas because many traders and institutions continue watching them.
Unlike ordinary support and resistance lines, supply and demand zones cover price ranges instead of a single level. This gives traders a more realistic view since price rarely turns at the exact same price every time.
One useful feature is that traders don’t need to switch constantly between charts. The indicator keeps higher-timeframe zones visible, helping them maintain better awareness of the overall market structure.
How the Indicator Identifies Trading Zones
The indicator scans historical price action for strong impulsive moves that begin after a period of consolidation. When price leaves a base with large candles and high momentum, the indicator marks that area as either supply or demand.
The logic follows a simple idea. If buyers pushed EUR/USD from 1.0850 to 1.0965 within two trading sessions, there’s a good chance large buy orders were placed around that starting point. If price revisits the same area later, those remaining orders may still influence the market.
In practice, the indicator looks for:
- Strong breakout candles leaving a consolidation.
- Sharp momentum away from the base.
- Areas with limited previous testing.
- Multi-timeframe alignment between larger and smaller charts.
For example, EUR/USD on the 1-hour chart may approach a demand zone created from the Daily timeframe around 1.1020. Instead of buying immediately, an experienced trader often waits for a bullish engulfing candle or rejection wick before entering. That extra confirmation helps reduce false entries during volatile sessions.
When testing this approach during Non-Farm Payroll (NFP) releases, many traders notice that price may briefly spike through a demand zone before recovering. Waiting until volatility settles often produces cleaner entries than placing pending orders directly inside the zone.
Using the Indicator in Real Trading
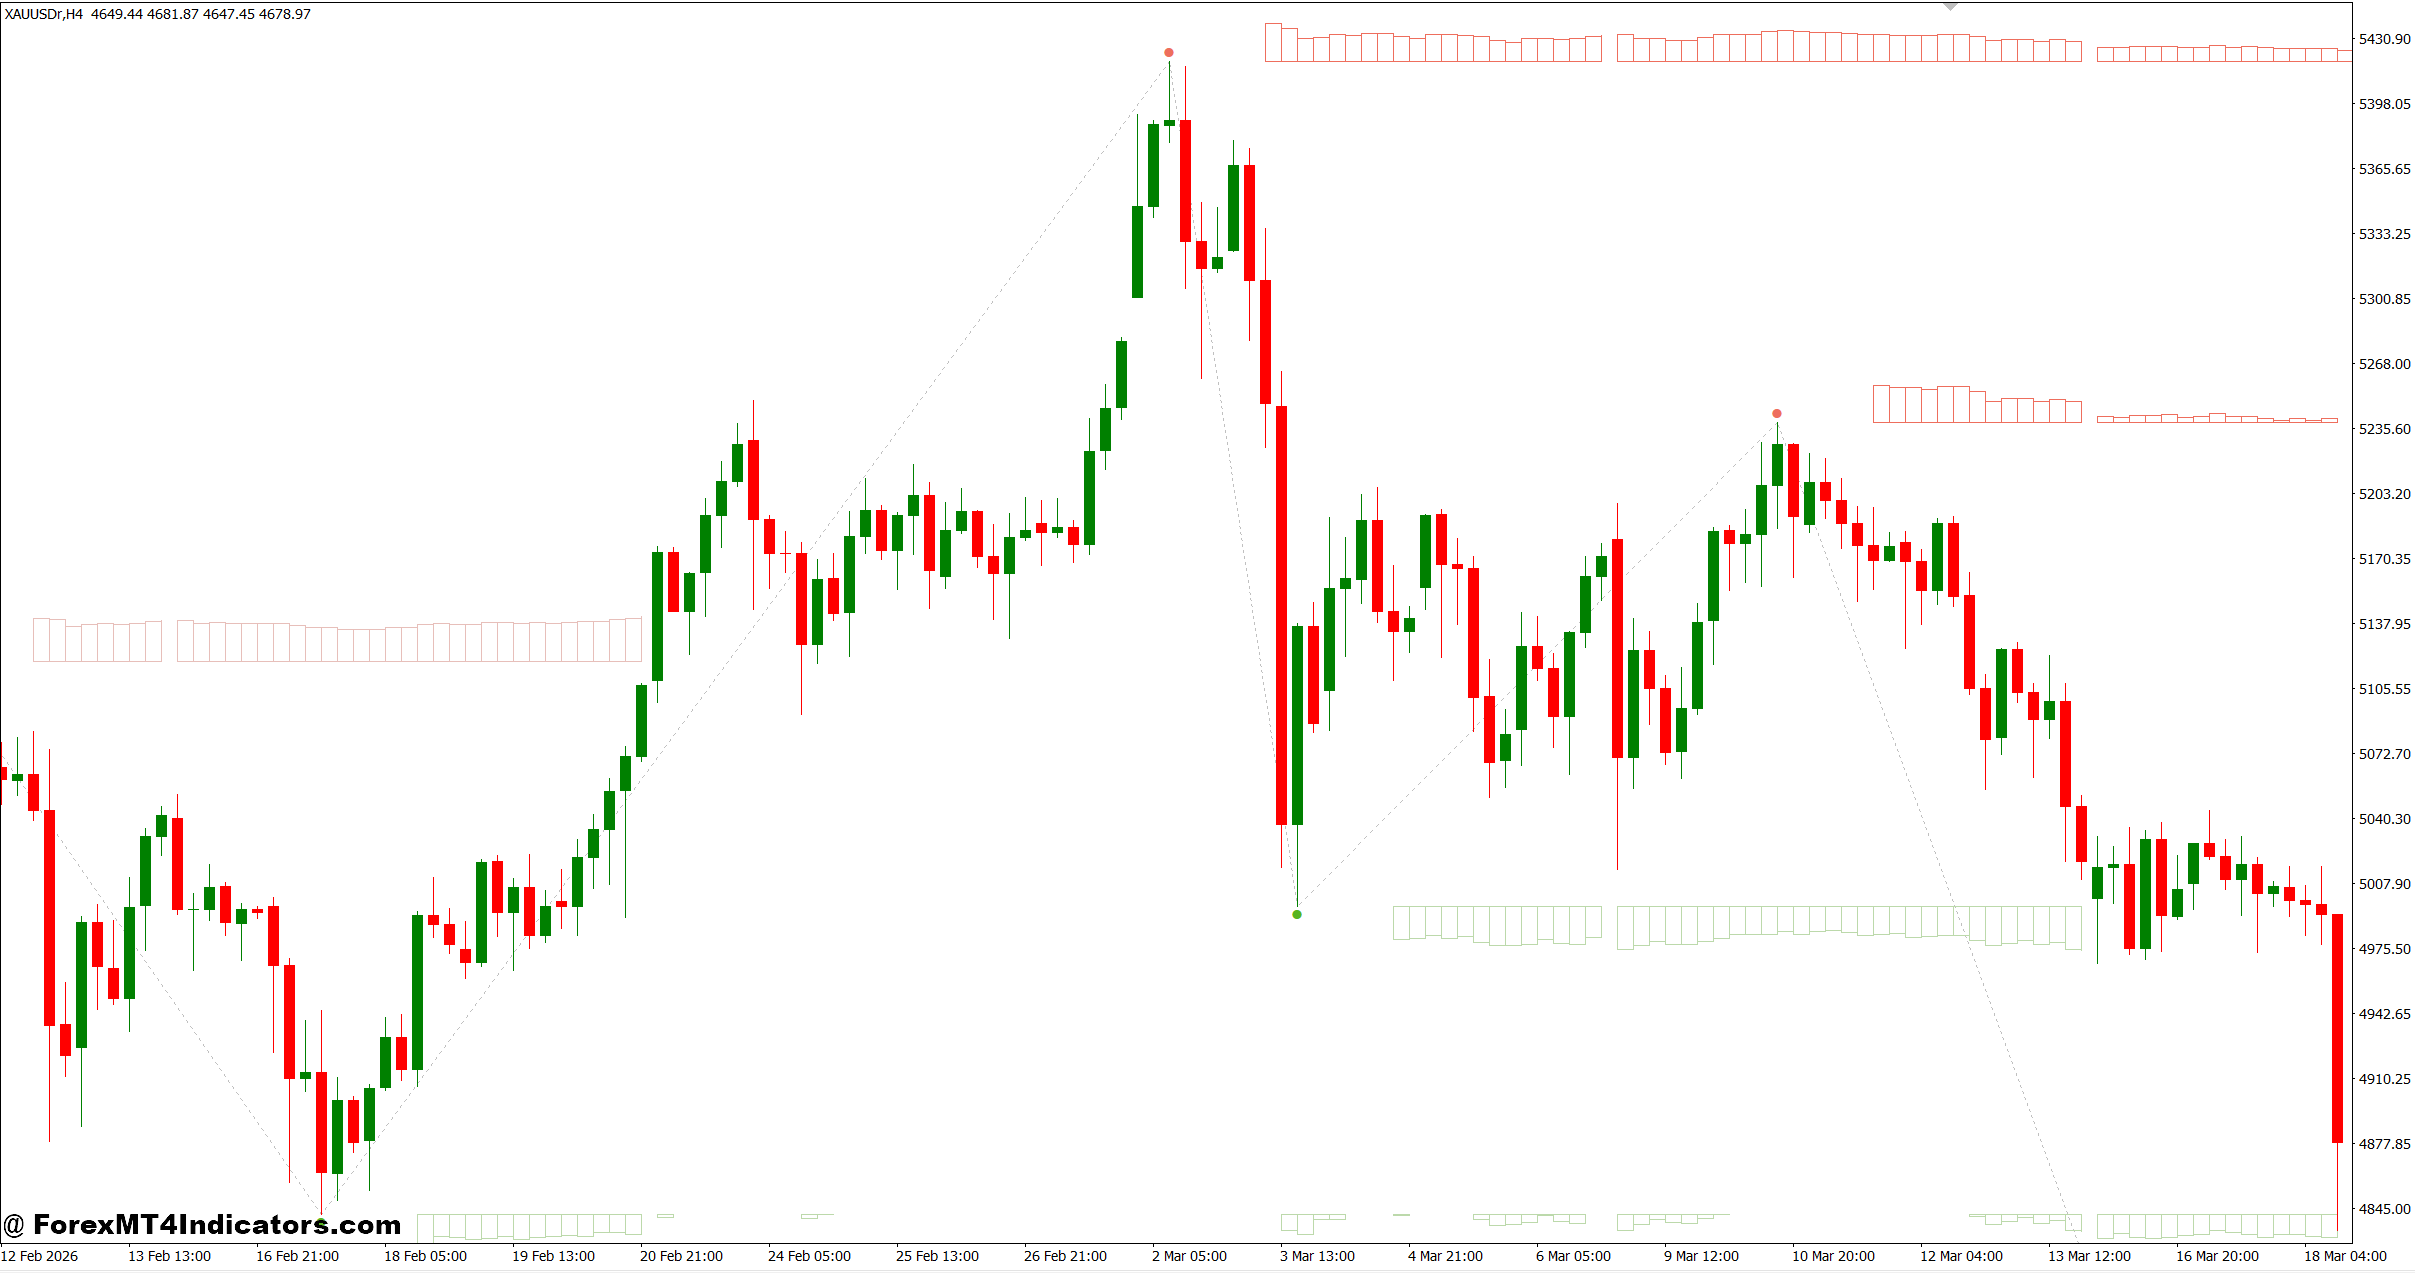
Many traders combine the indicator with price action instead of treating every zone as an automatic trading signal.
Suppose GBP/USD is trending upward on the 4-hour chart. The indicator displays a fresh H4 demand zone between 1.3420 and 1.3445. Price retraces into that area during the London session, forming a bullish pin bar on the 30-minute chart. Some traders enter above the pin bar high, place a stop-loss about 20-30 pips below the demand zone, and aim for a reward at least twice the initial risk.
The same idea works for sell setups.
Imagine USD/JPY reaches a Weekly supply zone while the 1-hour chart starts printing lower highs. If a bearish engulfing candle appears inside the zone, traders may consider selling with a stop-loss above the supply area and target the nearest support level.
Here’s the thing. Not every zone deserves attention. Fresh zones usually carry more weight than levels tested three or four times. After repeated retests, many of the original institutional orders have already been filled, making the area less reliable.
Some traders also combine the MTF Supply and Demand Indicator MT4 with moving averages or the 14-period RSI. If both the trend and momentum support the trade, confidence increases without relying on a single indicator.
Trading forex carries substantial risk. No indicator guarantees profits. Proper position sizing and disciplined risk management remain more important than any trading tool.
Best Settings and Customization
Most versions of the indicator allow traders to customize which timeframes appear on the chart. The best settings often depend on trading style rather than fixed numbers.
For scalping on M5 or M15 charts:
- Display H1 and H4 supply and demand zones.
- Filter out weaker historical zones.
- Limit the number of displayed levels to reduce chart clutter.
For intraday trading:
- Combine H4 and Daily zones.
- Keep fresh zones visible.
- Use confirmation candles before entering.
For swing trading:
- Focus on Daily and Weekly zones.
- Leave wider stop-loss distances because higher-timeframe levels often require more room.
- Avoid reacting to small intraday price fluctuations.
A trader monitoring AUD/USD on the Daily chart may ignore minor hourly zones completely and instead focus only on Weekly demand levels. That approach often reduces unnecessary trades and helps maintain patience.
Advantages, Limitations, and Comparison with Similar Indicators
One major advantage is the ability to view higher-timeframe market structure without changing charts. This saves time and helps traders avoid buying directly below major supply or selling into strong demand.
The indicator also works well with price action strategies, trend analysis, Fibonacci retracements, and market structure concepts. Many experienced traders appreciate that flexibility.
Still, there are limitations.
Different versions of the indicator may calculate zones differently. One version might mark more aggressive supply areas, while another only highlights stronger institutional moves. Market conditions also matter. During low-liquidity sessions or major news releases, price can temporarily break through a zone before reversing.
Compared with traditional support and resistance indicators, supply and demand zones usually provide wider reaction areas that better reflect real market behavior. Compared with pivot point indicators, these zones adapt to historical buying and selling pressure instead of using mathematical calculations based on previous highs and lows.
That balanced approach makes the indicator a useful decision-support tool rather than a complete trading system.
How to Trade with MTF Supply and Demand Indicator MT4
Buy Entry
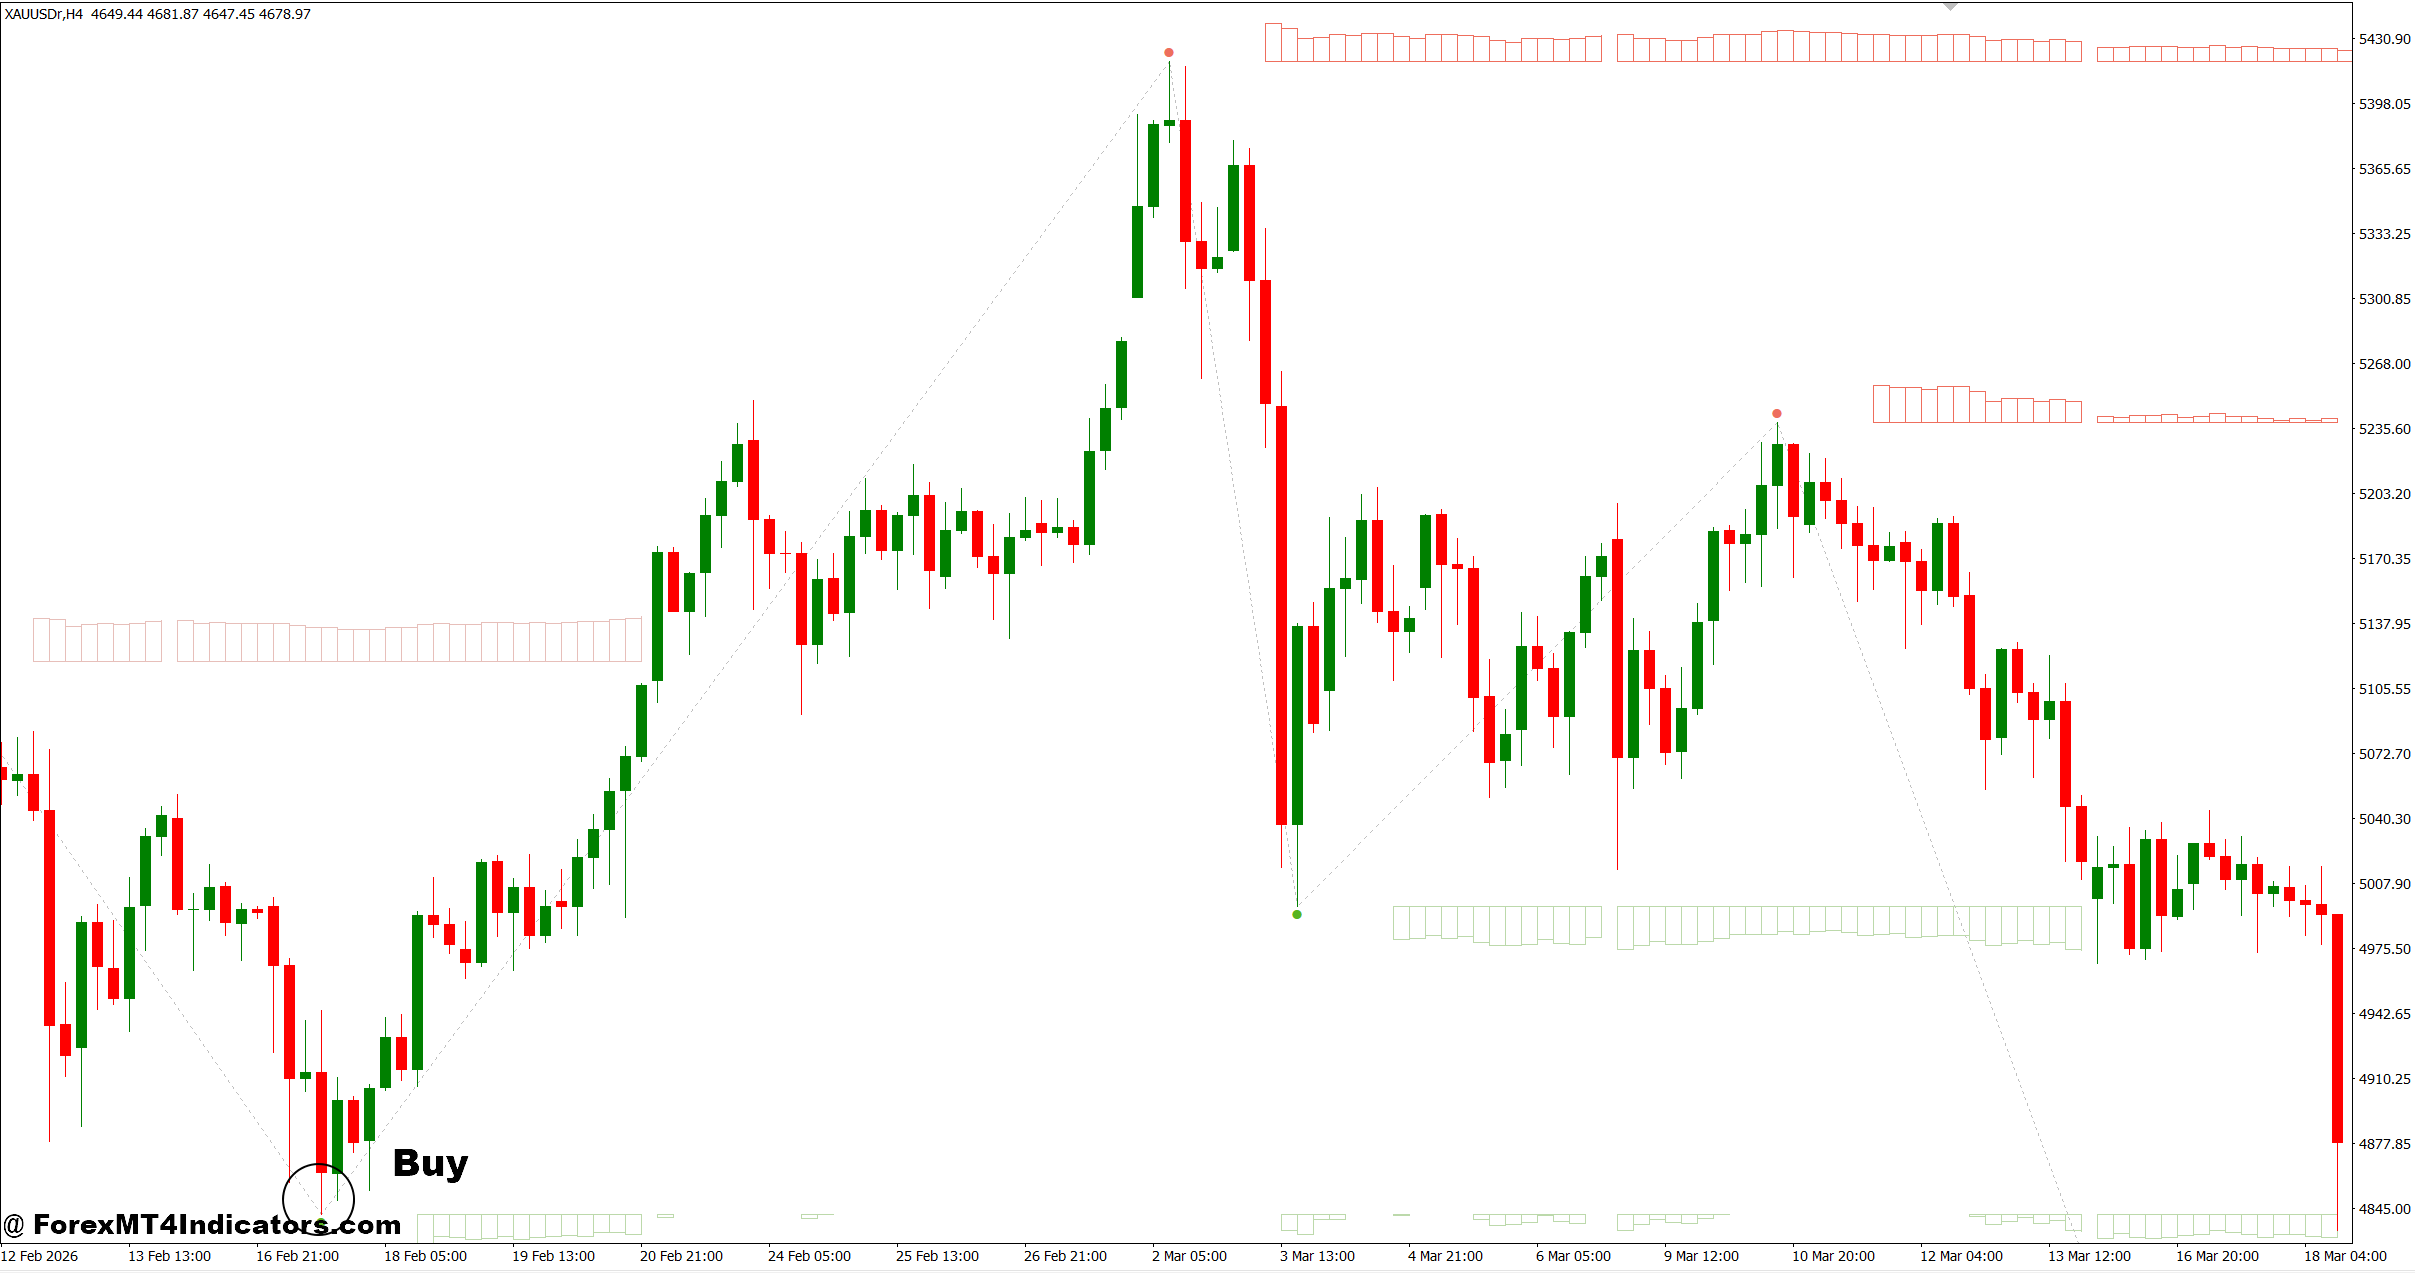
- Buy at a fresh demand zone – Enter after a bullish rejection on EUR/USD 1-hour; place a 20-30 pip stop-loss below the zone.
- Wait for bullish confirmation – Buy only after a bullish engulfing or pin bar forms inside the demand area.
- Trade with the higher trend – Take buy setups only if the 4-hour or Daily trend remains bullish.
- Target a 1:2 risk-reward ratio – Risk 25 pips to aim for at least 50 pips profit.
- Confirm with rising volume – Enter when buying pressure increases near the demand zone.
- Avoid news volatility – Skip entries 30 minutes before high-impact events like NFP or CPI.
- Use multi-timeframe alignment – Buy when the 1-hour demand zone matches the 4-hour demand area.
- Protect profits early – Move the stop-loss to breakeven after 30-40 pips in profit.
Sell Entry
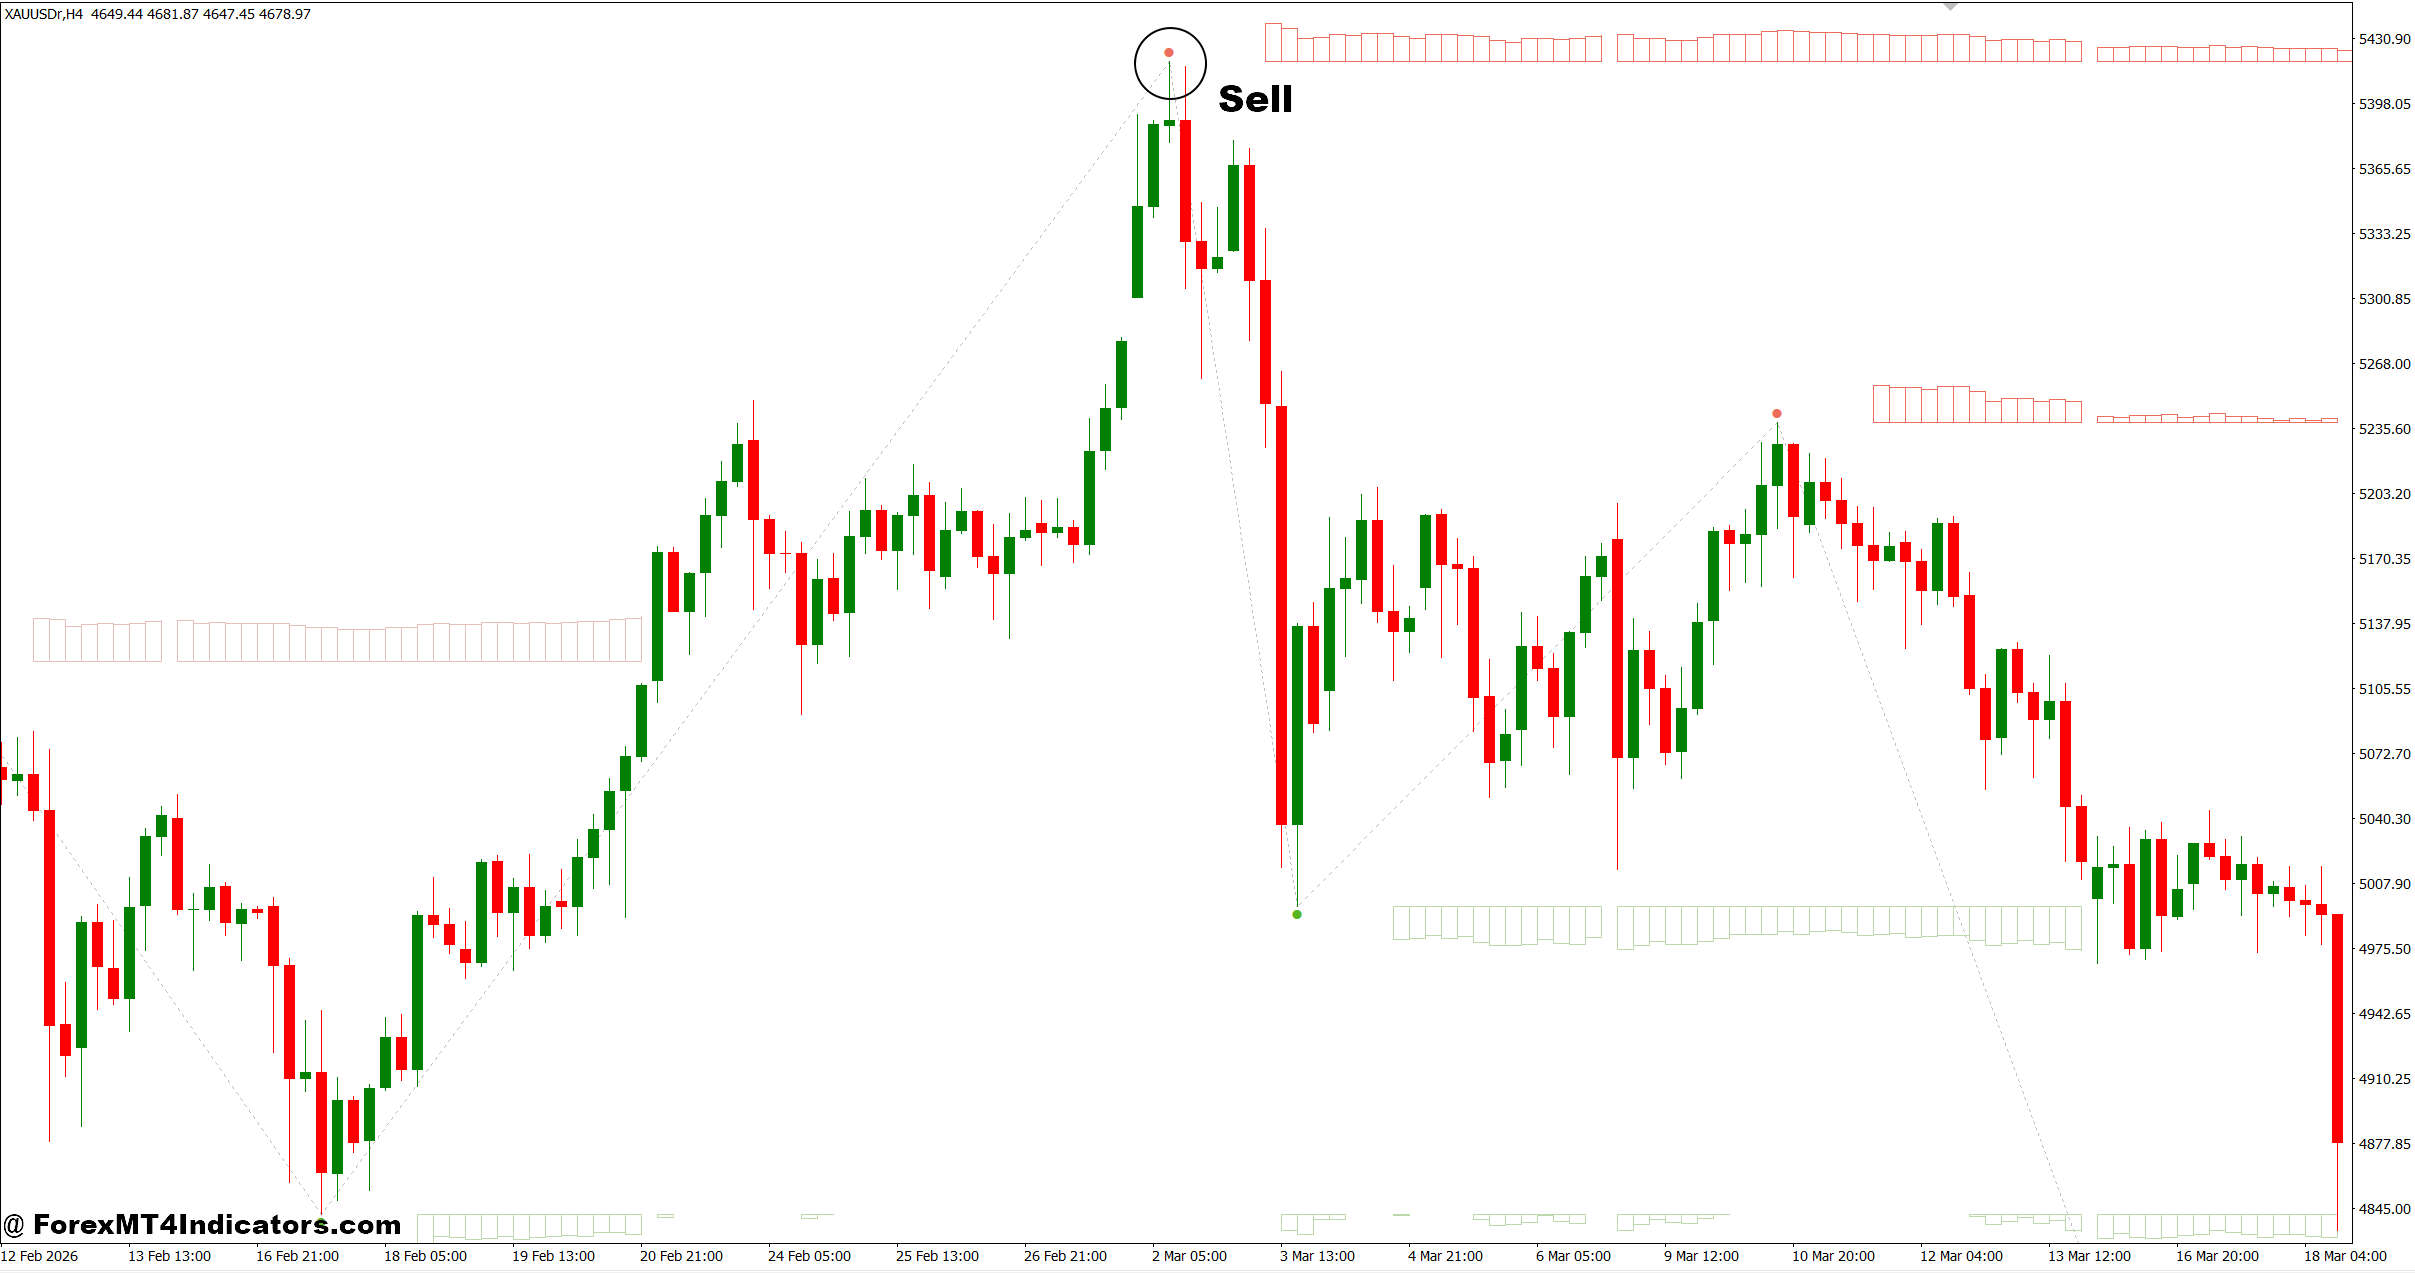
- Sell at a fresh supply zone – Enter after a bearish rejection on GBP/USD 1-hour; place a 20-30 pip stop-loss above the zone.
- Wait for bearish confirmation – Sell only after a bearish engulfing candle or strong rejection appears.
- Follow the higher trend – Look for sell trades only when the 4-hour or Daily trend is bearish.
- Aim for a 1:2 reward ratio – Risk 30 pips to target at least 60 pips.
- Confirm with momentum – Enter when bearish candles close strongly below the supply zone.
- Avoid weak supply zones – Skip levels that have already been tested 2-3 times.
- Check multi-timeframe confluence – Sell when the 1-hour supply aligns with the Daily supply zone.
- Don’t chase breakouts – Wait for a pullback into the supply zone instead of selling after a 50+ pip drop.
The MTF Supply and Demand Indicator MT4 gives traders a broader view of market structure by displaying important supply and demand zones from multiple timeframes on a single chart. It helps identify stronger reversal areas, improves trade selection through higher-timeframe confirmation, works well alongside price action and trend analysis, and reminds traders to focus on quality setups instead of frequent trades. At the same time, it isn’t perfect, and market conditions can still produce fake-outs or failed reversals. Traders who combine this indicator with sound risk management, confirmation signals, and consistent trade planning often gain more value than those who rely on zones alone. Used with patience and discipline, the MTF Supply and Demand Indicator MT4 can become a reliable part of a well-rounded trading strategy.
Level up your trading
Learn to read the chart — not just the indicator
eBook · Instant PDF
Video Course · 12 modules
Recommended MT4/MT5 Brokers
- ✓ *FREE *$50 to start (withdrawable)
- ✓ Deposit bonus up to $5,000
- ✓ Negative balance protection
Trading forex and CFDs carries a significant risk of loss and is not suitable for everyone. Broker links are affiliate links — we may earn a commission at no cost to you.
Free MT4 Indicator Download

Enter Your Email Address below, download link will be sent to you.
