

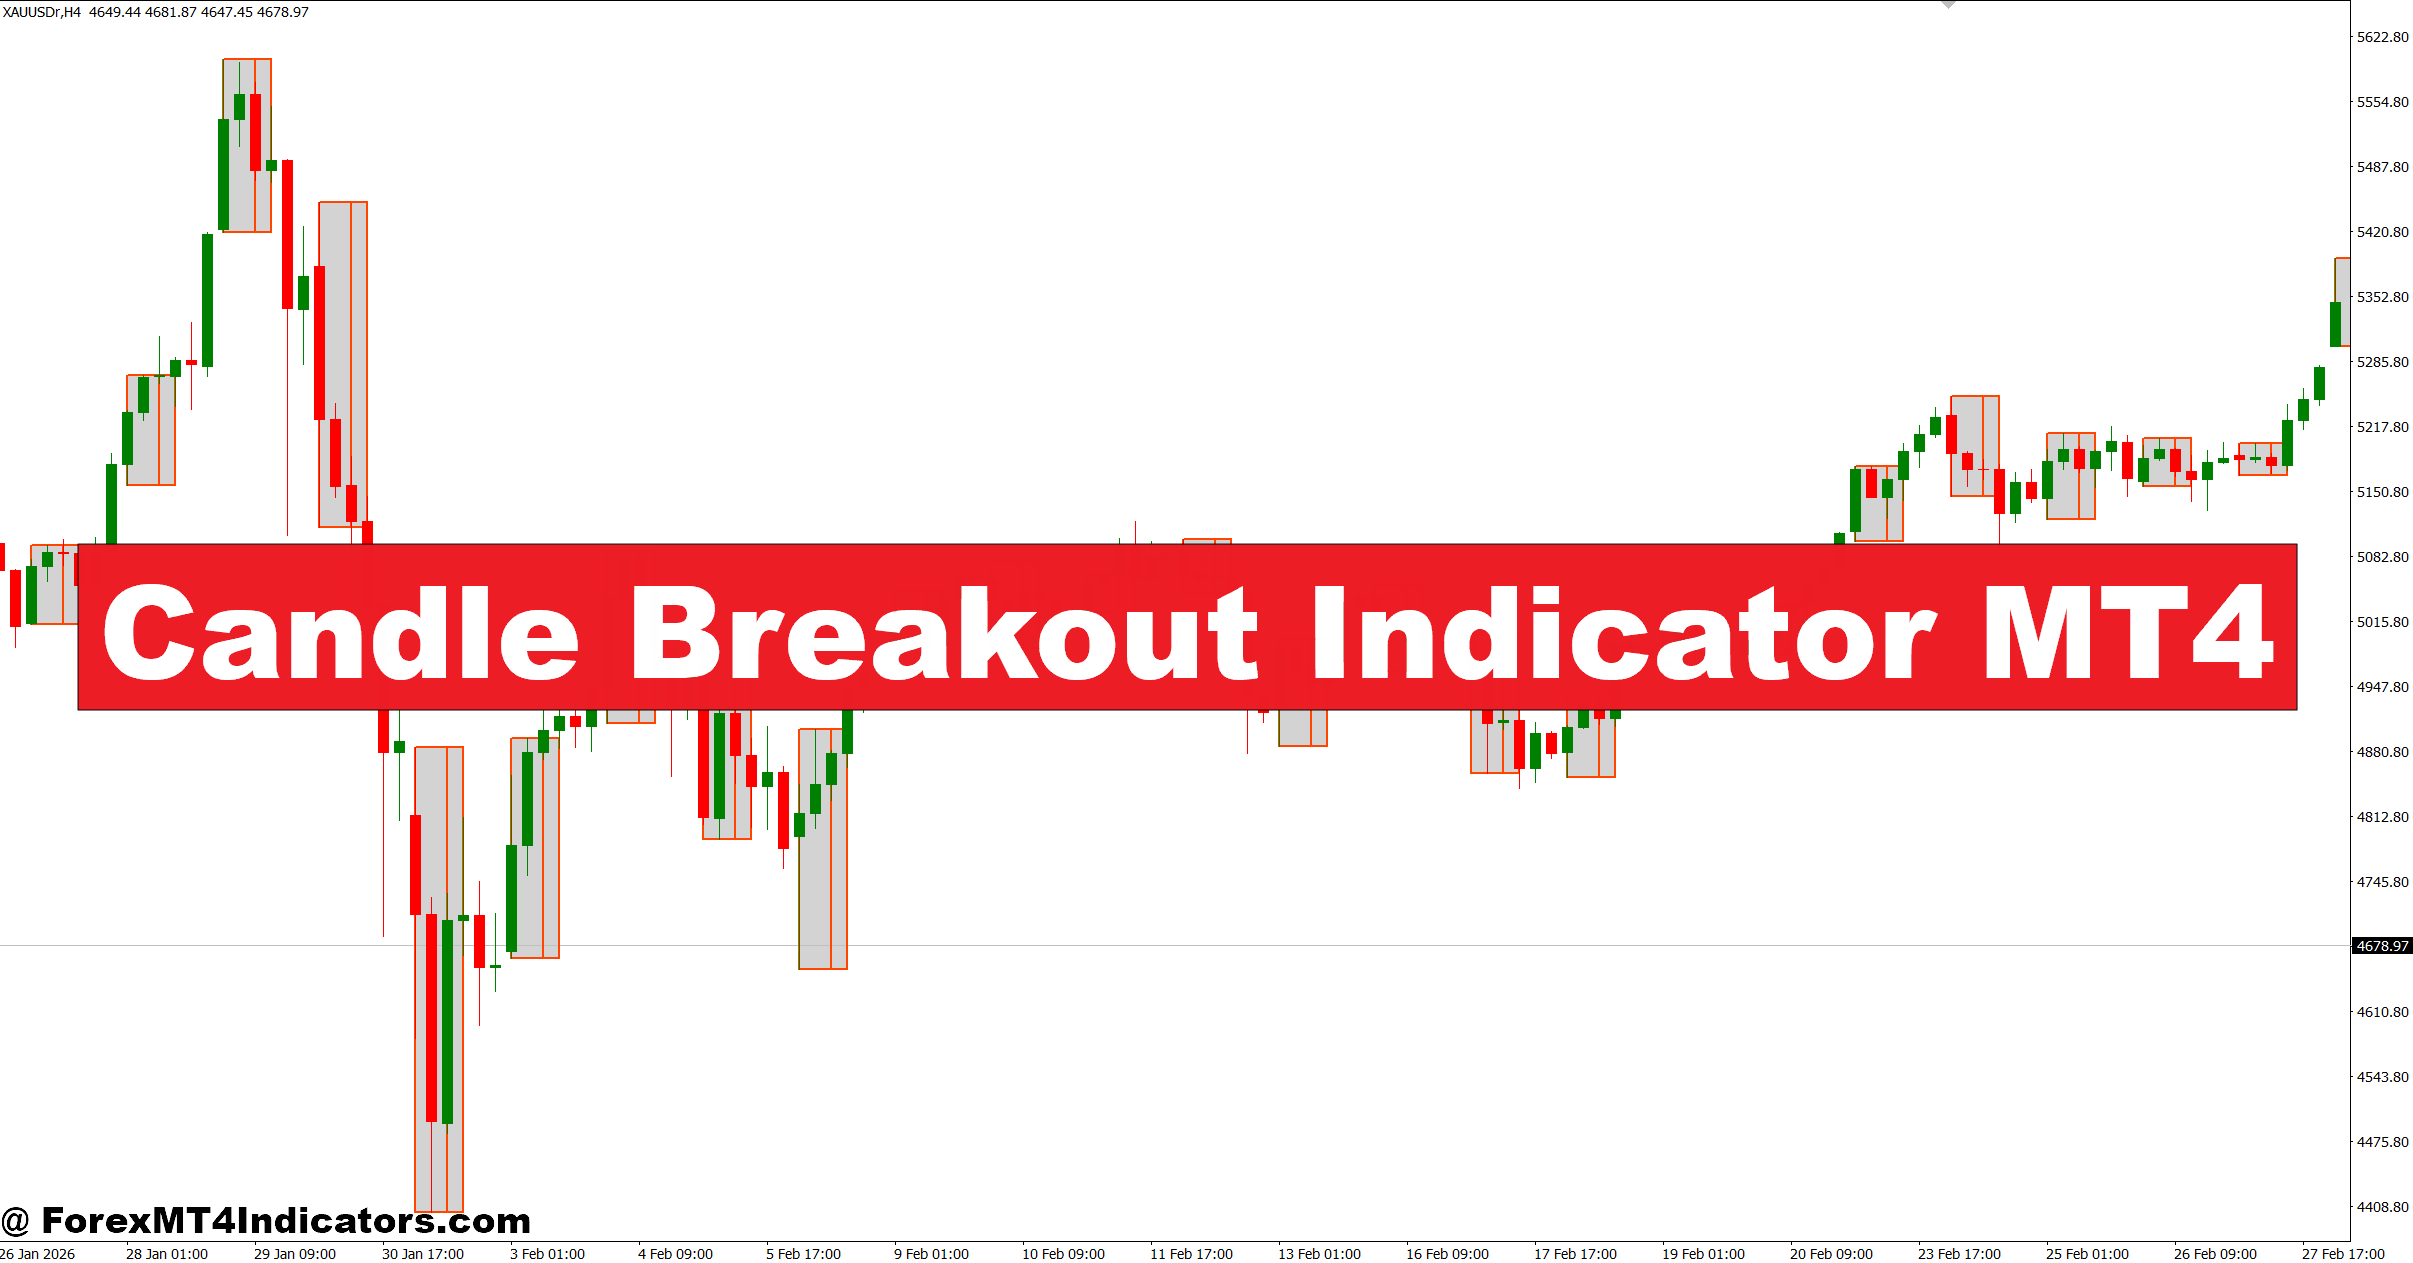
The Candle Breakout Indicator MT4 was designed to make these situations easier to read. Instead of manually checking every candle, it highlights important breakout levels and signals when price moves beyond significant highs or lows. That helps traders focus on cleaner opportunities instead of reacting to every market fluctuation.

No indicator can remove trading risk, but a breakout tool can improve decision-making when it is combined with market structure, trend analysis, and proper risk management. Understanding how this indicator works is the first step toward using it effectively.
What Is the Candle Breakout Indicator MT4?
The Candle Breakout Indicator MT4 is a technical analysis tool that identifies when price breaks above the high or below the low of selected candles. The indicator automatically marks breakout levels and can generate visual arrows, alerts, or horizontal lines depending on its settings.
Its main goal is to help traders recognize momentum as it begins instead of entering after a large move has already happened.
Most versions allow traders to monitor breakouts based on:
- Previous candle highs and lows
- Daily or weekly candle ranges
- Custom lookback periods
- Session highs and lows
This makes the indicator useful for both intraday traders and swing traders. A trader watching EUR/USD on the 1-hour chart may only need the previous candle’s range, while someone trading GBP/JPY on the 4-hour chart may prefer a larger breakout period to reduce market noise.
The indicator doesn’t predict direction. It simply shows where price is attempting to leave an established range.
How the Indicator Detects Breakouts
The calculation behind the Candle Breakout Indicator MT4 is fairly straightforward. It compares the current market price with the highest high and lowest low over a selected number of candles.
If price closes above the chosen resistance level, the indicator marks a bullish breakout. If price closes below support, it signals a bearish breakout.
Many advanced versions include extra filters such as:
Confirmation Candle
Instead of signaling immediately after price touches a level, the indicator waits for the candle to close outside the breakout range. This reduces many false signals caused by temporary price spikes.
Volatility Filter
Some versions measure Average True Range (ATR) before generating a signal. During very quiet sessions, small movements are ignored because they often fail to develop into real trends.
Alert System
Email, push notifications, or sound alerts notify traders when a breakout occurs. This feature is especially useful for traders following several currency pairs at the same time.
During testing on EUR/USD after a Non-Farm Payroll release, waiting for the breakout candle to close produced fewer losing trades than entering immediately after price touched resistance. The delay sometimes costs a few pips, but it often filters out sudden reversals.
Using the Candle Breakout Indicator in Real Trading
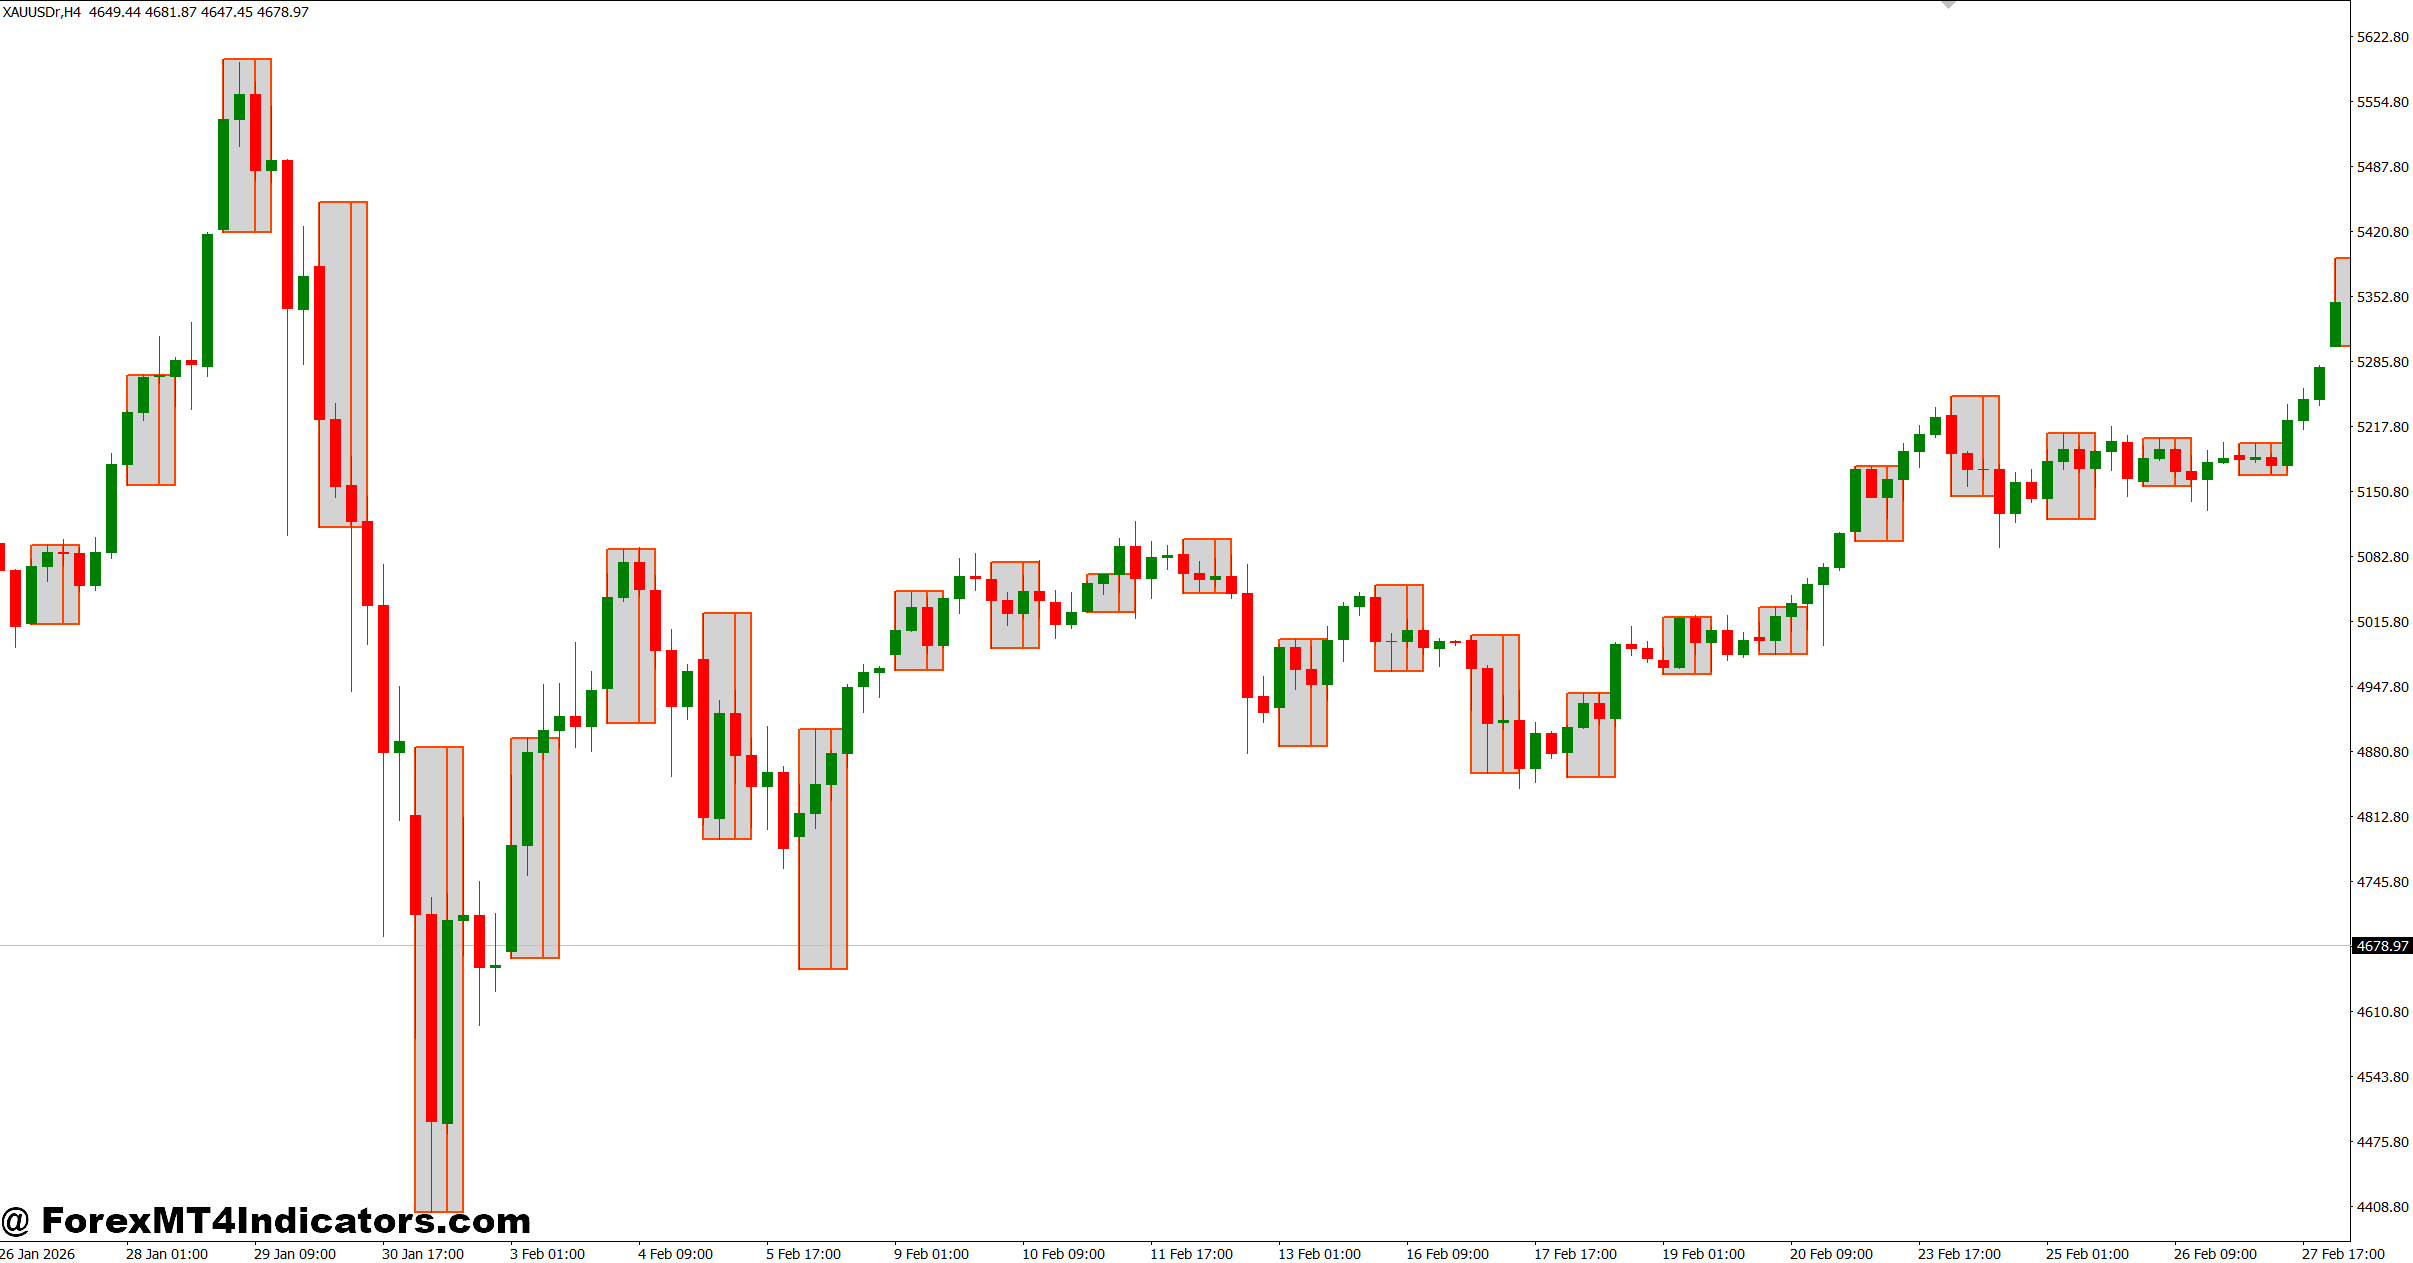
The strongest breakout signals usually appear when price has been consolidating for several candles before expanding with increased momentum.
For example, EUR/USD traded inside a 35-pip range on the 1-hour chart during the London morning session. Once price closed 12 pips above the range high, the Candle Breakout Indicator MT4 generated a buy signal. A stop-loss below the consolidation area measured roughly 22 pips, while the move eventually extended nearly 70 pips before slowing near resistance.
A bearish example appeared on USD/CAD during the 4-hour timeframe. Price repeatedly tested support before finally closing below it. The breakout indicator confirmed the move, and traders who waited for the candle close avoided an earlier fake break that happened several hours before.
Here’s the thing. Breakouts work best when they align with the larger market trend.
If the daily chart remains strongly bullish, upside breakouts generally have a better chance of continuing than bearish ones. Combining the indicator with a 50-period or 200-period Exponential Moving Average can help traders avoid trading against the dominant trend.
Trading forex carries substantial risk. No indicator guarantees profits. Every breakout should include a predefined stop-loss and realistic profit target before entering the trade.
Best Settings and Practical Tips
The ideal settings depend on trading style rather than a single universal number.
Scalpers often monitor the 5-minute or 15-minute charts with shorter breakout periods between 5 and 10 candles. This creates more signals but also increases exposure to market noise.
Day traders usually find better consistency on the 1-hour chart using lookback periods around 15 to 20 candles.
Swing traders often prefer the 4-hour or daily chart with settings between 20 and 50 candles. These signals appear less frequently but usually represent stronger market moves.
One practical tip comes from observing London session breakouts. When price breaks the Asian session range during the first two hours of London trading, momentum often improves. But if the breakout happens late in the New York session, follow-through may be limited because market participation starts to decline.
News events deserve extra attention. During high-impact announcements, spreads can widen quickly and create misleading breakout signals. Waiting for the first candle after the news to close often provides a more reliable entry than reacting immediately.
Advantages, Limitations, and Comparison with Similar Indicators
The biggest advantage of the Candle Breakout Indicator MT4 is its simplicity. Traders spend less time drawing breakout levels manually, making chart analysis faster and more consistent.
Another benefit is its flexibility. It works across major currency pairs, commodities, and indices while adapting to different trading styles.
Still, it has weaknesses.
Sideways markets can generate repeated fake breakouts, creating several small losses before a real trend develops. The indicator also performs poorly when traders ignore overall market structure and rely only on the signal itself.
Compared with Donchian Channels, the Candle Breakout Indicator focuses more on individual candle breaks instead of broader channel extremes. Compared with Bollinger Bands, it reacts directly to price levels rather than volatility expansion. Traders who combine breakout signals with support and resistance analysis often gain better trade quality than those depending on a single indicator.
Many experienced traders also pair it with RSI or MACD confirmation to avoid buying after an already overextended move. That extra confirmation won’t remove losing trades, but it can reduce entries during weak momentum.
How to Trade with Candle Breakout Indicator MT4
Buy Entry
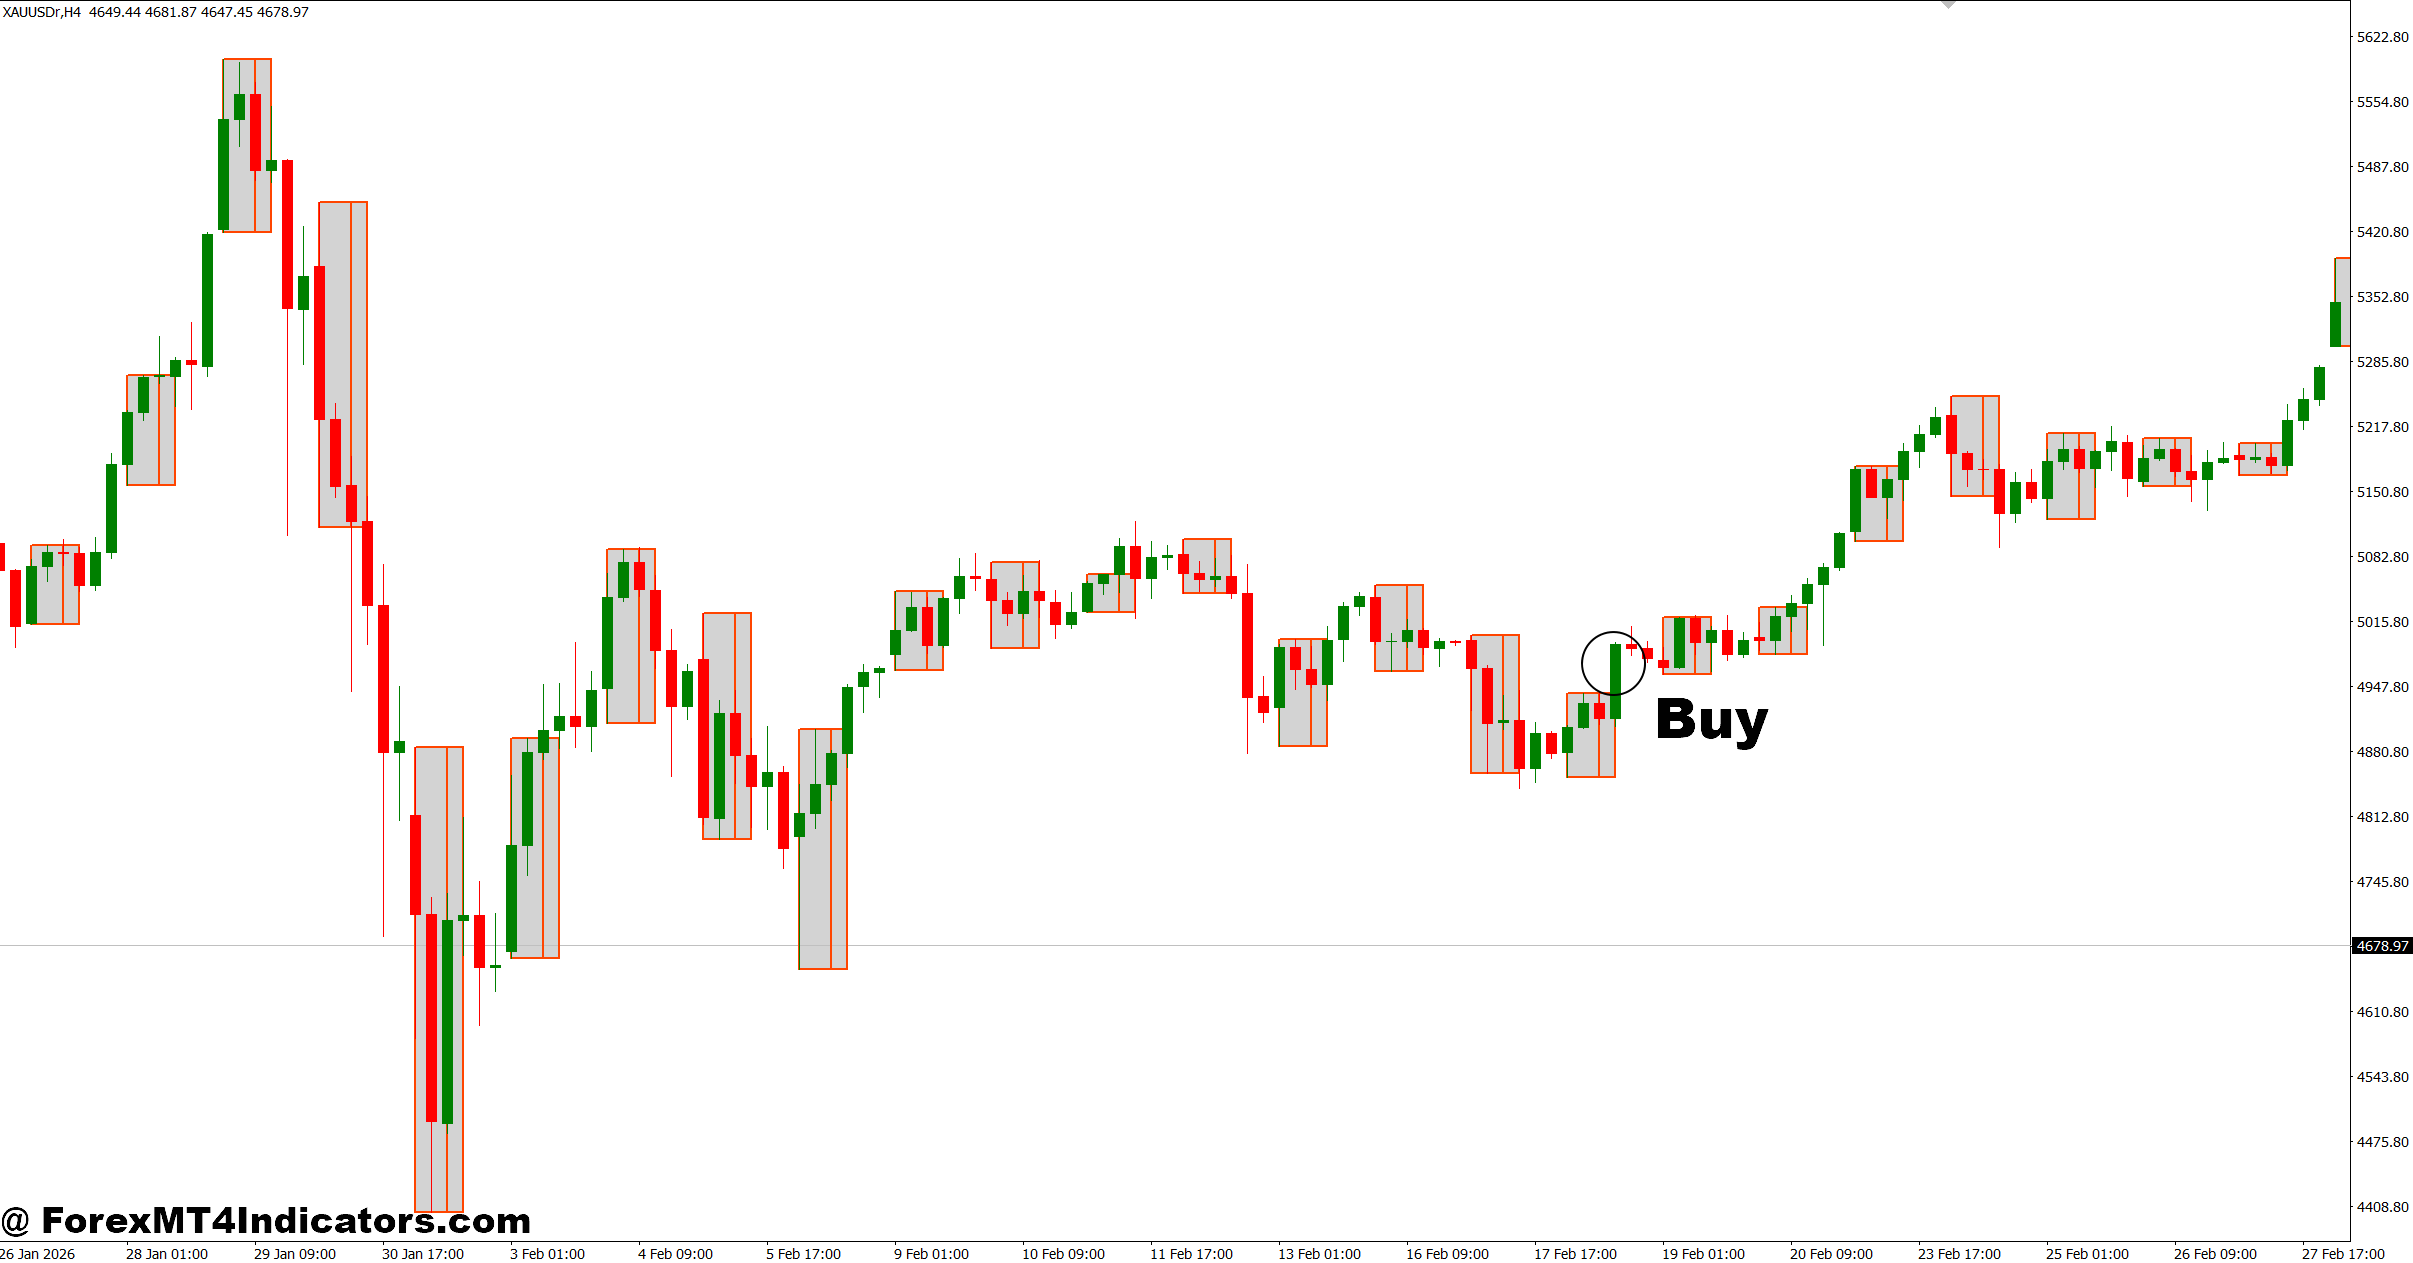
- Buy after candle close above resistance – Enter when a 1-hour candle closes 10-15 pips above resistance on EUR/USD.
- Confirm with rising volume – Take the trade only if breakout momentum is stronger than the previous candle.
- Place stop-loss below breakout candle – Keep a 20-30 pip stop-loss below the breakout low.
- Target at least 1:2 risk-reward – Risk 25 pips to aim for a 50-pip profit target.
- Trade with the higher trend – Buy on the 4-hour chart only when price stays above the 200 EMA.
- Wait for a retest – Enter after price retests the breakout level and holds as support.
- Avoid low-volatility sessions – Skip signals during the late New York session or before major news releases.
- Risk only 1-2% per trade – Protect trading capital even when the setup looks strong.
Sell Entry
- Sell after candle closes below support – Enter when GBP/USD closes 10-15 pips below support on the 1-hour chart.
- Confirm bearish momentum – Take the trade only if the breakout candle is larger than recent candles.
- Place stop-loss above breakout candle – Keep a 20-30 pip stop-loss above the breakout high.
- Aim for a 1:2 risk-reward ratio – Risk 30 pips to target at least 60 pips.
- Trade with the downtrend – Sell on the daily or 4-hour chart when price remains below the 200 EMA.
- Wait for resistance retest – Enter after the broken support turns into resistance.
- Avoid fake breakouts – Don’t sell if the candle closes back inside the previous range.
- Limit risk to 1-2% – Keep position size small to manage losing streaks.
The Candle Breakout Indicator MT4 offers a practical way to spot price moves as they begin instead of chasing trades after momentum has already developed. Traders gain the most value when they combine breakout signals with trend direction, support and resistance, and disciplined risk management. Strong setups often appear after periods of consolidation, while choppy markets require extra patience. Trading forex carries substantial risk, and no technical tool can guarantee successful results. Used with realistic expectations and consistent trade management, the Candle Breakout Indicator MT4 can become a reliable part of a structured trading plan rather than a standalone decision-maker.
Level up your trading
Learn to read the chart — not just the indicator
eBook · Instant PDF
Video Course · 12 modules
Recommended MT4/MT5 Brokers
- ✓ *FREE *$50 to start (withdrawable)
- ✓ Deposit bonus up to $5,000
- ✓ Negative balance protection
Trading forex and CFDs carries a significant risk of loss and is not suitable for everyone. Broker links are affiliate links — we may earn a commission at no cost to you.
Free MT4 Indicator Download

Enter Your Email Address below, download link will be sent to you.
