

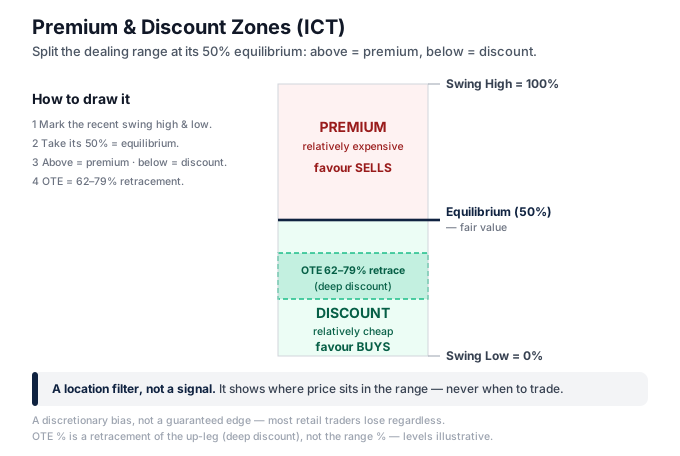
Premium and discount are the two halves of a price range. Mark a swing low to a swing high, take the 50% midpoint — equilibrium — and everything above it is premium (relatively expensive, so you favour selling), everything below is discount (relatively cheap, so you favour buying). It is a location filter, not a signal.
Last updated: August 2, 2026 · By: Tim Morris
What premium and discount zones actually are
Premium and discount are a way of asking one simple question about any move on your chart: within this particular leg, is price relatively expensive or relatively cheap right now?
To answer it you first need a defined range. Take one clear price leg — a swing low and a swing high — and treat that as your “dealing range”. Find its exact 50% midpoint. In ICT language that midpoint is called equilibrium (EQ): the fair-value line that splits the range in half. Everything above equilibrium is the premium zone; everything below it is the discount zone.
The logic is the same one you already use when you shop. If a market has travelled from 1.0800 up to 1.1000, then 1.0900 is the halfway mark. A pullback that only reaches 1.0980 has barely come off the highs — that is expensive, premium. A pullback that drops to 1.0820 is close to where the whole move began — that is cheap, discount. Nothing more mystical than that is happening.
The premium zone is always the upper half of the range (above 50%) and the discount zone is always the lower half (below 50%). That labelling is fixed. It does not flip depending on which direction you dragged your drawing tool: premium is the top, discount is the bottom, full stop.
Two more things follow from this. First, equilibrium itself is a real, objective number — 50% of a range is 50% of a range, and two traders who agree on the same swing high and swing low will get the same EQ line. Second, and this is where honesty matters, the interpretation stacked on top of that geometry is not objective. The idea that “institutions buy in discount and sell in premium” is an assumption about order flow you cannot see. It is a model, not a proven fact. Keep those two things separate in your head and you will already be ahead of most people using this concept.
Premium and discount, equilibrium, the Optimal Trade Entry band and killzones all come from the ICT (Inner Circle Trader) framework popularised by Michael J. Huddleston. “Smart Money Concepts” (SMC) is the broader label the same ideas usually travel under. Whatever you call it, this is a discretionary framework, not a mechanical system, and no part of it removes the fact that most retail traders lose money.
How to spot the zones on a chart
There is a short, repeatable routine. Follow it in order and you will draw the same zones consistently instead of eyeballing them differently each time.
1. Pick one clear impulse leg. Choose an obvious, impulsive move from a swing low to a swing high (or from a high to a low). This is your dealing range. Do not grab a random pair of candles — anchor to structure you would point at without hesitation. Choosing an arbitrary swing is the single biggest error people make here, because everything downstream depends on it.
2. Attach a Fibonacci or range tool. Anchor the 0% and 100% handles on the two swing extremes so the tool spans the whole leg. A plain rectangle works just as well; you only need the 50% line. If you would rather learn the levels by hand before automating anything, a Fibonacci retracement indicator for MT5 will plot equilibrium and the deeper retracement bands for you.
3. Read the 50% level. That is equilibrium. Above it is premium, below it is discount.
4. Label the halves. Upper half = premium (expensive). Lower half = discount (cheap). Do this even when it feels obvious — writing it on the chart stops you talking yourself into a bad-side entry later.
5. See where price is now. Above EQ, price is in premium. Below EQ, it is in discount. Sitting right on EQ, it is neither — a low-conviction spot most traders simply skip.
6. Optionally, mark the OTE band. For a tighter entry, highlight the Optimal Trade Entry: the 61.8% to 79% retracement of the leg, with roughly 70.5% commonly cited as the “sweet spot”. For a long, that band sits deep inside discount, near where the leg began. For a short, it sits deep inside premium. This is where a tighter stop lives, because you are entering close to the swing that would invalidate the idea.
7. Look for confluence before you act. Is there an order block, a fair value gap, or a pool of resting liquidity sitting inside that premium or discount zone? The zone tells you where to be interested. Structure and liquidity tell you whether to act. If you have never mapped resting orders, start with what a liquidity sweep is and how equal highs and equal lows form the pools price tends to run.
A word on tooling. Plenty of indicators will auto-draw premium and discount for you, and an SMC indicator for MT5 can save you the manual step. But be clear about what it is doing: it picks recent swings mechanically. It does not know which leg is structurally relevant to your idea. Treat the auto-drawn box as a suggestion to sanity-check, not a decision.
How to trade the zones
The core rule is short: use premium and discount as a directional filter, not a trigger.
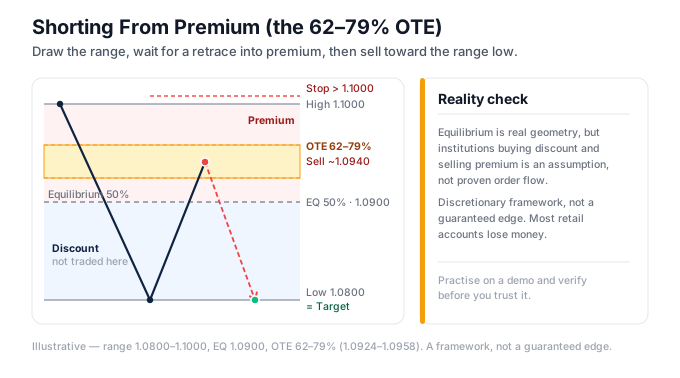
In an established uptrend, only look to buy when price pulls back into discount (below EQ). In a downtrend, only look to sell when price rallies into premium (above EQ). Trading against the zone — buying premium, selling discount — is precisely the mistake the concept exists to stop you making. If you are not sure which way the trend actually points, settle that first; our guide to break of structure versus change of character is the cleanest way to read it.
From there, the workflow is:
- Wait for price to reach the zone and interact with a real level inside it — an order block, a fair value gap, or swept liquidity. The zone on its own is never the entry.
- Drop a timeframe for confirmation. A market-structure shift on a lower timeframe, right at your level, is the usual green light. Without it you are guessing.
- Refine with OTE when you want defined risk. Entering in the 61.8%–79% band puts your stop just beyond the swing that made the range, which is a small stop, while your target sits at the opposite extreme, which is a large reward. That asymmetry is the entire point of using OTE rather than entering at EQ.
- Place the stop beyond the structure, not at a fixed pip distance. Below the swing low for a long; above the swing high for a short. Then size the position from that stop distance — never from a fixed lot. If stops and order placement are still fuzzy, review forex order types before you risk money.
A concrete long example
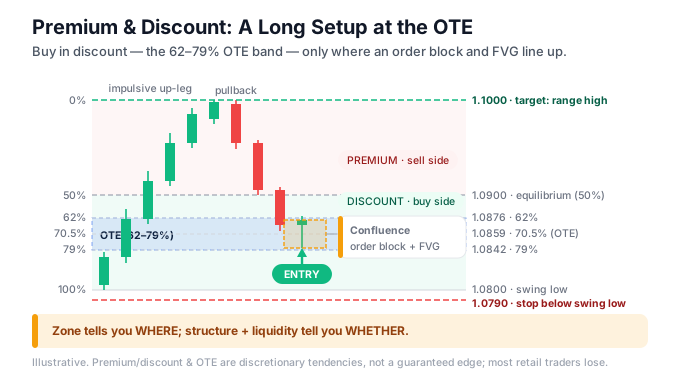
Say GBP/USD rallies impulsively from 1.2500 (swing low) to 1.2700 (swing high). Anchor the tool 0% at 1.2500, 100% at 1.2700. Equilibrium sits at 1.2600. Price then pulls back. You are only interested in buying, and only in discount, so anything above 1.2600 is ignored.
The pullback slides into the OTE band — roughly 1.2542 (79%) to 1.2576 (62%), with the 70.5% “sweet spot” near 1.2559. Inside that band you spot a bullish order block that lines up with an unfilled fair value gap. That is your confluence. You wait for a small lower-timeframe structure shift off the level, enter around 1.2560, put the stop just below the 1.2500 swing low, and target the 1.2700 range high (or bank part at equilibrium). The stop is about 60 pips; the target is about 140. Whether the trade wins is never guaranteed — but the structure of the bet is sound, because you bought cheap in a rising market with a defined invalidation. (If long versus short is still new to you, see going long versus short in forex; for what a pip is worth, what is a pip.)
Be honest about the edge
Equilibrium is real geometry. The claim built on top of it is not verified. “Institutions accumulate in discount and distribute in premium” is a plausible story about order flow nobody outside those desks can actually see. There is no independent, peer-reviewed evidence that trading premium and discount zones beats random entry; the material promoting it comes almost entirely from educators who sell the method. Regulatory disclosures from brokers routinely put the share of losing retail accounts somewhere in the region of 70–85% — the exact figure is broker-specific and legally disclosed — which is the plain reminder that no drawing tool guarantees a profit.
Killzone timing is optional context, not a requirement. Concentrating your trading into liquid hours (see forex sessions explained) can tidy up execution, but a time window does not make a premium or discount entry “work” by itself. Do not treat the clock as magic.
Common mistakes
- Anchoring to the wrong swing. The whole picture moves with your chosen high and low, so a poorly picked leg gives you a meaningless equilibrium. There is genuine subjectivity here; two competent traders will often draw different ranges on the same chart. Accept that and anchor to the most obvious structure you can find.
- Treating the zone as a standalone buy or sell signal. It only says price is relatively cheap or expensive within one leg. On its own it produces plenty of losing trades. It is a filter, always paired with a reason.
- Buying in premium or selling in discount, then calling it “anticipation”. If you are trading against the zone you have thrown away its only benefit. Anticipation is just a nicer word for ignoring your own filter.
- Believing the “banks are hunting your stop” story. Stop runs above old highs and below old lows happen because that is where resting orders cluster — a statistical tendency, not a conspiracy aimed at you personally. That framing is marketing, and it will cost you money if you trade angry.
- Confusing equilibrium with OTE. Equilibrium is always the 50% of the range you drew. OTE is the 62%–79% retracement of the impulse leg. They are related but they are not the same number, and mixing them up misplaces both entries and stops.
- Assuming higher and lower timeframes always agree. Price can sit in discount on the daily range while sitting in premium on a 15-minute range. Both are true at once. Always state which range you mean.
- Over-trusting an auto-drawing indicator. It picks recent swings mechanically; it has no idea which leg is structurally relevant to your idea. Use it as a second opinion, not the decision.
How premium and discount fit the wider SMC framework
Premium and discount is one building block among several, and it is deliberately the first filter, not the entry. In a full Smart Money Concepts read, the sequence usually runs like this: read market structure to get direction, wait for liquidity to be taken, then look for an entry level — and premium/discount is the lens that tells you whether that level is on the right side of the range to bother with.
It leans on the other concepts rather than replacing them. Equilibrium tells you the side; a fair value gap or an order block gives you the actual level to trade inside that side; a liquidity sweep or a piece of inducement tells you the move to fade or follow. The zone without a level is a bias with nowhere to act; a level without the zone is an entry with no directional discipline. You want both.
It also connects to the older, plainer ideas you may already know. A discount zone that lines up with genuine support and resistance is a stronger place to be interested than one floating in open space. And the deeper you go into ICT, the more the concepts interlock: OTE is really just the premium/discount idea sharpened into a tighter band, and ICT killzones are the timing layer wrapped around all of it. If you are still deciding whether this framework belongs in your process at all, weigh it against the basics in fundamental versus technical analysis, and write the rules down properly using our guide to building a trading plan.
The honest summary: premium and discount is a genuinely useful piece of discipline that stops you buying tops and selling bottoms within a leg. It is not an edge on its own, it does not reveal what institutions are doing, and it will not save a plan that has no risk management. Used as a filter, layered with structure and liquidity, and traded with a stop you sized properly, it earns its place. Sold as a secret, it does not.
Frequently asked questions
What are premium and discount zones in SMC/ICT trading?
They are the two halves of a defined price range. Mark a swing low to a swing high, find the 50% midpoint (equilibrium), and price above it is the premium zone (relatively expensive), while price below is the discount zone (relatively cheap). Traders favour selling premium and buying discount.
What is equilibrium in ICT?
Equilibrium is the 50% midpoint of the range you have marked, from swing low to swing high. It is the fair-value line that separates premium (above) from discount (below). Price sitting on equilibrium is considered neither cheap nor expensive, which many traders treat as a low-conviction area to avoid.
How do you draw premium and discount zones?
Attach a Fibonacci retracement or range tool to one clear impulse leg, anchoring 0% and 100% on the swing low and swing high. The 50% line is equilibrium. The upper half is premium, the lower half is discount. The labelling stays the same regardless of which direction you drew the tool.
What is the difference between equilibrium and Optimal Trade Entry (OTE)?
Equilibrium is the single 50% midpoint of the range. OTE is a deeper zone, the 61.8% to 79% retracement of the impulse leg (around 70.5% is the cited sweet spot). Equilibrium filters direction; OTE refines a tighter, defined-risk entry inside discount (for buys) or premium (for sells).
Do premium and discount zones actually work?
The geometry is objective, but the edge is not guaranteed. “Institutions buy discount and sell premium” is an assumption about unseen order flow, not proven fact. There is no independent evidence it beats random entry. It is a discretionary filter, best combined with structure and liquidity, and most retail traders still lose money.
Should you buy in the discount zone or the premium zone?
In an uptrend, look to buy in the discount zone (below equilibrium) where price is relatively cheap. In a downtrend, look to sell in the premium zone (above equilibrium) where price is relatively expensive. Buying premium or selling discount removes the concept’s only benefit and is the main mistake to avoid.
Ready to put this into practice?
Open an account with a regulated broker and apply what you have learned. These are the three brokers we recommend:
Trading forex and CFDs carries a significant risk of loss and is not suitable for everyone. Broker links are affiliate links — we may earn a commission at no cost to you.