

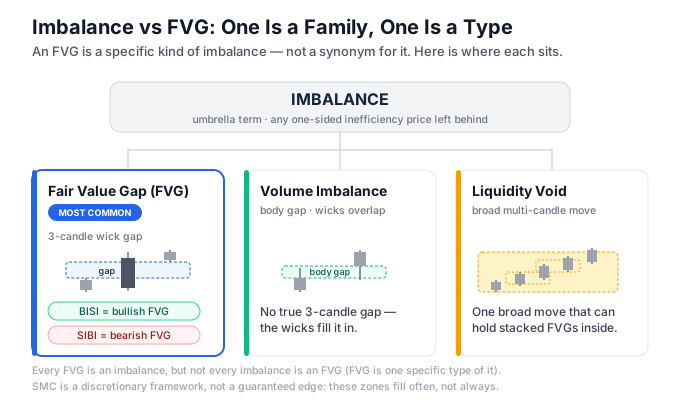
An imbalance is any price zone left inefficient by one-sided movement, where buying and selling were not evenly matched. A fair value gap (FVG) is the most common, precisely defined type: a three-candle pattern whose outer wicks do not overlap. Every FVG is an imbalance; imbalance is the wider category.
The two words get used interchangeably across most retail Smart Money Concepts (SMC) content, and that sloppiness causes real chart-reading errors. This guide fixes the distinction, shows you how to spot each type, and stays honest about what these zones can and cannot do for your trading.
What an imbalance is, and where the FVG sits inside it
In the Inner Circle Trader (ICT) school of Smart Money Concepts, popularised by Michael J. Huddleston, an imbalance is the umbrella term for any zone where price moved so quickly in one direction that buyers and sellers never traded fairly against each other. The market skipped a price range instead of grinding through it. Because that range never got fully traded, the theory holds that price “tends to” revisit it later to rebalance — a tendency observed on charts, not a mechanical certainty.
Underneath that umbrella sit several specific patterns:
- Fair value gap (FVG) — the most common and the most precisely defined. A three-candle pattern where the outer wicks leave an untouched gap around a large middle candle.
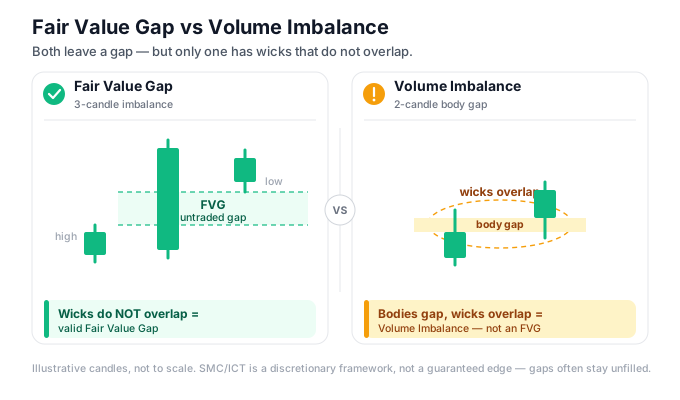
- Volume imbalance — a gap between the bodies of two adjacent candles (a close-to-open gap) where the wicks still overlap. It is an imbalance but not an FVG.
- Liquidity void — a broad, multi-candle run of large, near-wickless candles. A bigger inefficiency zone that can contain several FVGs stacked inside it.
So the relationship is category versus specific instance. Every fair value gap is an imbalance; not every imbalance is a fair value gap. Most retail traders collapse the two terms into one word, which is fine in casual chat but wrong when you are trying to read a chart precisely — because a volume imbalance and an FVG behave and look different.
You will also see the labels BISI and SIBI thrown around as if they were separate patterns. They are not. BISI (buy-side imbalance, sell-side inefficiency) is simply a bullish fair value gap, formed by a sharp move up. SIBI (sell-side imbalance, buy-side inefficiency) is a bearish fair value gap from a sharp move down. Directional labels, nothing more. If someone tells you BISI is a distinct entry model from an FVG, they have misunderstood the vocabulary.
For the full picture of how imbalances relate to order blocks, liquidity and market structure, see the Smart Money Concepts guide. This article zooms in on the imbalance family specifically. For the FVG on its own, the dedicated fair value gap explainer goes deeper on that single pattern.
How to spot an imbalance on a chart
Start with displacement
Imbalances only form inside displacement — a fast, one-directional move that stands out from the surrounding chop. Zoom out first. If price is ranging quietly, you will not find a clean imbalance; you will find noise. So before you hunt for gaps, identify where price actually ran.
Isolate three candles for an FVG
A fair value gap is defined over exactly three consecutive candles. Label them 1 (before the move), 2 (the large displacement candle), and 3 (after). The gap is the non-overlapping space between the wick of candle 1 and the wick of candle 3, created by the displacement of candle 2.
Check the wicks, not the bodies. This is the single most important rule and the one most beginners get wrong.
- Bullish FVG condition: the high of candle 1 sits below the low of candle 3, leaving an untouched gap.
- Bearish FVG condition: the low of candle 1 sits above the high of candle 3.
If the two outer wicks overlap at all, there is no FVG — the market already traded through that price fairly.
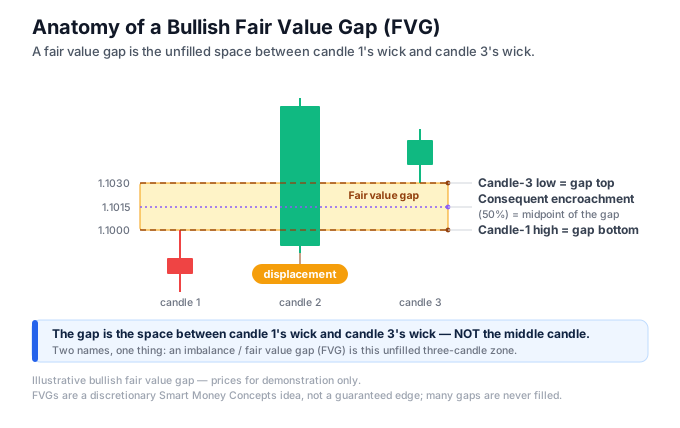
Mark the gap itself as a rectangle: the empty range between candle 1’s wick and candle 3’s wick. That rectangle — not the big middle candle — is what you watch. Its 50% level is called the consequent encroachment (CE) in ICT terminology, and many traders treat it as the reference midpoint of the gap.
Tell a volume imbalance apart
Look at just two adjacent candles. If the body of one and the body of the next do not connect — a close-to-open gap — but the wicks still overlap, that body gap is a volume imbalance, not a fair value gap. Same family, different pattern.
Tell a liquidity void apart
A liquidity void is a broad run of large, near-wickless candles spanning several bars. It is a wider inefficiency zone, and it often has several FVGs sitting inside it. Think of the FVG as the small three-candle unit and the void as the larger region.
Give context weight
An imbalance aligned with the higher-timeframe trend, formed on a break of structure, and left by genuine displacement carries more weight than a tiny gap in quiet conditions. Most FVGs on low timeframes — especially the 1-minute chart — are noise. A chart is littered with micro-gaps; the vast majority mean nothing.
How to trade an imbalance (with a worked example)
Treat an unfilled imbalance as a potential area of interest, not a signal. The core idea is that price often returns to rebalance the inefficiency before continuing, so you watch for a retrace into the gap and look for a reaction there — rather than chasing the displacement candle after it has already run.
Common reference points inside the gap are the far edge (a full fill) and the 50% midpoint (consequent encroachment). Some traders act on the first touch; others wait for lower-timeframe confirmation such as a shift in structure before committing.
Confluence beats the gap alone. An FVG that overlaps an order block, sits at a prior break of structure (see BOS vs CHoCH), or aligns with the higher-timeframe bias is worth more than an isolated gap. Trading every gap you see is a fast route to overtrading.
A concrete example
Say EUR/USD is in a clear uptrend on the 1-hour chart. During the London session, price displaces sharply upward and leaves a bullish FVG: the high of candle 1 is 1.0840 and the low of candle 3 is 1.0865, so there is a 25-pip gap between 1.0840 and 1.0865 that never got traded through. (If you need a refresher on what a pip is, see what is a pip.)
The consequent encroachment sits at 1.08525 — the midpoint. Two hours later, price pulls back and dips into the gap, tapping 1.0850 near that midpoint, right where a prior premium and discount zone boundary also sits. That is confluence.
You do not buy blindly on the tap. You drop to the 5-minute chart and wait for a small shift in structure — a lower-timeframe higher high — to confirm buyers are stepping in. Your invalidation is a decisive close below the far side of the gap at 1.0840; below that, the “return to rebalance” thesis has failed. If your fixed risk is 1% of the account and the stop sits roughly 15 pips away from entry, you size the position from that stop distance and your risk budget — never from how good the setup “looks”.
That is the whole discipline: define the zone, wait for price to come to it, demand confluence, confirm, and manage risk from a logical invalidation. New to structuring trades this way? The trading plan guide covers turning rules like these into a written process.
Be realistic about fill rates
FVGs get filled often but not always. Plenty stay open as price runs away, and a “filled” gap can keep going straight through without reversing. There is no reliable published win-rate or fill-probability for FVG entries. Anyone quoting you a precise percentage — “FVGs fill 78% of the time” — is guessing or repeating a number someone else invented. Treat the fill tendency as a probability, not a law.
Timing your trades around ICT killzones can concentrate the displacement that creates clean imbalances, because sessions overlap and volume rises. But the exact windows are a statistical convenience, not a guarantee that any given setup will work. And the popular story that “smart money is hunting your specific stop loss” is marketing, not mechanism. Institutions trade around pools of liquidity in aggregate; they do not know or care where your individual stop sits. If that idea interests you, read it properly under inducement and liquidity sweeps, both of which are statistical and subjective, not magic.
Honest bottom line: this is a discretionary framework that helps you organise a chart, not a guaranteed edge. Most retail traders lose money regardless of the method they use. Backtest any imbalance strategy on your own market and timeframe before risking real capital, and never trade money you cannot afford to lose.
Common mistakes
- Checking bodies instead of wicks. A valid FVG needs candle 1 and candle 3 wicks not to overlap. A body-only gap with overlapping wicks is a volume imbalance — a different pattern.
- Thinking the middle candle is the gap. The imbalance is the empty range between candle 1 and candle 3, not the big displacement candle itself.
- Treating “price always fills the gap” as a law. It is a tendency. Many gaps never fill, and filling one does not mean price reverses there.
- Assuming BISI/SIBI are separate patterns. They are just directional labels for bullish and bearish fair value gaps.
- Trading every micro-gap on the 1-minute chart. Low timeframes are littered with tiny imbalances that are mostly noise. Ignoring higher-timeframe context leads straight to overtrading.
- Believing the “banks are hunting your stop” narrative. Order flow does not work at the level of your individual position.
- Quoting a precise FVG win-rate. No such reliable published figure exists. Treat any exact percentage as invented.
- Confusing an FVG with a true price gap. A weekend or session opening gap is a range where no trading occurred at all. A fair value gap forms within continuous trading — price simply moved through the zone too fast to trade it fairly.
How imbalances fit the wider SMC framework
Imbalances are one piece of a larger discretionary system. On their own they are just marks on a chart. They gain meaning when you read them alongside market structure (breaks of structure and changes of character), liquidity (equal highs and lows, sweeps), and points of interest like order blocks. The Smart Money Concepts guide ties these together and explains where each fits in a full analysis.
A typical SMC read might run: identify the higher-timeframe bias and premium/discount, wait for a liquidity sweep of a pool such as equal highs or lows, watch for a change of character, then look for entry at an order block or an unfilled FVG left by the displacement that broke structure. The imbalance is the entry refinement, not the whole thesis.
If you want the software to mark these zones automatically while you learn to see them by eye, a dedicated fair value gap MT5 indicator plots FVGs on the chart for you — useful as a training aid, though it will never replace your own judgement about context and confluence. Understanding the difference between imbalance and FVG first means you will actually understand what the indicator is drawing, rather than blindly trading every box it prints.
None of this converts a discretionary framework into a mechanical edge. Used well, imbalances help you organise a chart and time entries with a logical invalidation. Used badly — every micro-gap, no context, no risk plan — they are just another way to overtrade. Learn the precise mechanics, stay honest about the limits, and test everything yourself before it touches real money.
Frequently asked questions
What is the difference between an imbalance and a fair value gap?
Imbalance is the umbrella term for any zone left inefficient by one-sided price movement. A fair value gap is one specific, precisely defined type of imbalance: the three-candle pattern where candle 1 and candle 3 wicks do not overlap. So every FVG is an imbalance, but imbalance also covers volume imbalances and liquidity voids.
Is a fair value gap the same as a volume imbalance?
No. A fair value gap is a three-candle pattern where the wicks of candle 1 and candle 3 do not overlap. A volume imbalance is a gap between the bodies of two adjacent candles where the wicks still overlap. Both are types of imbalance, but only the wick-gap version is a true FVG.
What are BISI and SIBI in ICT trading?
BISI (buy-side imbalance, sell-side inefficiency) is ICT’s label for a bullish fair value gap, formed by a sharp move up. SIBI (sell-side imbalance, buy-side inefficiency) is a bearish fair value gap from a sharp move down. They are directional names for FVGs, not separate patterns.
Do fair value gaps always get filled?
No. Price often returns to rebalance a fair value gap, which is why traders watch them, but many gaps never fill and price can run away. Filling a gap also does not guarantee a reversal. Treat the fill tendency as a probability, not a rule, and always define an invalidation level.
How do you identify a fair value gap on a chart?
Find a fast, one-directional move (displacement) and isolate the three candles around it. For a bullish FVG the high of candle 1 must sit below the low of candle 3; for a bearish FVG the low of candle 1 must sit above the high of candle 3. Check wicks, not bodies.
Is trading fair value gaps profitable?
There is no reliable published win-rate for FVG entries. Smart Money Concepts is a discretionary framework that helps you read a chart, not a guaranteed edge, and most retail traders lose money regardless of method. Any strategy should be backtested on your own market and traded with strict, predefined risk.
Ready to put this into practice?
Open an account with a regulated broker and apply what you have learned. These are the three brokers we recommend:
Trading forex and CFDs carries a significant risk of loss and is not suitable for everyone. Broker links are affiliate links — we may earn a commission at no cost to you.