


The Renko Adaptive Indicator MT4 is a technical analysis tool for MetaTrader 4 that applies Renko-style price filtering to forex charts. Traditional Renko charts build blocks after price moves a specified number of points or pips, rather than creating a new block simply because a certain amount of time has passed.
An adaptive version takes that idea further. Instead of relying only on one fixed movement threshold, its settings can adjust the way price movement is filtered according to the trader’s chosen parameters or market conditions. The exact calculation can vary between indicator versions, so traders should check the supplied MT4 indicator documentation before assuming a specific formula.
The main concept remains simple: small price fluctuations receive less attention, while larger directional moves become easier to see.
For example, suppose GBP/USD moves 8 pips higher, drops 5 pips, then rises another 18 pips. A conventional chart may show several alternating candles. A Renko-style filter can reduce some of that short-term noise and leave a clearer view of the dominant move.
This makes the tool particularly useful for traders who struggle with market noise, trend confirmation, and false breakouts.
How the Indicator Works in Practice
Renko logic is based around price movement thresholds. A traditional Renko block may form after price travels a defined distance, such as 10 pips. If price continues in the same direction, new blocks appear. A reversal generally requires a larger move because the new block must overcome the previous directional structure.
The adaptive element can make the filtering more flexible. Instead of treating every market condition identically, the indicator may alter its sensitivity based on selected inputs, volatility measures, or its internal calculation method.
That distinction matters during changing market conditions. A setting that works reasonably well on EUR/USD during a quiet London session may react too slowly on GBP/JPY during a major news release.
Consider EUR/USD on the 1-hour chart. If the pair has been trading between 1.0800 and 1.0830, a trader might wait for the indicator to establish bullish blocks after price clears the 1.0830 resistance area. A move through 1.0840, followed by continued bullish blocks, provides stronger confirmation than simply buying the first candle that touches resistance.
A similar approach works on the short side. If USD/JPY breaks below a support zone near 148.20 and the indicator shifts bearish, traders can wait for a retest rather than chasing the initial drop.
Here’s the thing: the indicator doesn’t remove uncertainty. It changes how price movement gets displayed and filtered. Support, resistance, volume conditions, economic news, and higher-timeframe structure still matter.
Renko Adaptive Settings for Different Trading Conditions
There isn’t one perfect setting for every forex pair. Traders should adjust sensitivity according to volatility, spread, and timeframe.
On major pairs such as EUR/USD and USD/CHF, a relatively moderate movement filter can work well for swing or intraday analysis. On a 1-hour chart, traders might test a 10–20 pip movement threshold and compare how many false signals appear during a two- to four-week sample.
For GBP/USD, GBP/JPY, or XAU/USD, a larger filter may be more practical because these markets can cover significant distances quickly. A trader testing GBP/JPY on the 1-hour chart could compare 20-pip and 30-pip settings. The larger setting may produce fewer signals but can reduce entries during short-lived pullbacks.
Lower timeframes require extra caution. On M5 or M15 charts, spread and short-term volatility can make small movements look more meaningful than they really are. A trader could first identify the trend on H1, then use M15 for entry timing.
A useful testing routine is:
- Compare at least two sensitivity settings.
- Test both trending and sideways periods.
- Include normal sessions and major news days.
- Record winning trades, losing trades, average stop size, and maximum drawdown.
- Avoid changing settings after every losing trade.
When testing the indicator on volatile NFP days, traders may see several rapid directional changes. That is a good reminder that no filter can reliably predict the next news-driven move.
Advantages, Limitations, and Comparisons
One clear advantage is visual simplicity. Renko-style filtering can make a strong trend easier to recognize because minor fluctuations don’t receive the same visual weight as larger price moves.
It can also help with trend-following systems. For instance, a trader may require bullish Renko movement, price above the 50-period moving average, and a breakout above recent resistance before entering a long position. That three-part confirmation is usually stronger than relying on one indicator signal.
Compared with a standard moving average, Renko Adaptive focuses more directly on price movement and directional filtering. A 50-period moving average smooths historical prices across a fixed number of periods, while Renko-style logic emphasizes movement beyond a chosen threshold.
Compared with the MACD, the difference is also clear. MACD measures the relationship between moving averages and momentum. Renko-style analysis focuses on filtered price movement. Using both can therefore provide different information rather than simply duplicating the same signal.
But there are drawbacks. Adaptive filtering can delay an entry after a trend has already started. In a sideways market, the indicator may still produce repeated directional changes. And if the settings are optimized too heavily for historical data, the results may look better in testing than they perform in live trading.
Traders should also remember that Renko-style calculations can behave differently from ordinary time-based candles, especially when an indicator constructs synthetic or offline chart data. The exact implementation should be tested on the broker’s MT4 feed before live use.
For risk control, a trader risking 1% of a $5,000 account has a maximum planned loss of $50 per trade. If a EUR/USD setup uses a 20-pip stop, position size should be calculated from that $50 risk rather than choosing a lot size first. The indicator determines the setup; risk management determines whether the trade is affordable.
Trading forex carries substantial risk. No indicator guarantees profits.
Building a Renko-Based Entry Strategy
A practical setup can combine the indicator with market structure instead of using it alone.
For a bullish trade, traders can first identify higher highs and higher lows on H1. They can then mark a resistance level and wait for price to break above it. If the Renko Adaptive Indicator also turns bullish, the trader can look for an entry on a pullback or retest.
Suppose EUR/USD breaks 1.0850 after spending several hours below that level. The trader waits for a bullish Renko confirmation and enters near 1.0855, with a 15–20 pip stop below the retest zone. A first target around 1.0885 gives roughly 30 pips of potential reward against a 20-pip risk.
For a bearish setup, the process is reversed. If GBP/USD loses support at 1.2700, the trader waits for bearish confirmation instead of selling during the first sharp candle. A failed retest around 1.2695 can offer a cleaner entry, with the stop positioned above the recent structure.
This approach reduces the temptation to trade every color change or directional block. The strongest setups usually have agreement between price structure, momentum, and the indicator.
And sometimes the best signal is no signal. If EUR/USD is trapped inside a 15-pip range and the indicator keeps flipping direction, staying out can be more valuable than forcing a trade.
How to Trade with Volatility Bands Indicator MT4
Buy Entry
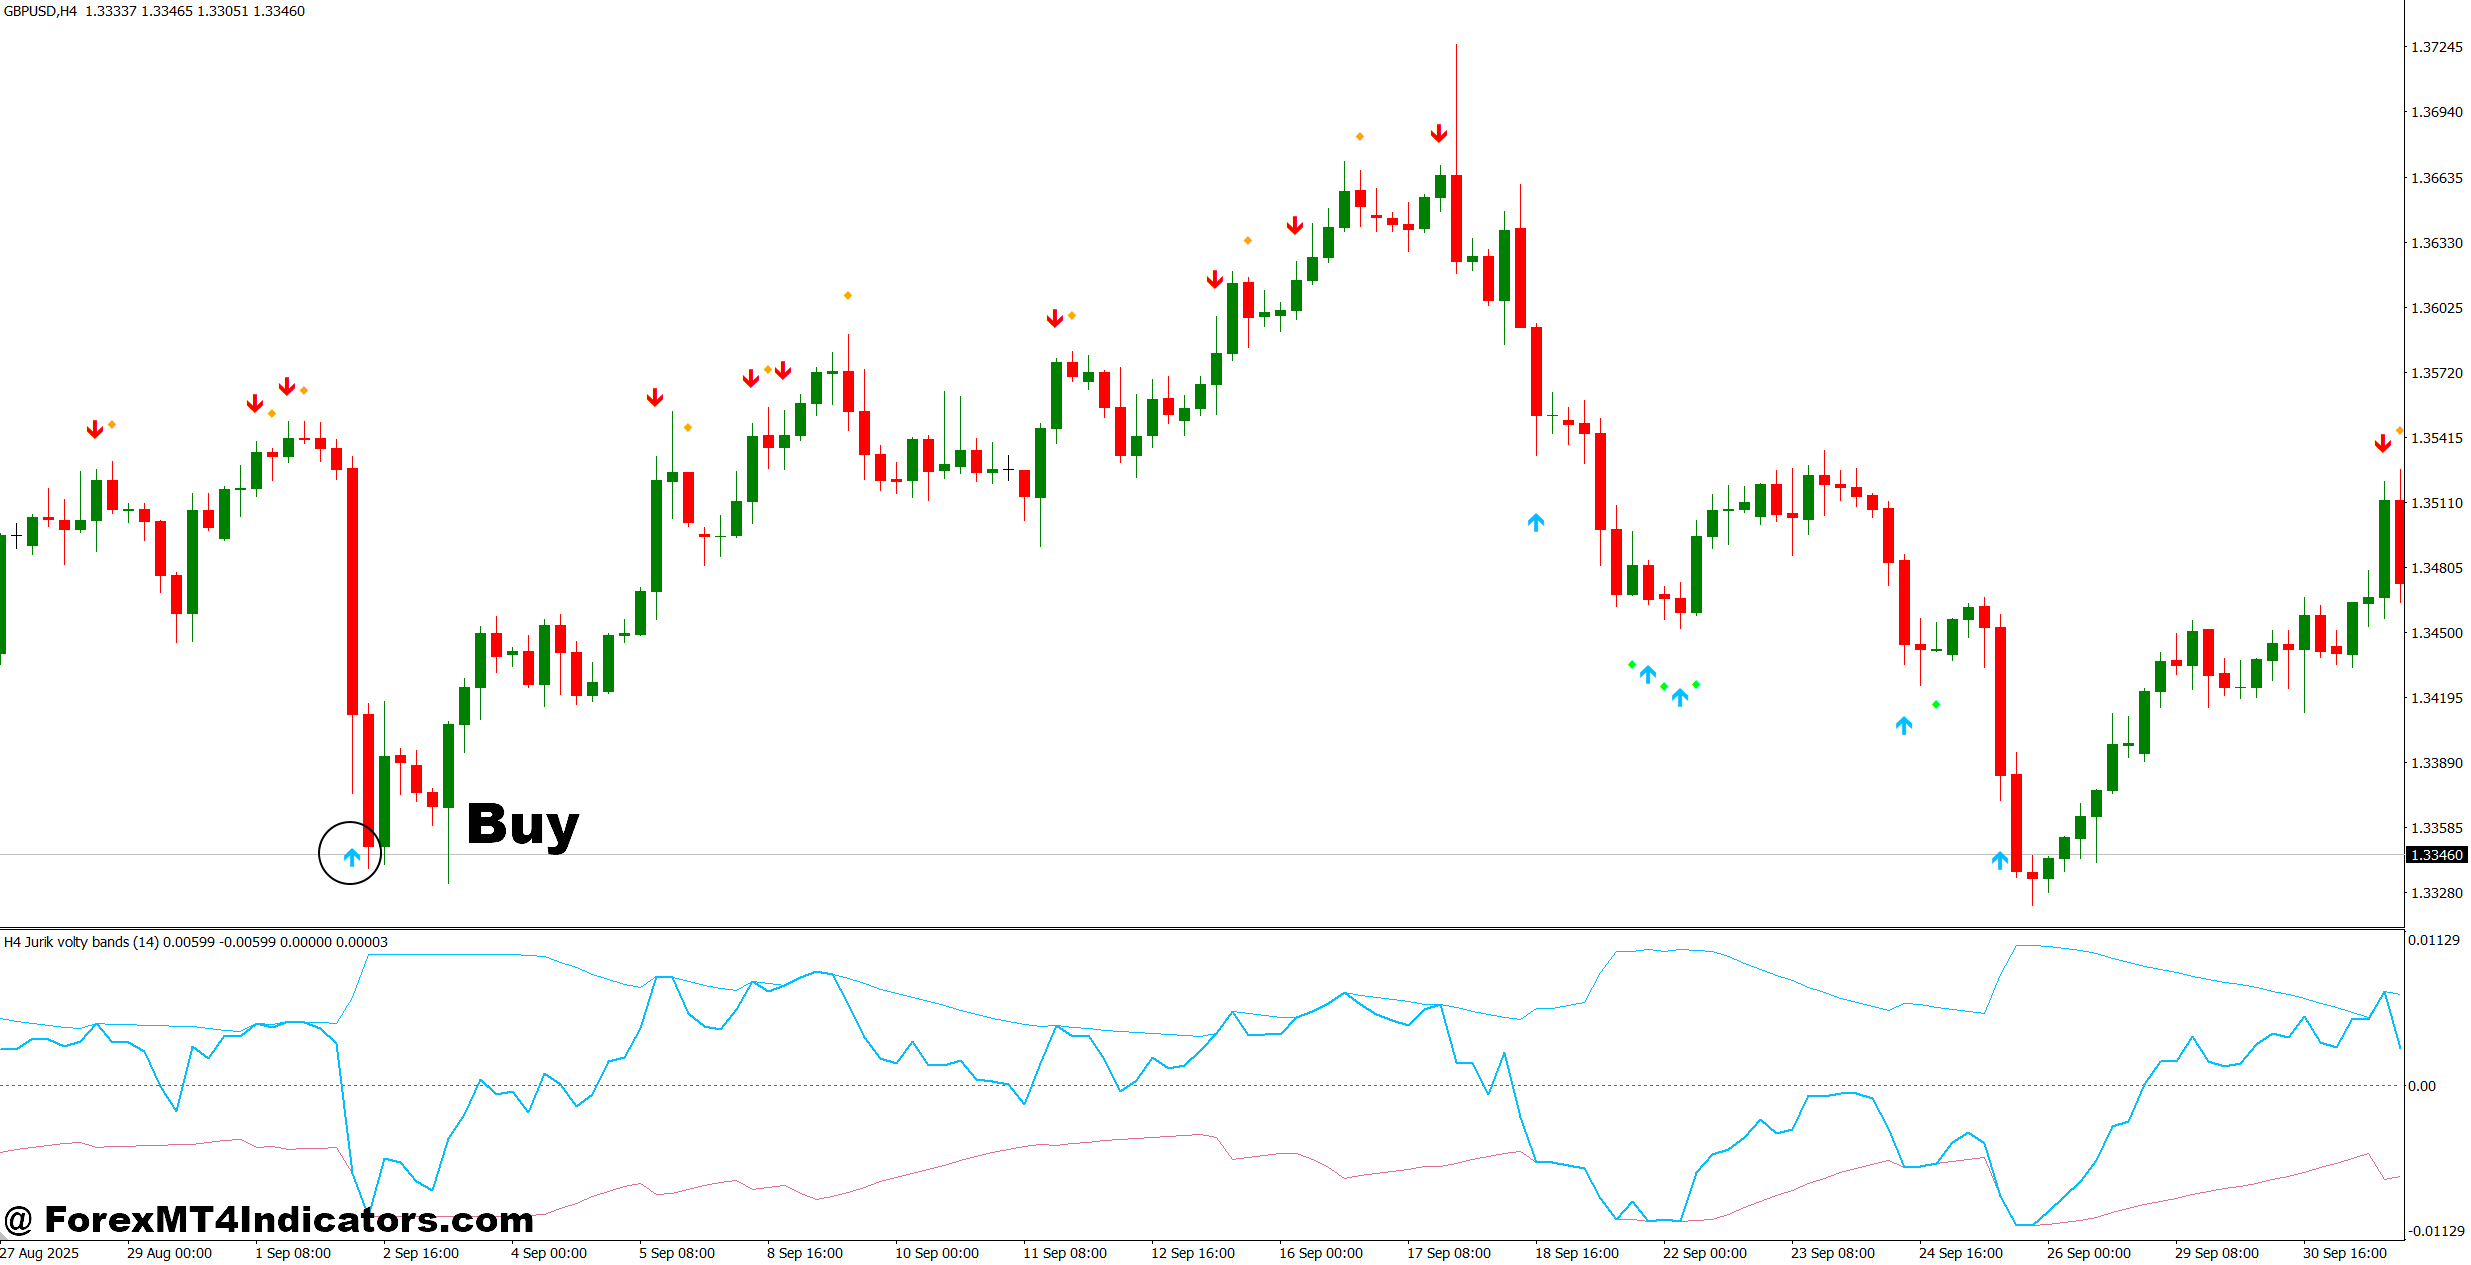
- Wait for a bullish breakout – Buy when price closes above the upper band on the 1-hour chart with strong momentum.
- Confirm the trend – On EUR/USD, look for price above the 50-period moving average before taking a BUY signal.
- Use a band retest – After a 15–20 pip breakout, enter when price retests the upper band and holds it as support.
- Check band expansion – Prefer BUY setups when the bands widen, showing rising volatility and stronger directional movement.
- Confirm on 4-hour – If the 4-hour trend is bullish, prioritize BUY signals on the 1-hour chart.
- Set a controlled stop – Place the stop 10–20 pips below the recent swing low, depending on pair volatility.
- Target at least 1:2 risk-reward – A 20-pip stop should aim for roughly 40 pips or more in potential profit.
- Avoid sideways markets – Don’t buy when bands are flat and price keeps crossing the middle band within a 10–15 pip range.
Sell Entry
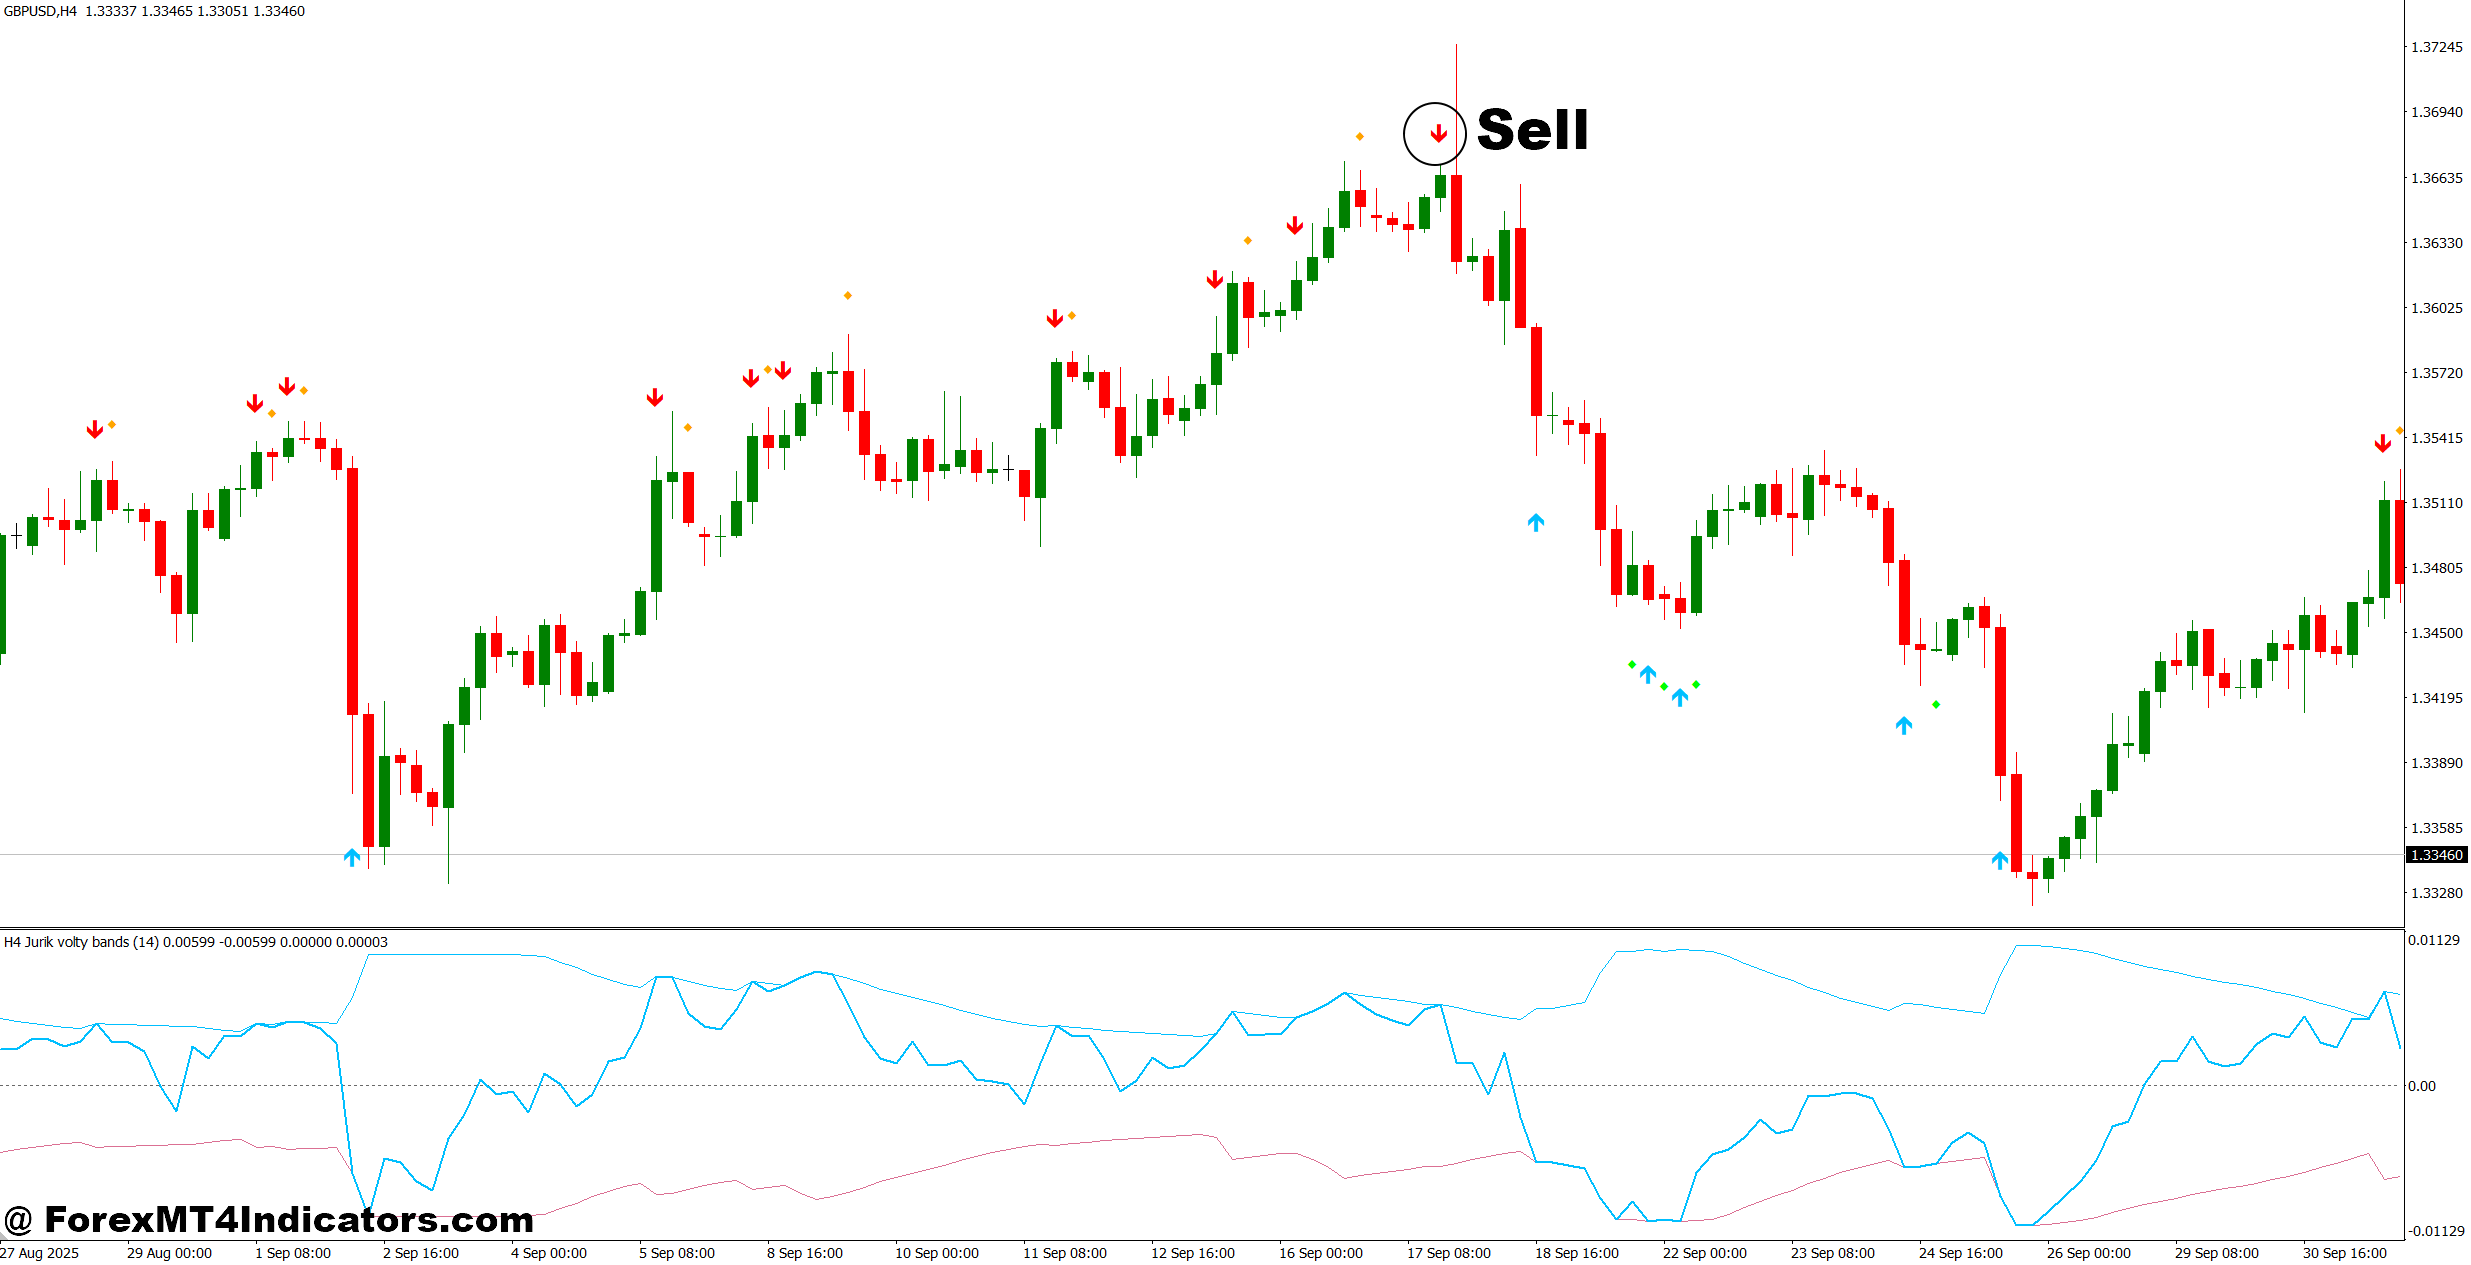
- Wait for a bearish breakout – Sell when price closes below the lower band on the 1-hour chart with clear downside momentum.
- Confirm market direction – On GBP/USD, prefer SELL signals when price remains below the 50-period moving average.
- Sell the retest – After a 20–30 pip breakdown, consider selling when price retests the lower band and gets rejected.
- Look for band expansion – Wider bands after a downside break can confirm increasing volatility and selling pressure.
- Check the 4-hour trend – Avoid short trades against a strong bullish 4-hour structure unless the setup is specifically a reversal trade.
- Keep risk below 1% – For a $5,000 account, limit planned loss to about $50 per trade.
- Use a 1:2 target – With a 25-pip stop, aim for approximately 50 pips or more when market structure supports it.
- Avoid news-driven spikes – Don’t enter immediately before major events such as NFP, CPI, or central-bank decisions; spreads and volatility can distort signals.
Level up your trading
Learn to read the chart — not just the indicator
eBook · Instant PDF
Video Course · 12 modules
Recommended MT4/MT5 Brokers
- ✓ *FREE *$50 to start (withdrawable)
- ✓ Deposit bonus up to $5,000
- ✓ Negative balance protection
Trading forex and CFDs carries a significant risk of loss and is not suitable for everyone. Broker links are affiliate links — we may earn a commission at no cost to you.
Free MT4 Indicator Download

Enter Your Email Address below, download link will be sent to you.
