

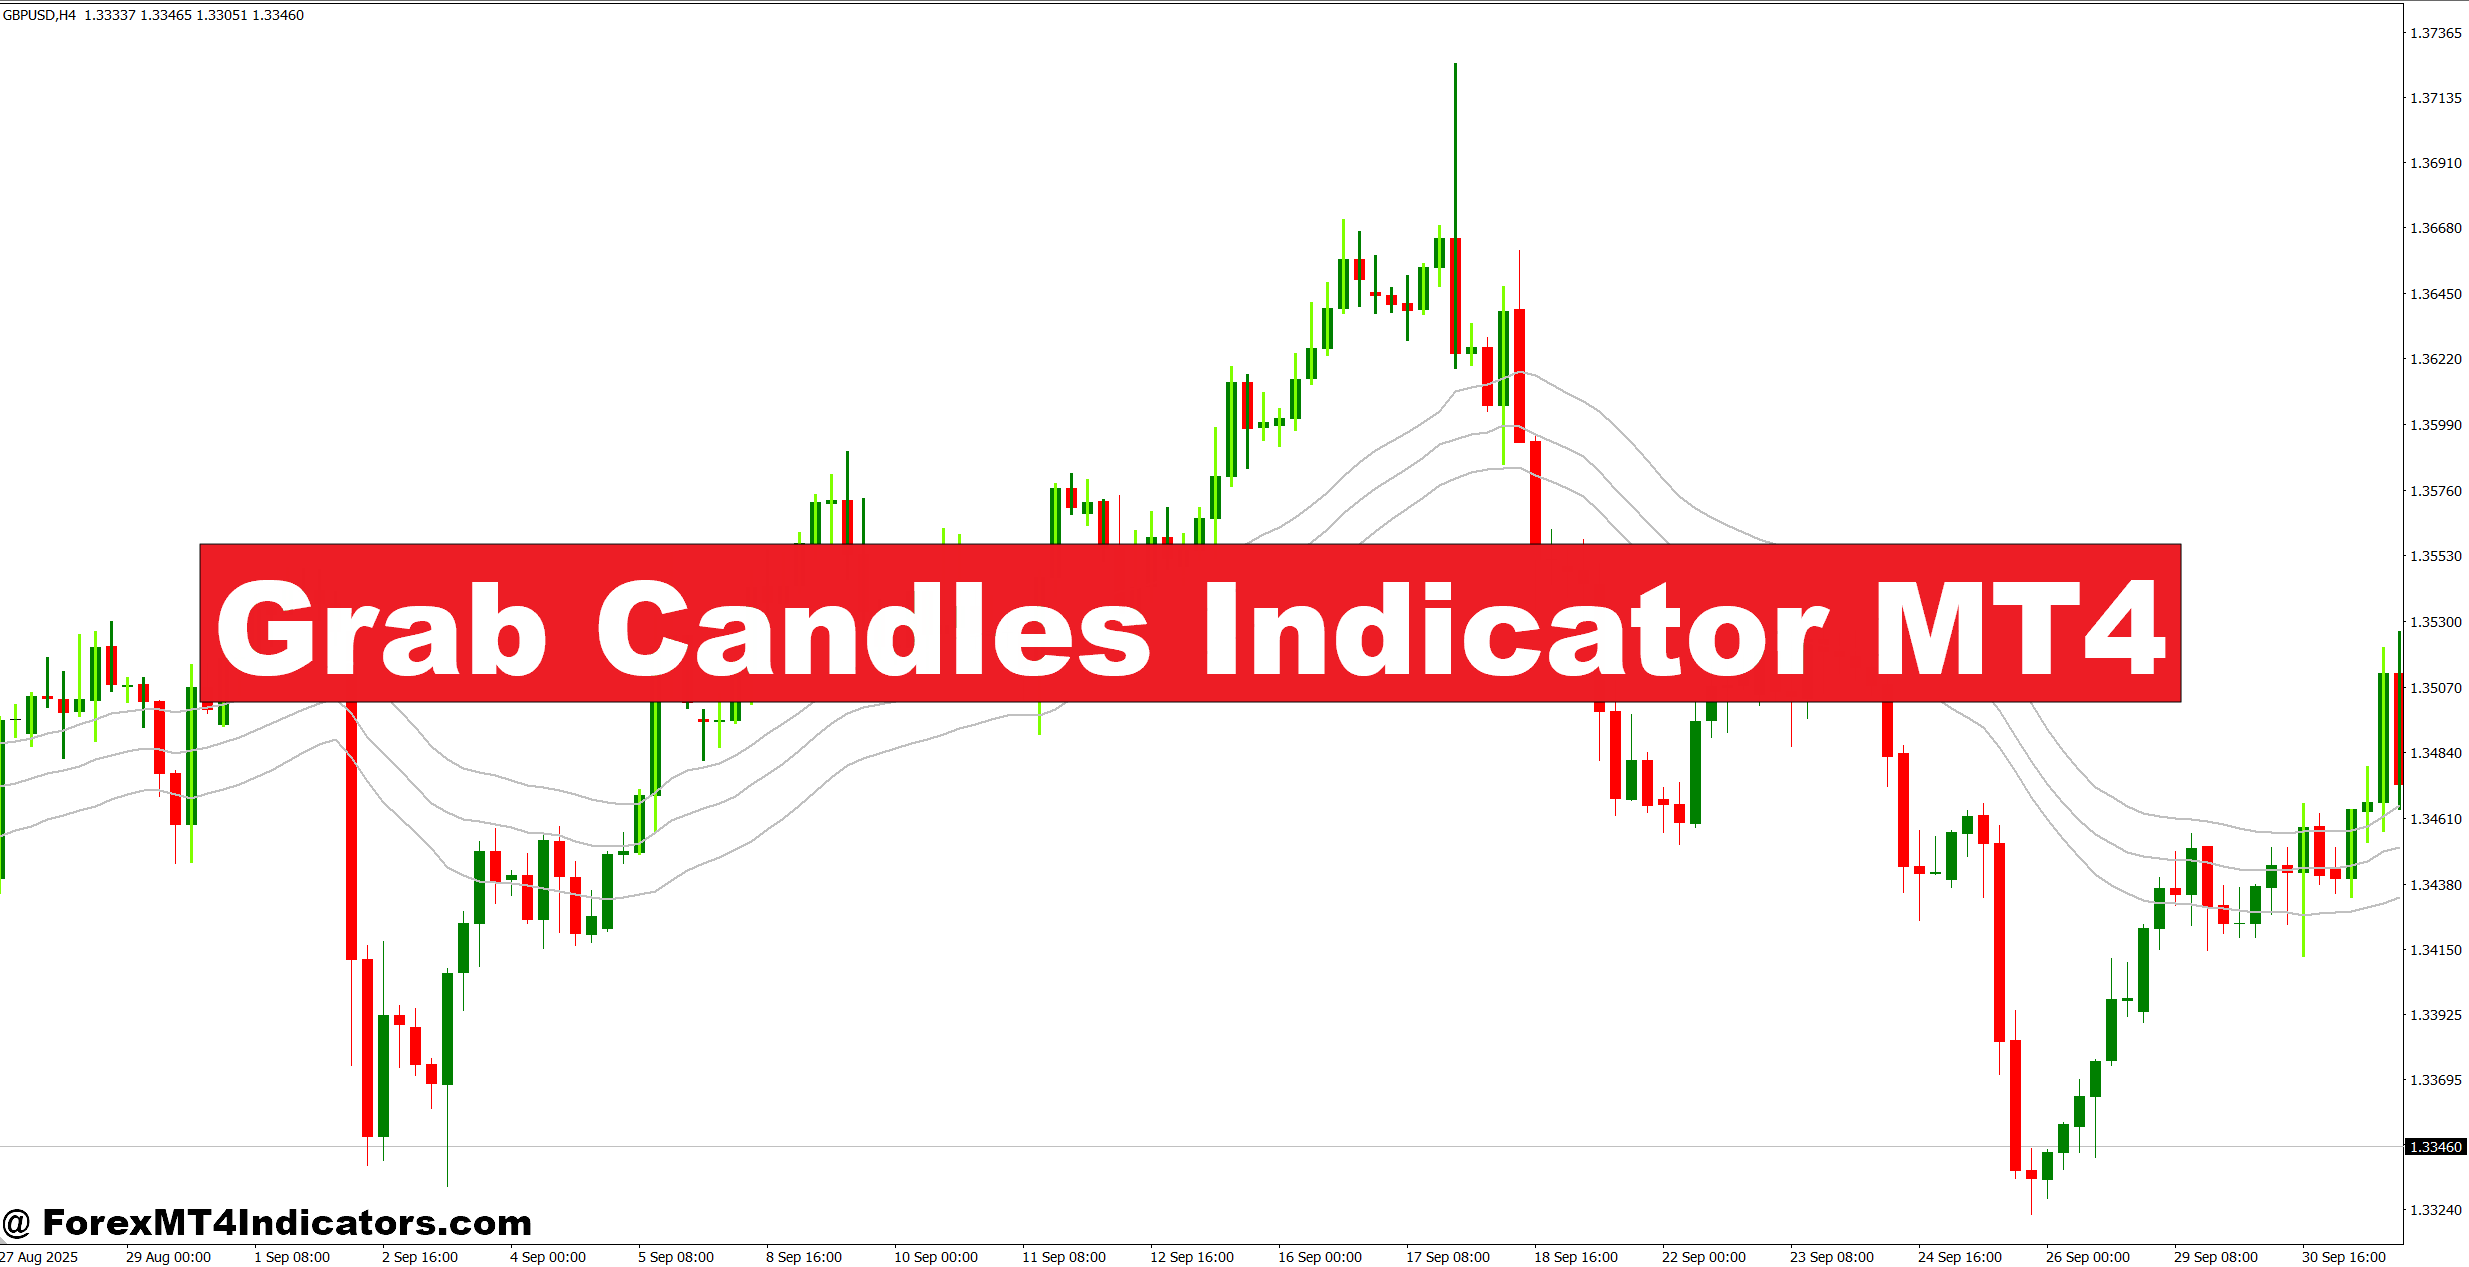
The Grab Candles Indicator MT4 is designed to help traders spot potential candle-based entry conditions without relying on guesswork alone. This matters because repeated false entries can quickly turn into a string of small losses, frustration, and poor trading decisions. The indicator can help organize price action into clearer visual signals, giving traders another way to judge momentum and possible reversals.
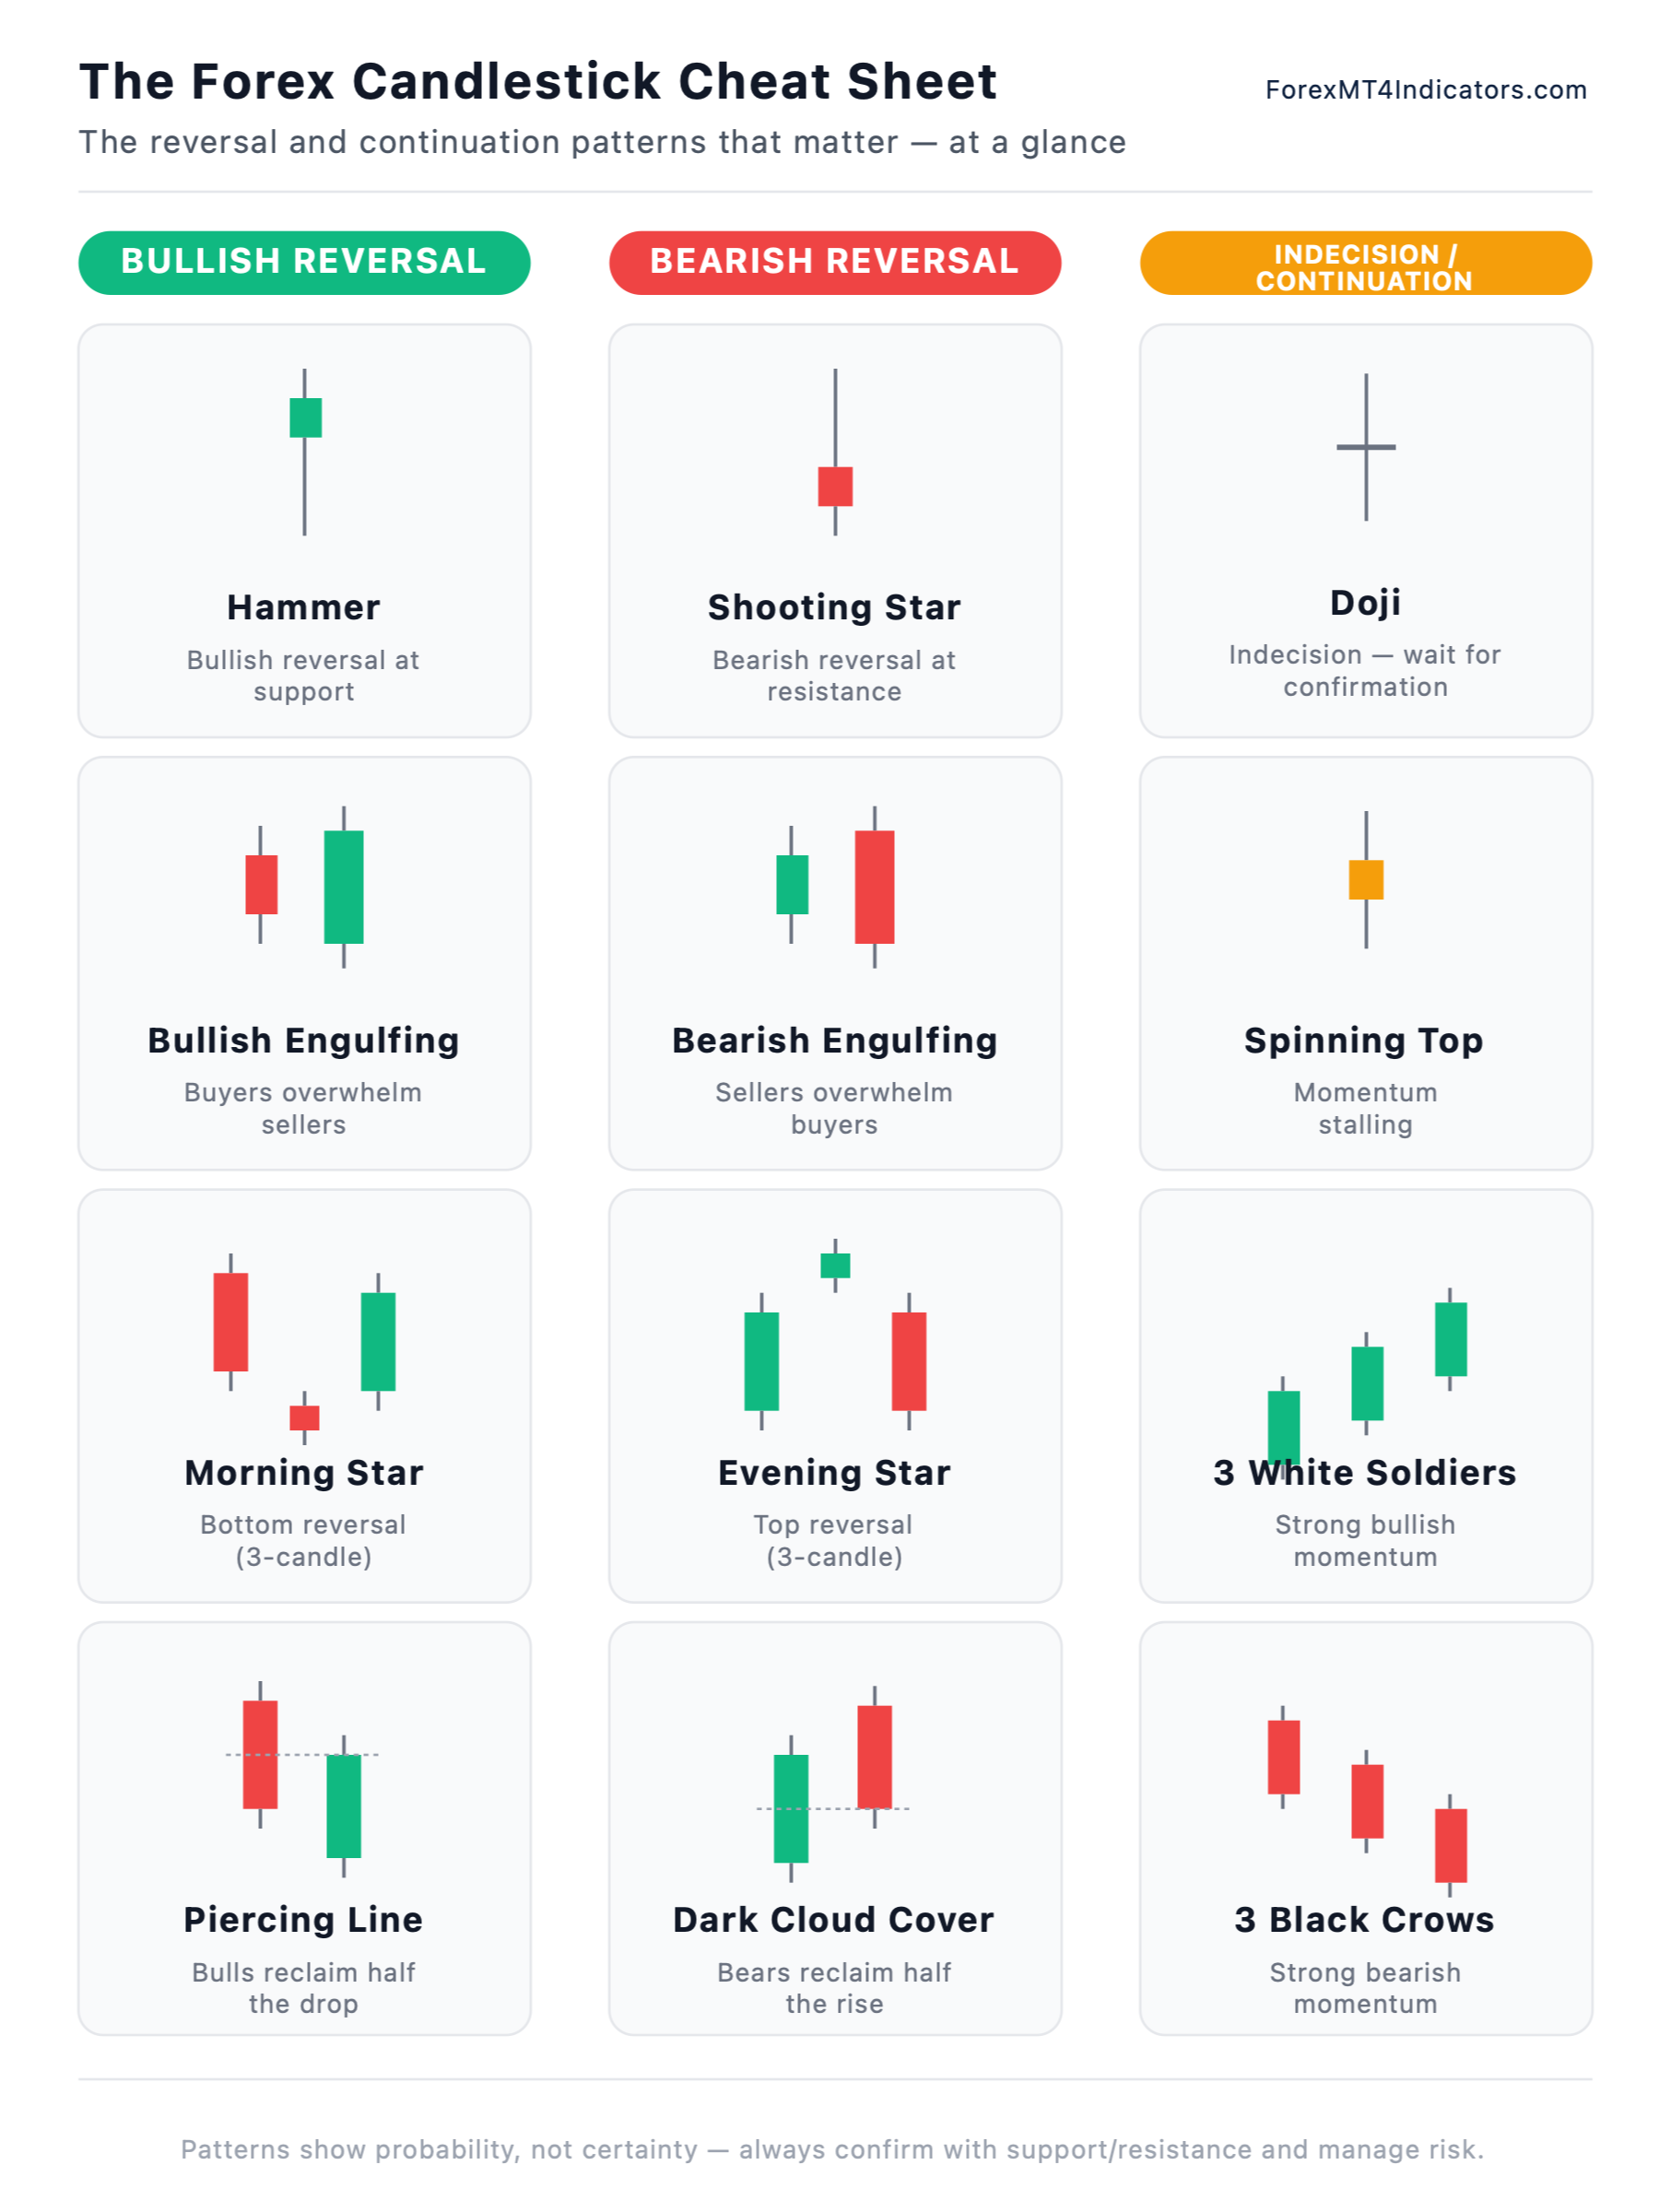

The tool works best when combined with market structure, support and resistance, and sensible risk control. The following sections explain how it works, where it can help, and where traders should remain cautious.
What Is the Grab Candles Indicator MT4?
The Grab Candles Indicator MT4 is a technical analysis tool that focuses on candle behavior and price movement to identify bullish or bearish trading conditions. Depending on the specific version, it may mark candles or display visual signals when predefined price-action conditions are met.
The basic idea is simple: a candle contains useful information about the battle between buyers and sellers. Its open, high, low, apotentialnd close show more than just direction. Candle size, wick length, consecutive closes, and the position of price relative to recent candles can all help traders judge momentum.
Rather than treating an arrow or highlighted candle as an automatic entry, traders can use the signal as a starting point for analysis. For instance, a bullish signal near H1 support deserves more attention than the same signal appearing in the middle of a narrow 15-minute range.
How the Signal Logic Works
The exact calculation depends on the version and its programmed settings, so traders should check the indicator’s input parameters before assuming a particular formula. A common candle-based approach compares the current candle with recent candles using conditions such as bullish or bearish closes, candle range, and recent highs or lows.
A simplified example would be:
- Current candle closes above the previous candle’s high.
- Candle range is larger than the recent average.
- Closing price sits near the upper portion of the candle.
- Recent market structure supports a bullish move.
A bearish setup would reverse those conditions. Some versions may also use moving averages, volatility filters, or configurable thresholds.
That distinction matters. A trader shouldn’t assume every signal has the same calculation simply because two indicators display similar arrows.
Using Grab Candles Signals in Real Trading
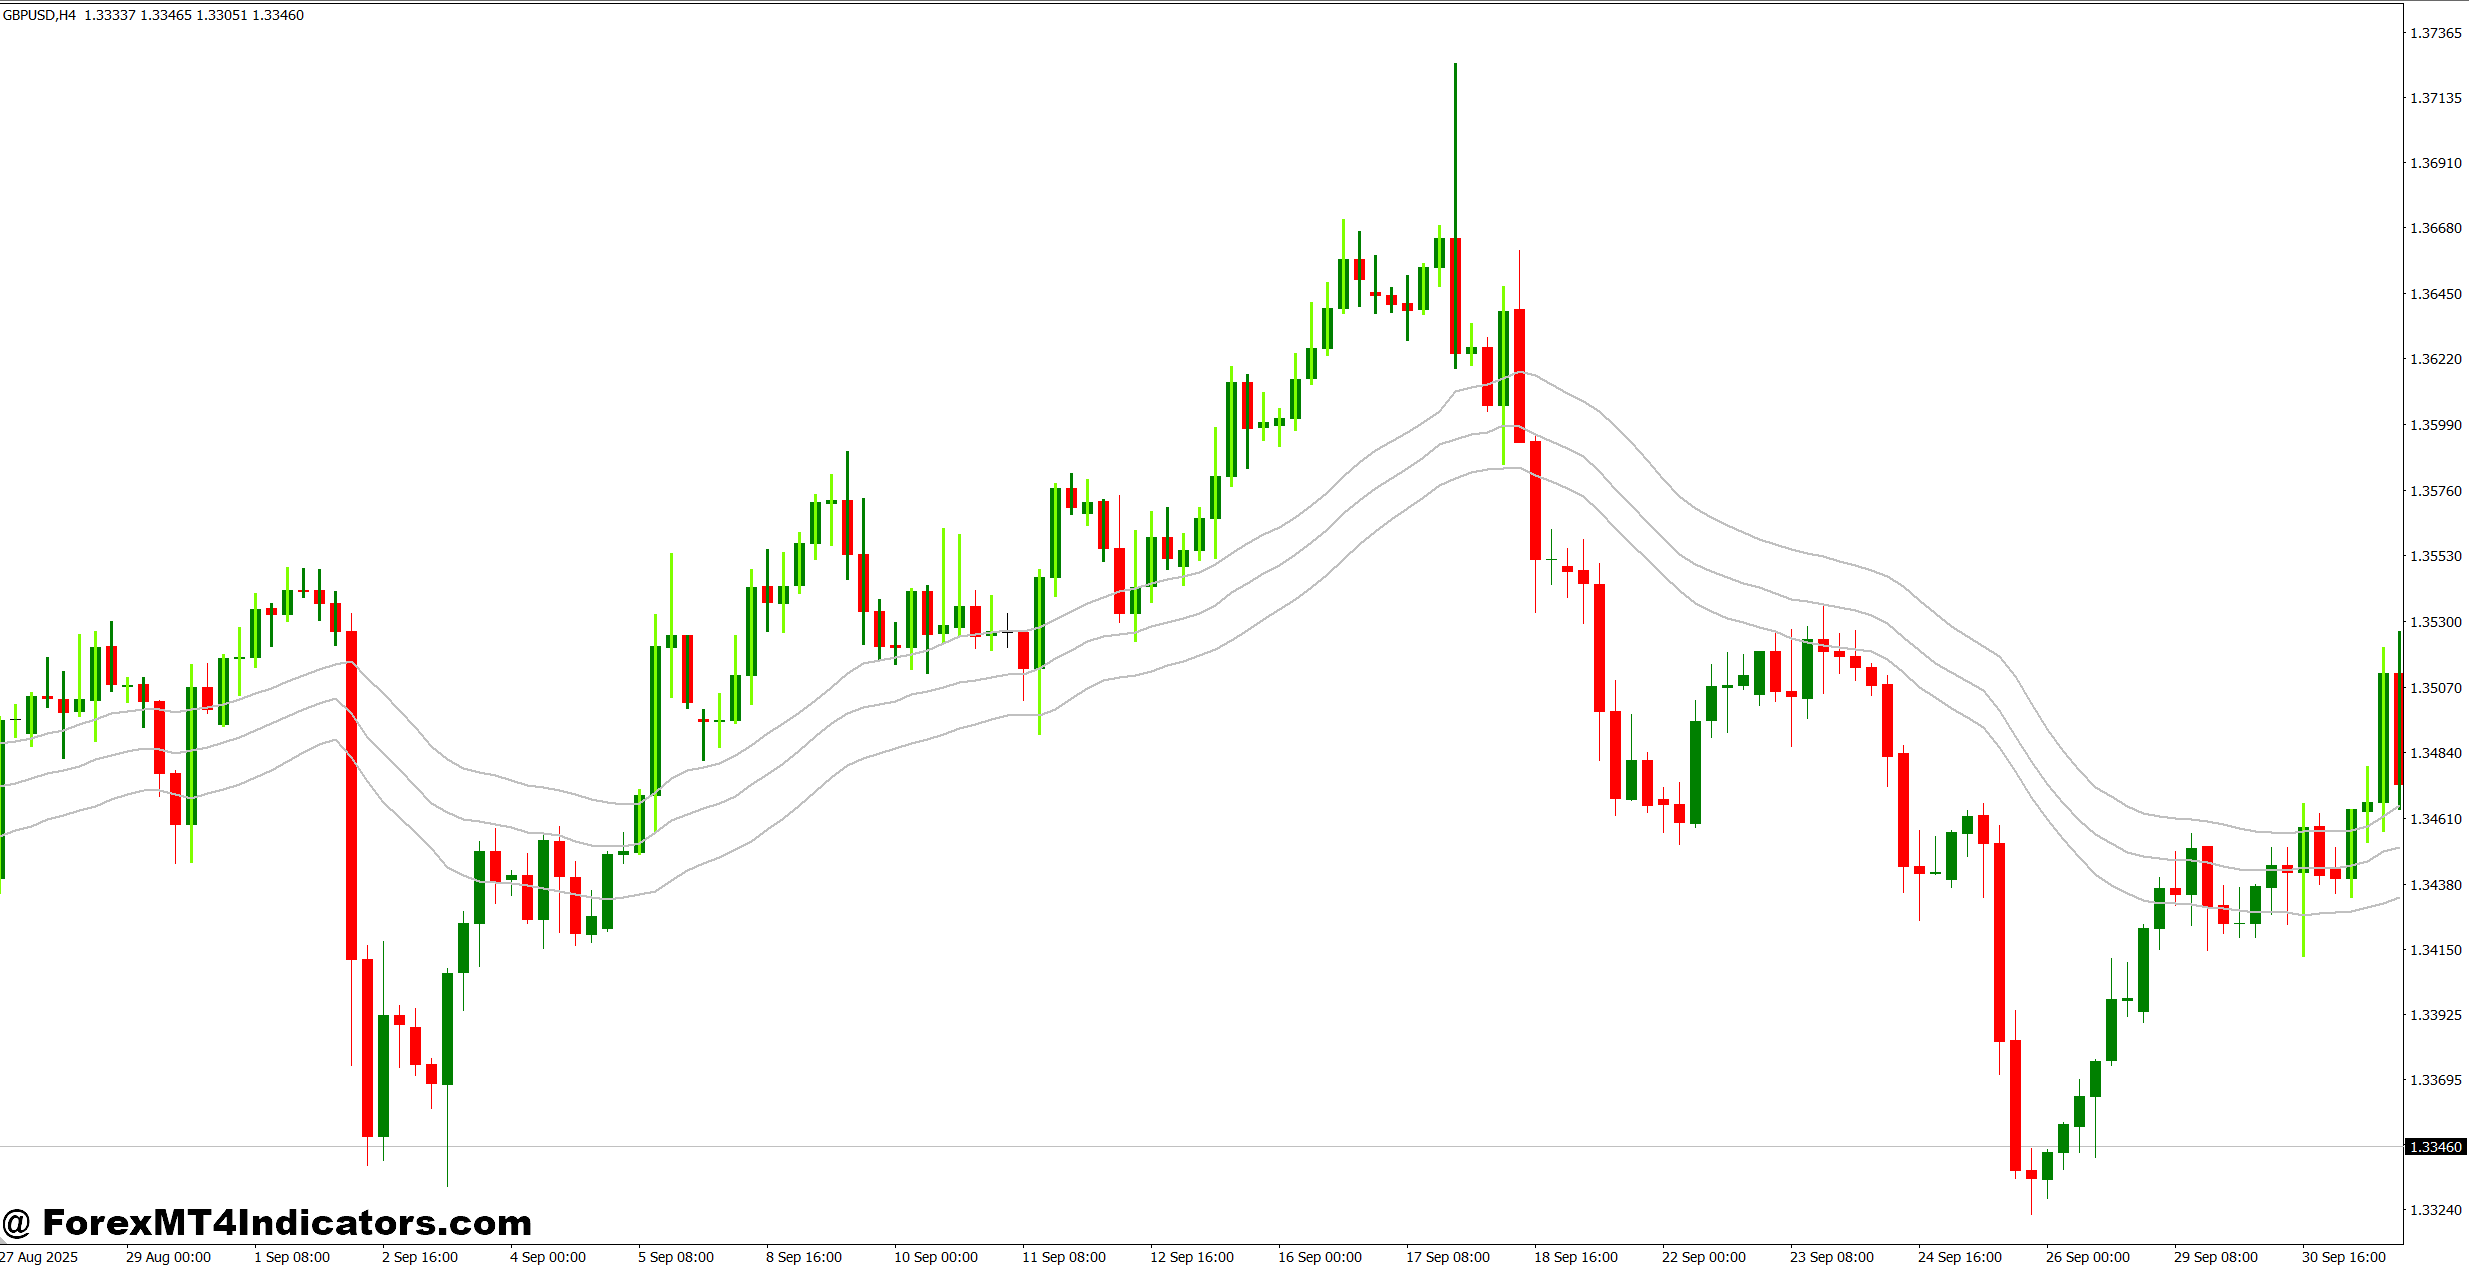
Price location should come before the signal itself. When EUR/USD trades around 1.0850 on the H1 chart and that area has acted as support several times, a bullish candle signal can provide useful confirmation. A trader might wait for the candle to close, then consider an entry around 1.0855 with a stop near 1.0825, creating roughly 30 pips of initial risk.
The same approach works on GBP/USD, but volatility needs more room. Suppose GBP/USD produces a bullish candle signal near 1.2700 after rejecting H4 support. If the candle has a 25-pip range, placing a 10-pip stop simply because it looks attractive may leave the trade vulnerable to normal market noise. A stop around 20–30 pips may make more sense, depending on structure and the trader’s risk plan.
NFP days are another story. During major US employment releases, spreads can widen and candles can expand dramatically within seconds. A candle signal that looks excellent on a historical chart can become a whipsaw in live conditions. Experienced traders often wait for the first reaction to settle instead of chasing the initial spike.
The indicator can also help with continuation setups. For example, USD/JPY may be making higher highs and higher lows on H1. If a bullish candle signal appears after a shallow 15–25 pip pullback toward previous resistance turned support, the setup has better context than a random bullish signal during sideways price action.
Settings for Different Timeframes and Pairs
There isn’t one perfect setting for every forex pair. A configuration that feels responsive on EUR/USD M15 may produce too many signals on GBP/JPY M5.
For lower timeframes, traders should expect more noise. On M5, a 10–20 pip move can happen quickly, so candle signals should be filtered with nearby support and resistance. On M15 and M30, signals can be easier to manage because there is less intraday noise, although false breaks still occur.
H1 and H4 charts are often more useful for traders who prefer fewer but more meaningful setups. A trader could use H4 for the primary trend and H1 for entries. For example, if H4 structure remains bullish, bearish signals on H1 can be treated as pullback warnings rather than immediate short opportunities.
Settings should also account for volatility. During quieter Asian sessions, a candle-size threshold that works during London may generate very few signals. Traders can test different parameters over at least 50–100 historical setups before deciding whether a setting fits their strategy.
Strengths, Limitations, and Useful Filters
One advantage of a candle-based indicator is speed. Traders can scan a chart and quickly identify candles that meet the programmed conditions. This can be helpful when monitoring several pairs at once.
It also fits naturally with traditional price action. Support and resistance, trendlines, swing highs, swing lows, and market structure can all be used as confirmation. A bullish signal directly above daily support is generally more interesting than one appearing underneath a strong resistance level.
But the indicator has clear limitations. It doesn’t know why a market is moving. It can’t reliably predict central-bank decisions, unexpected news, liquidity shocks, or sudden changes in sentiment. A signal can also appear after a large move, leaving traders with poor reward-to-risk conditions.
Another concern is signal quality during consolidation. When price moves between 1.0900 and 1.0930 for several hours, repeated bullish and bearish candle conditions can produce a series of fake-outs. This is classic chop, and no visual signal removes that problem completely.
A practical filter is to require at least two factors before entering. For example:
Candle signal + market structure – A bullish signal should preferably occur near support or after a confirmed higher low.
Candle signal + trend direction – A trader can use a 50-period moving average as a simple trend filter and favor buys above it and sells below it.
Candle signal + reward-to-risk – If the nearest resistance is only 15 pips away while the stop needs 25 pips, skipping the setup may be the better trade.
Grab Candles vs Other Forex Indicators
Compared with the Relative Strength Index, the Grab Candles Indicator focuses more directly on candle behavior rather than measuring momentum through a 0–100 oscillator. The 14-period RSI, for example, can show an overbought condition while price continues rising. A candle-based signal may instead help identify what price is doing at that moment.
Compared with Bollinger Bands, the focus is also different. Bollinger Bands are useful for studying volatility and price position around a moving average. Grab Candles signals can provide a more direct visual cue based on candle conditions.
Neither approach needs to replace the other. A trader might use H4 Bollinger Bands to identify an extended move, H1 support and resistance to define the trading area, and the candle indicator to time a possible entry.
That’s the key point: the indicator works better as part of a trading process than as a standalone buy-and-sell machine.
How to Trade with Grab Candles Indicator MT4
Buy Entry
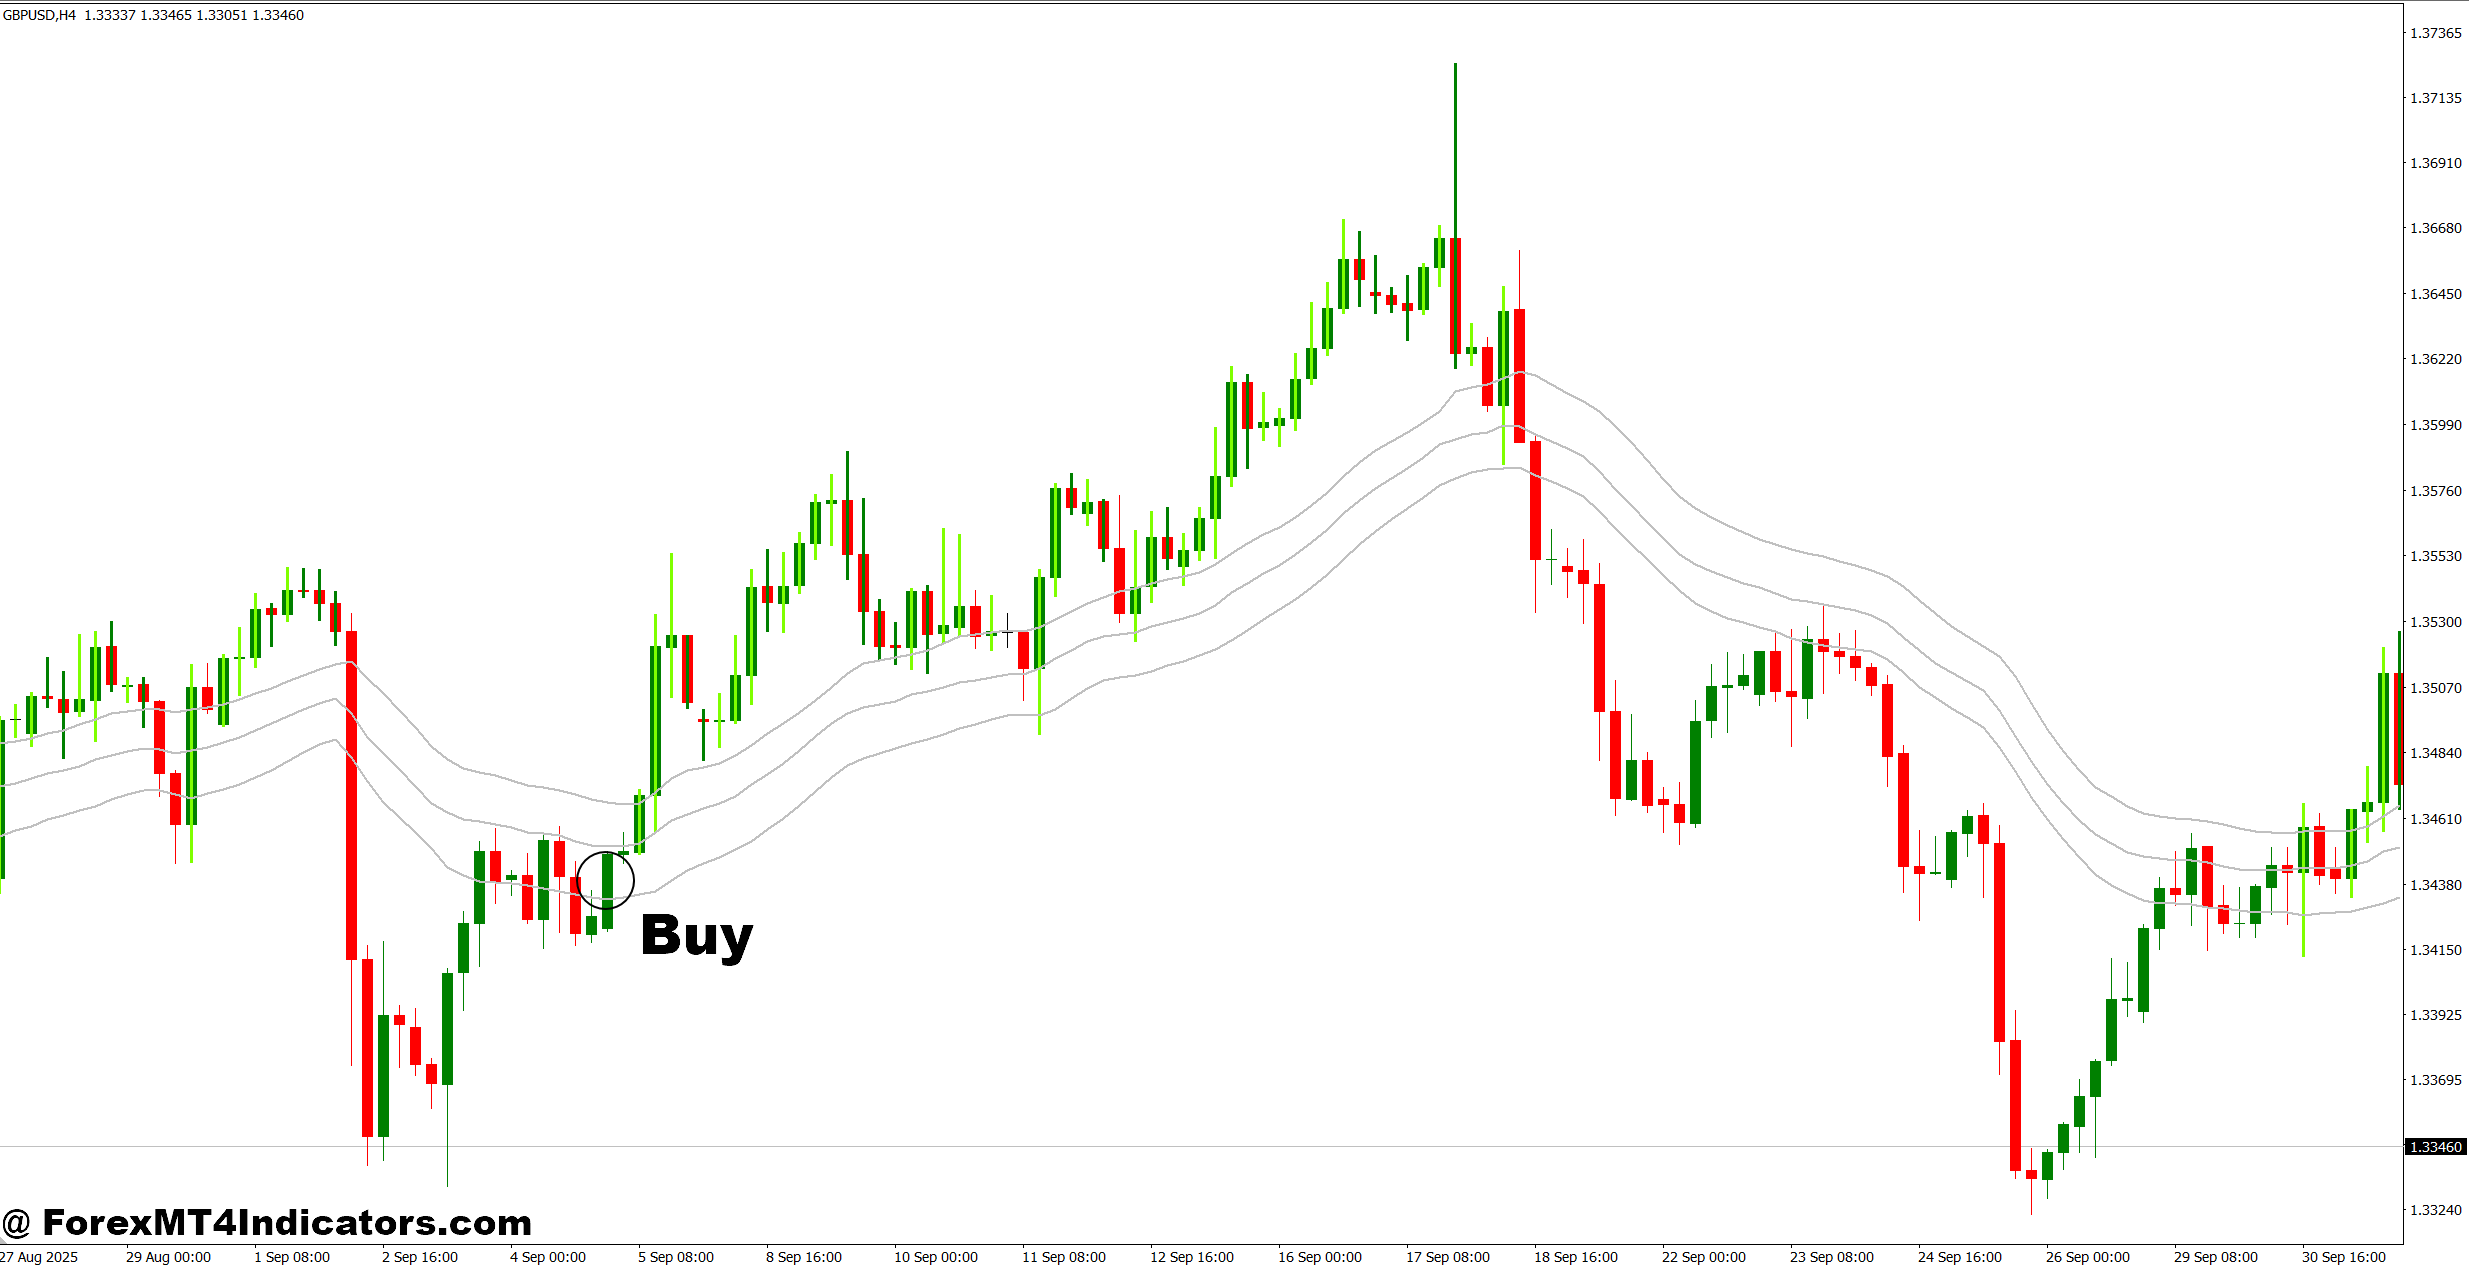
- Wait for a bullish candle signal – Enter after the candle closes bullish on the 1-hour chart; avoid acting on an unfinished candle.
- Confirm H1 support – Look for a buy signal near established support, preferably with 15–30 pips of room below the level for the stop-loss.
- Check the 4-hour trend – Favor EUR/USD buys when the H4 structure shows higher highs and higher lows.
- Use a 1:2 risk-reward ratio – If the stop-loss is 20 pips, target at least 40 pips to keep the setup worthwhile.
- Watch candle strength – Prefer bullish candles closing near their highs, especially when the body covers at least 60% of the total candle range.
- Confirm daily direction – A daily bullish structure can strengthen an H1 buy signal and reduce the chance of trading against the broader trend.
- Limit account risk – Risk around 0.5%–1% per trade instead of increasing lot size after a losing trade.
- Skip weak signals – Avoid GBP/USD buy signals during tight 10–15 pip consolidation or immediately before major news releases.
Sell Entry
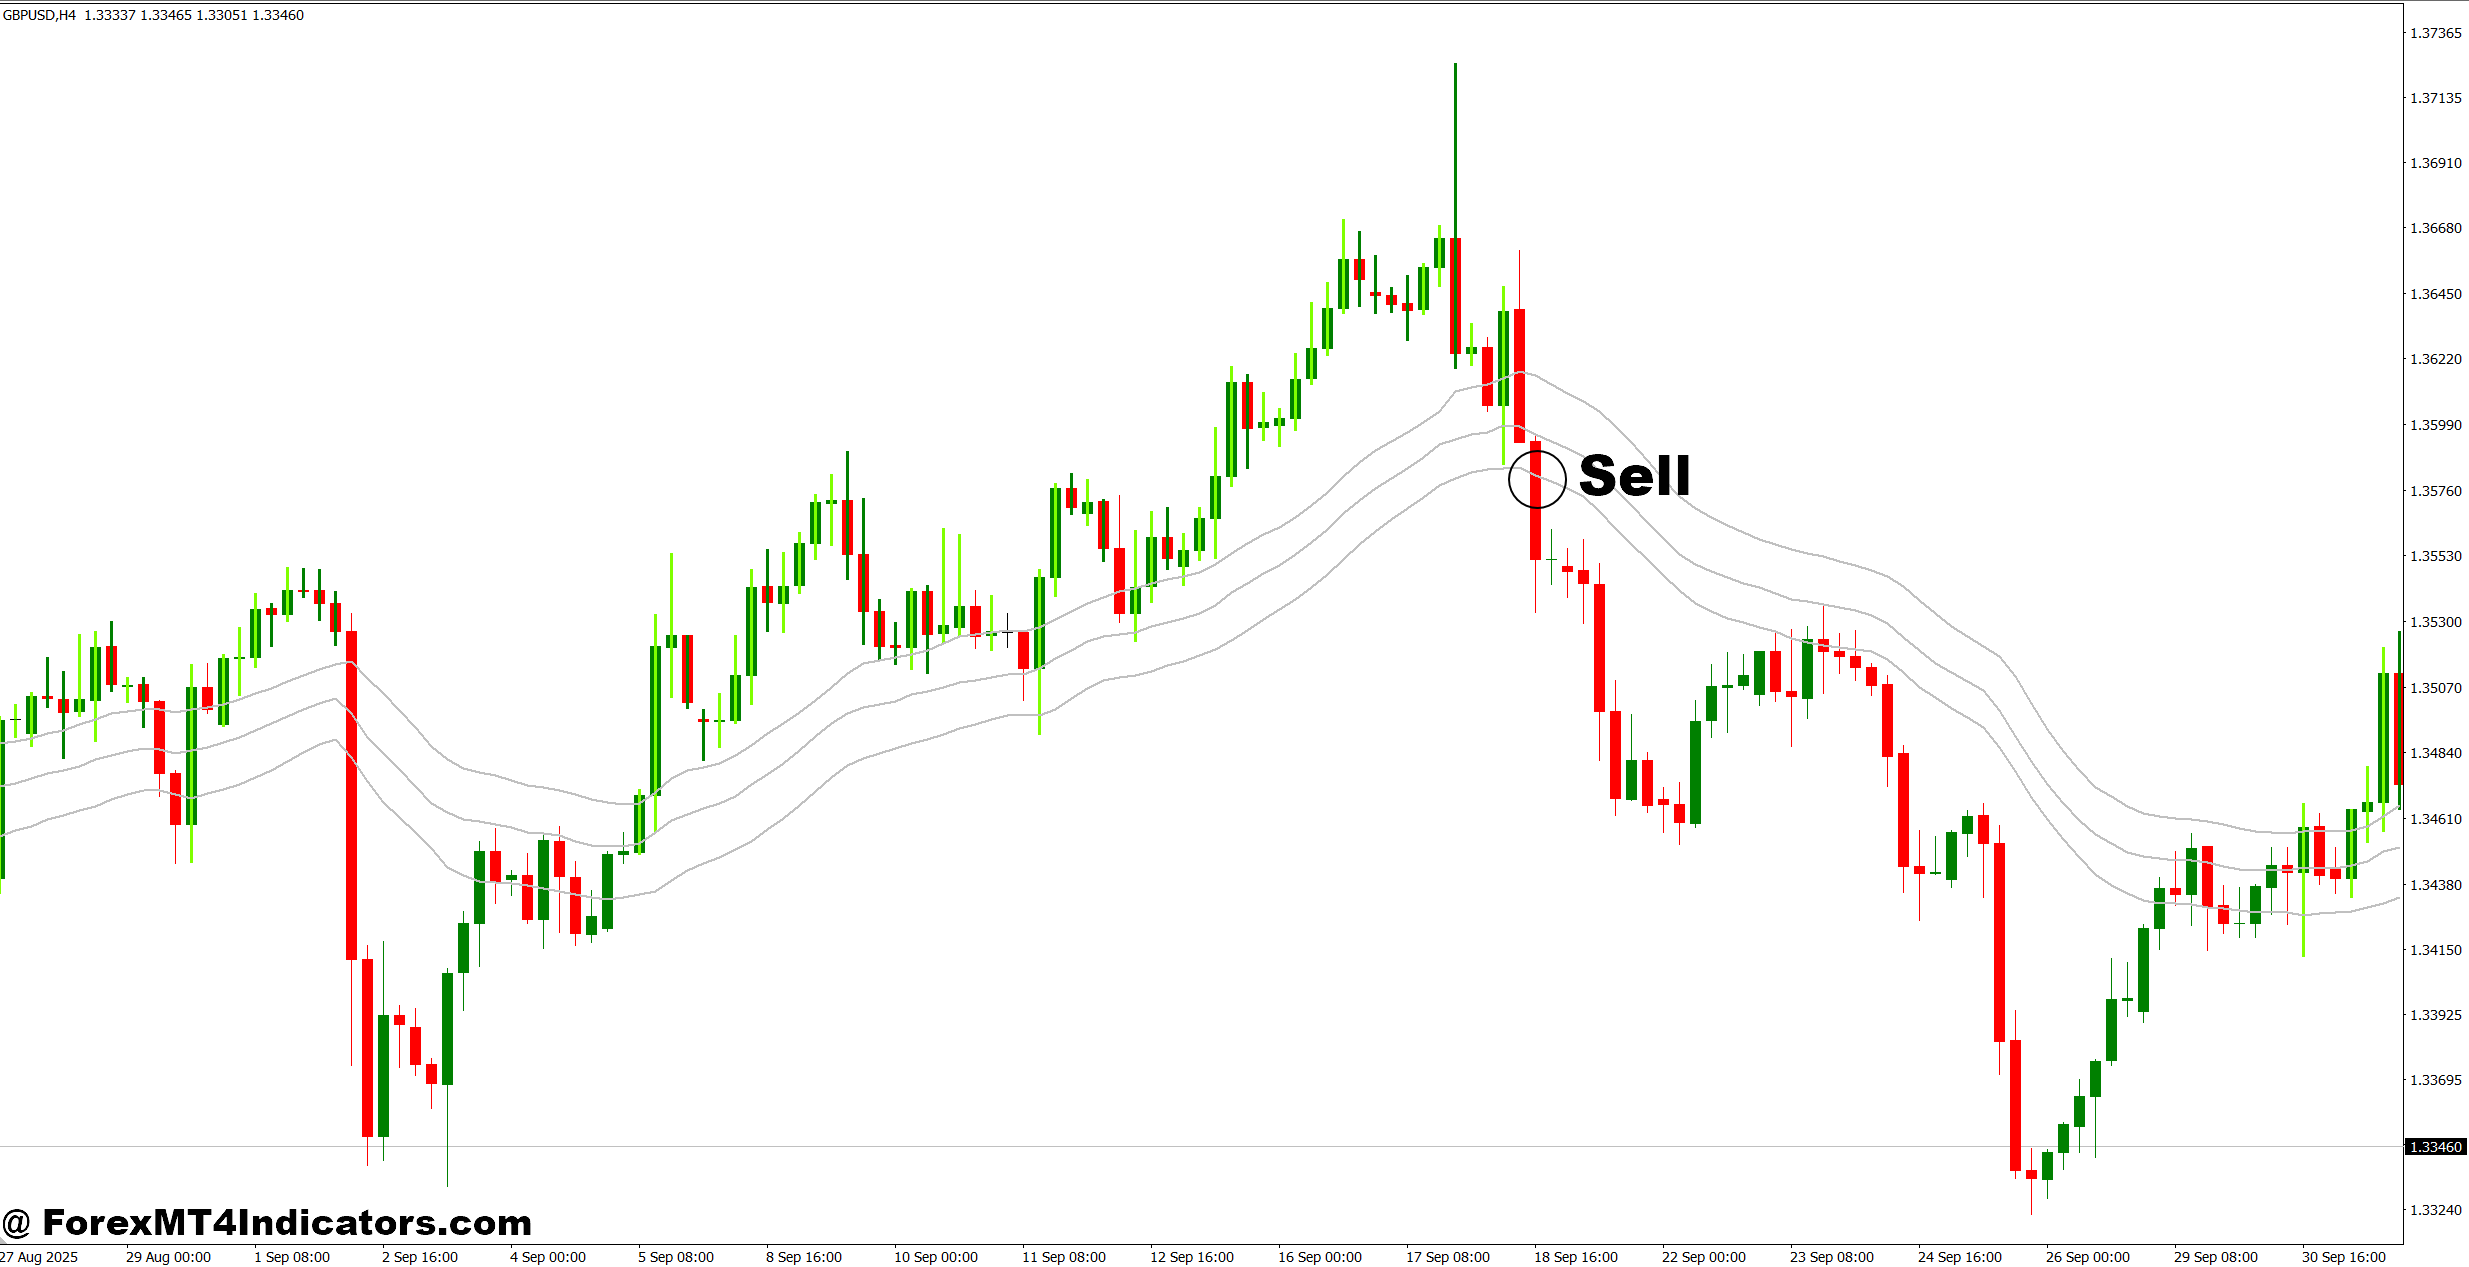
- Wait for a bearish candle signal – Consider selling after the bearish candle closes, rather than entering while the signal is still forming.
- Confirm H1 resistance – Look for the signal near resistance and place the stop around 15–30 pips above the invalidation level.
- Follow the 4-hour trend – Prefer GBP/USD sells when H4 price structure shows lower highs and lower lows.
- Target at least 1:2 R:R – With a 25-pip stop, look for approximately 50 pips of potential profit before entering.
- Check bearish candle strength – Favor candles that close near their lows and have a body covering roughly 60% or more of the range.
- Use daily confirmation – A daily bearish structure can add confidence to an H1 or H4 sell setup.
- Keep risk below 1% – Use a fixed 0.5%–1% account risk per trade and avoid revenge trading after consecutive losses.
- Avoid obvious fake-outs – Don’t sell EUR/USD after a sharp 30–40 pip spike or directly before high-impact economic news.
Final Thoughts on Grab Candles Indicator MT4
The Grab Candles Indicator MT4 can be useful for traders who want a clearer visual way to study candle-based setups. Its strongest role is often entry confirmation rather than market prediction.
Three practical lessons stand out:
- Wait for candle closure – Intrabar signals can change before the candle finishes, so closed-candle confirmation is safer.
- Respect market structure – A signal near established support, resistance, or a recent swing point deserves more attention.
- Control the downside – Risking 0.5%–1% of account equity per trade can help keep a losing sequence manageable, although each trader should use a risk level appropriate to their circumstances.
Testing the indicator across different pairs, sessions, and at least 50–100 historical examples can reveal where it performs well and where it struggles. It should support a defined trading plan, not replace one.
Trading forex carries substantial risk. No indicator guarantees profits. The real edge comes from combining signals with sound analysis, disciplined entries, sensible stop placement, and consistent risk management.
Level up your trading
Learn to read the chart — not just the indicator
eBook · Instant PDF
Video Course · 12 modules
Recommended MT4/MT5 Brokers
- ✓ *FREE *$50 to start (withdrawable)
- ✓ Deposit bonus up to $5,000
- ✓ Negative balance protection
Trading forex and CFDs carries a significant risk of loss and is not suitable for everyone. Broker links are affiliate links — we may earn a commission at no cost to you.
Free MT4 Indicator Download

Enter Your Email Address below, download link will be sent to you.
