

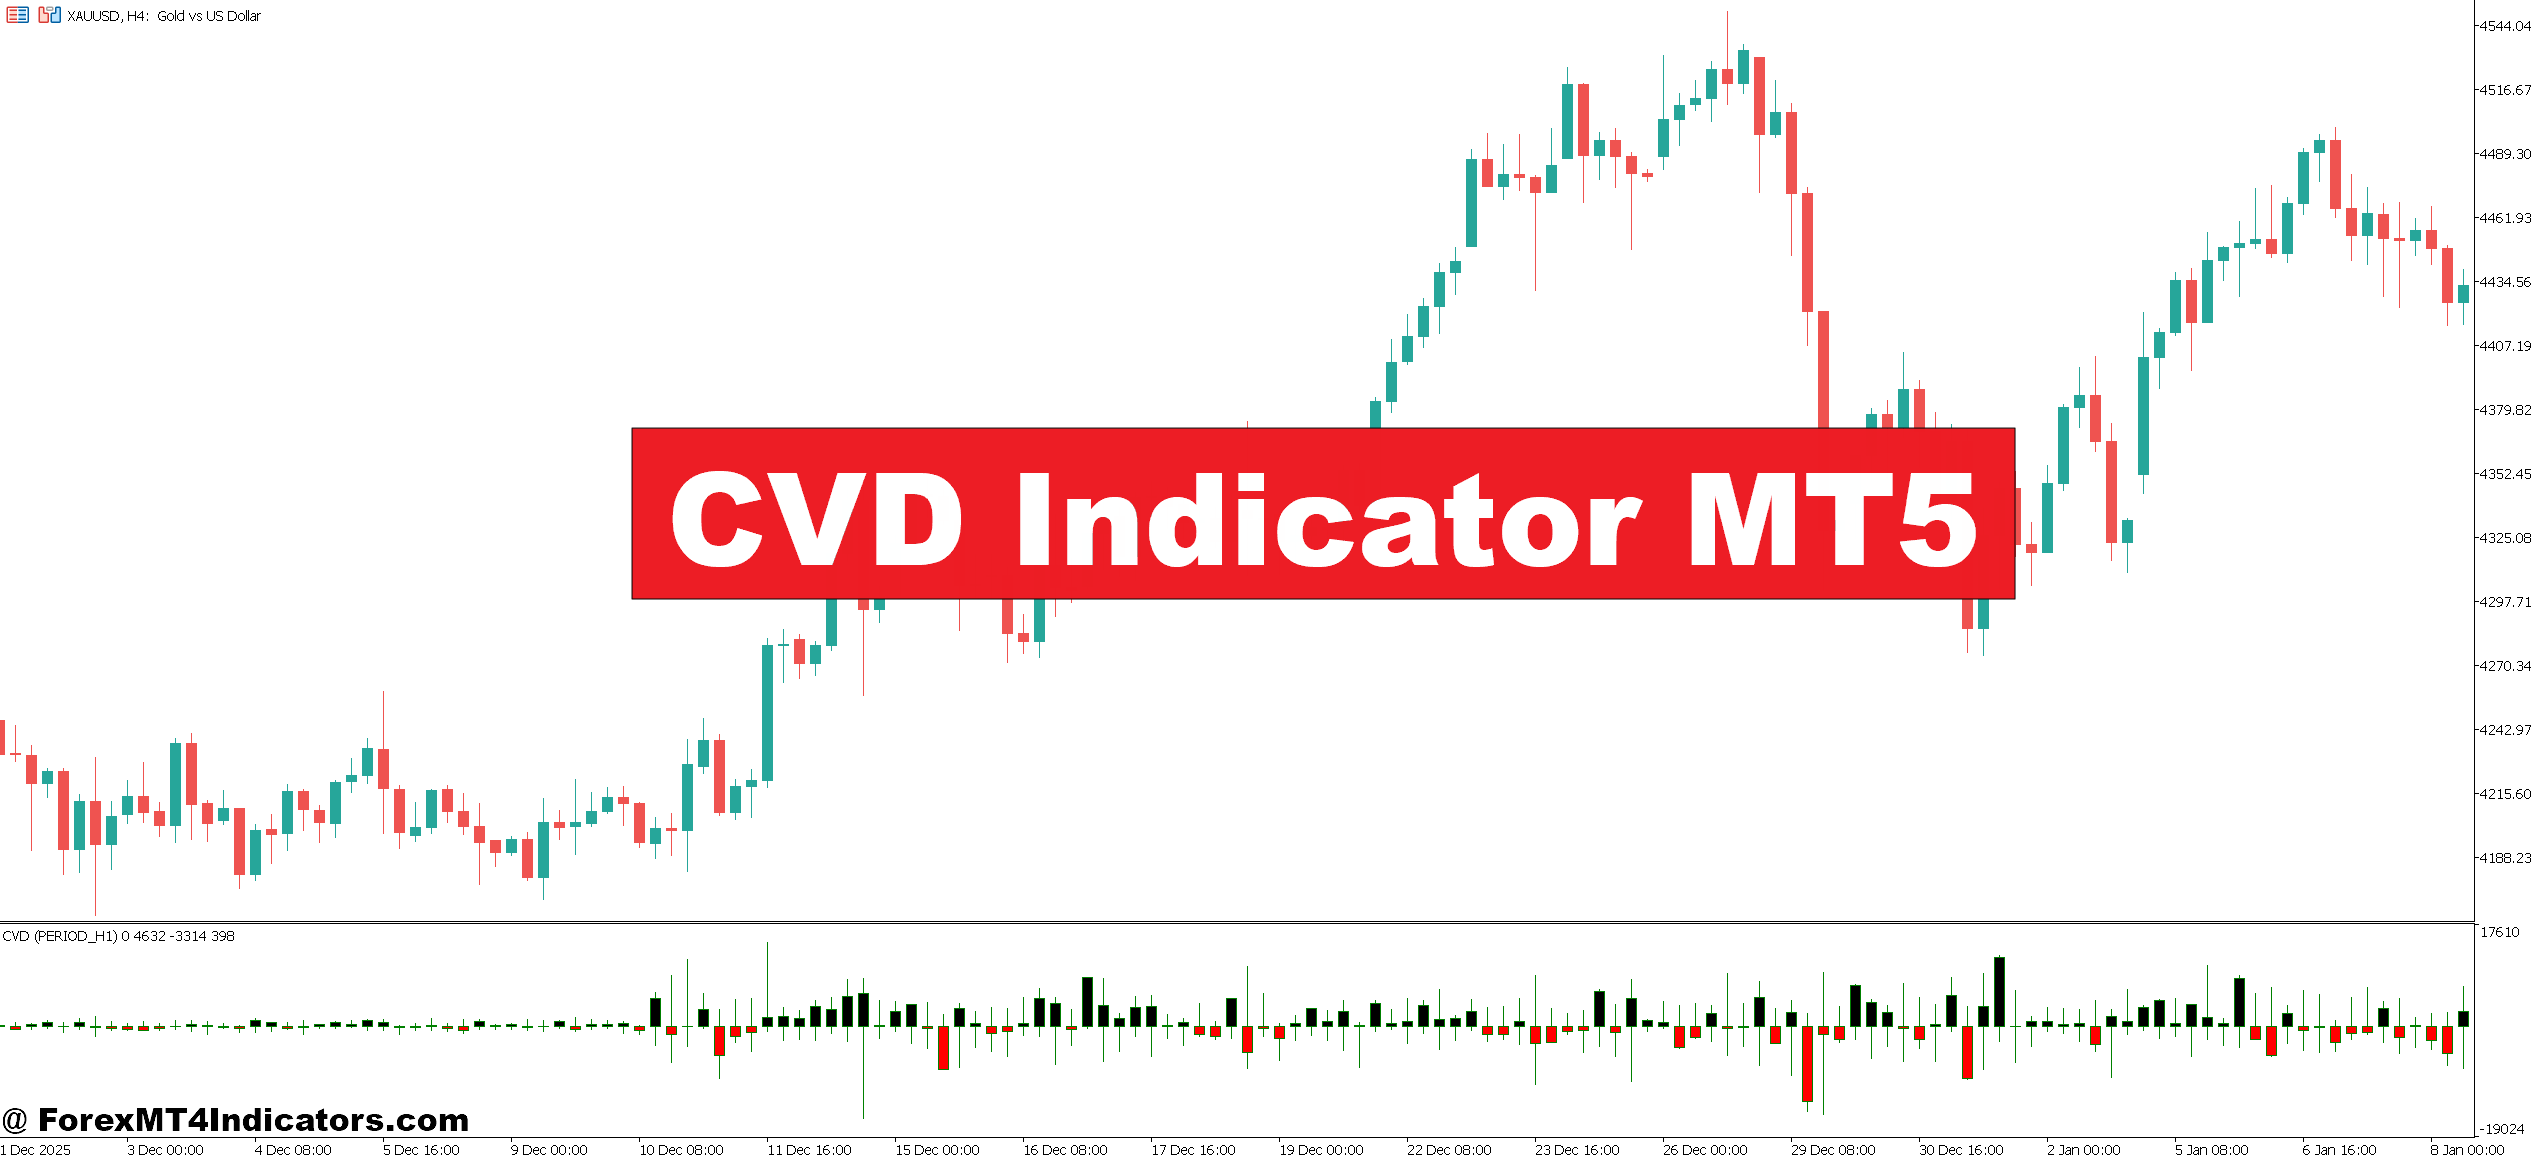
The Cumulative Volume Delta (CVD) Indicator is a technical analysis tool that measures the net difference between buying and selling volume over a set period. Unlike traditional volume indicators that only show total traded volume, CVD separates aggressive buying (market buys) from aggressive selling (market sells). The result is a line that tracks cumulative pressure in the market, providing insight into which side—buyers or sellers—is actually controlling price action.
For example, on GBP/JPY 30-minute charts during a breakout, a rising CVD line confirmed that buyers were genuinely pushing price higher, while the price itself occasionally retraced. Without the CVD, traders might mistake these pullbacks as reversals and exit trades prematurely.
How It Works
The calculation behind the CVD Indicator is straightforward but effective:
- Step 1: Identify each transaction as either a buyer-initiated or seller-initiated trade based on bid and ask data.
- Step 2: Calculate the delta: Volume of buy trades minus volume of sell trades.
- Step 3: Sum these deltas cumulatively to produce a single line that reflects net pressure.
For instance, if EUR/USD had 1,200 buy contracts and 800 sell contracts in a single minute, the delta would be +400. Adding this to the previous cumulative delta provides the updated CVD value. Traders can set the timeframe to 1-minute, 15-minute, or 1-hour bars depending on their strategy.
This method allows traders to see beyond mere price movement. A strong upward candle might occur even if selling pressure is increasing—a classic whipsaw scenario. The CVD line reveals these hidden dynamics, improving timing and reducing false signals.
Practical Application in Trading
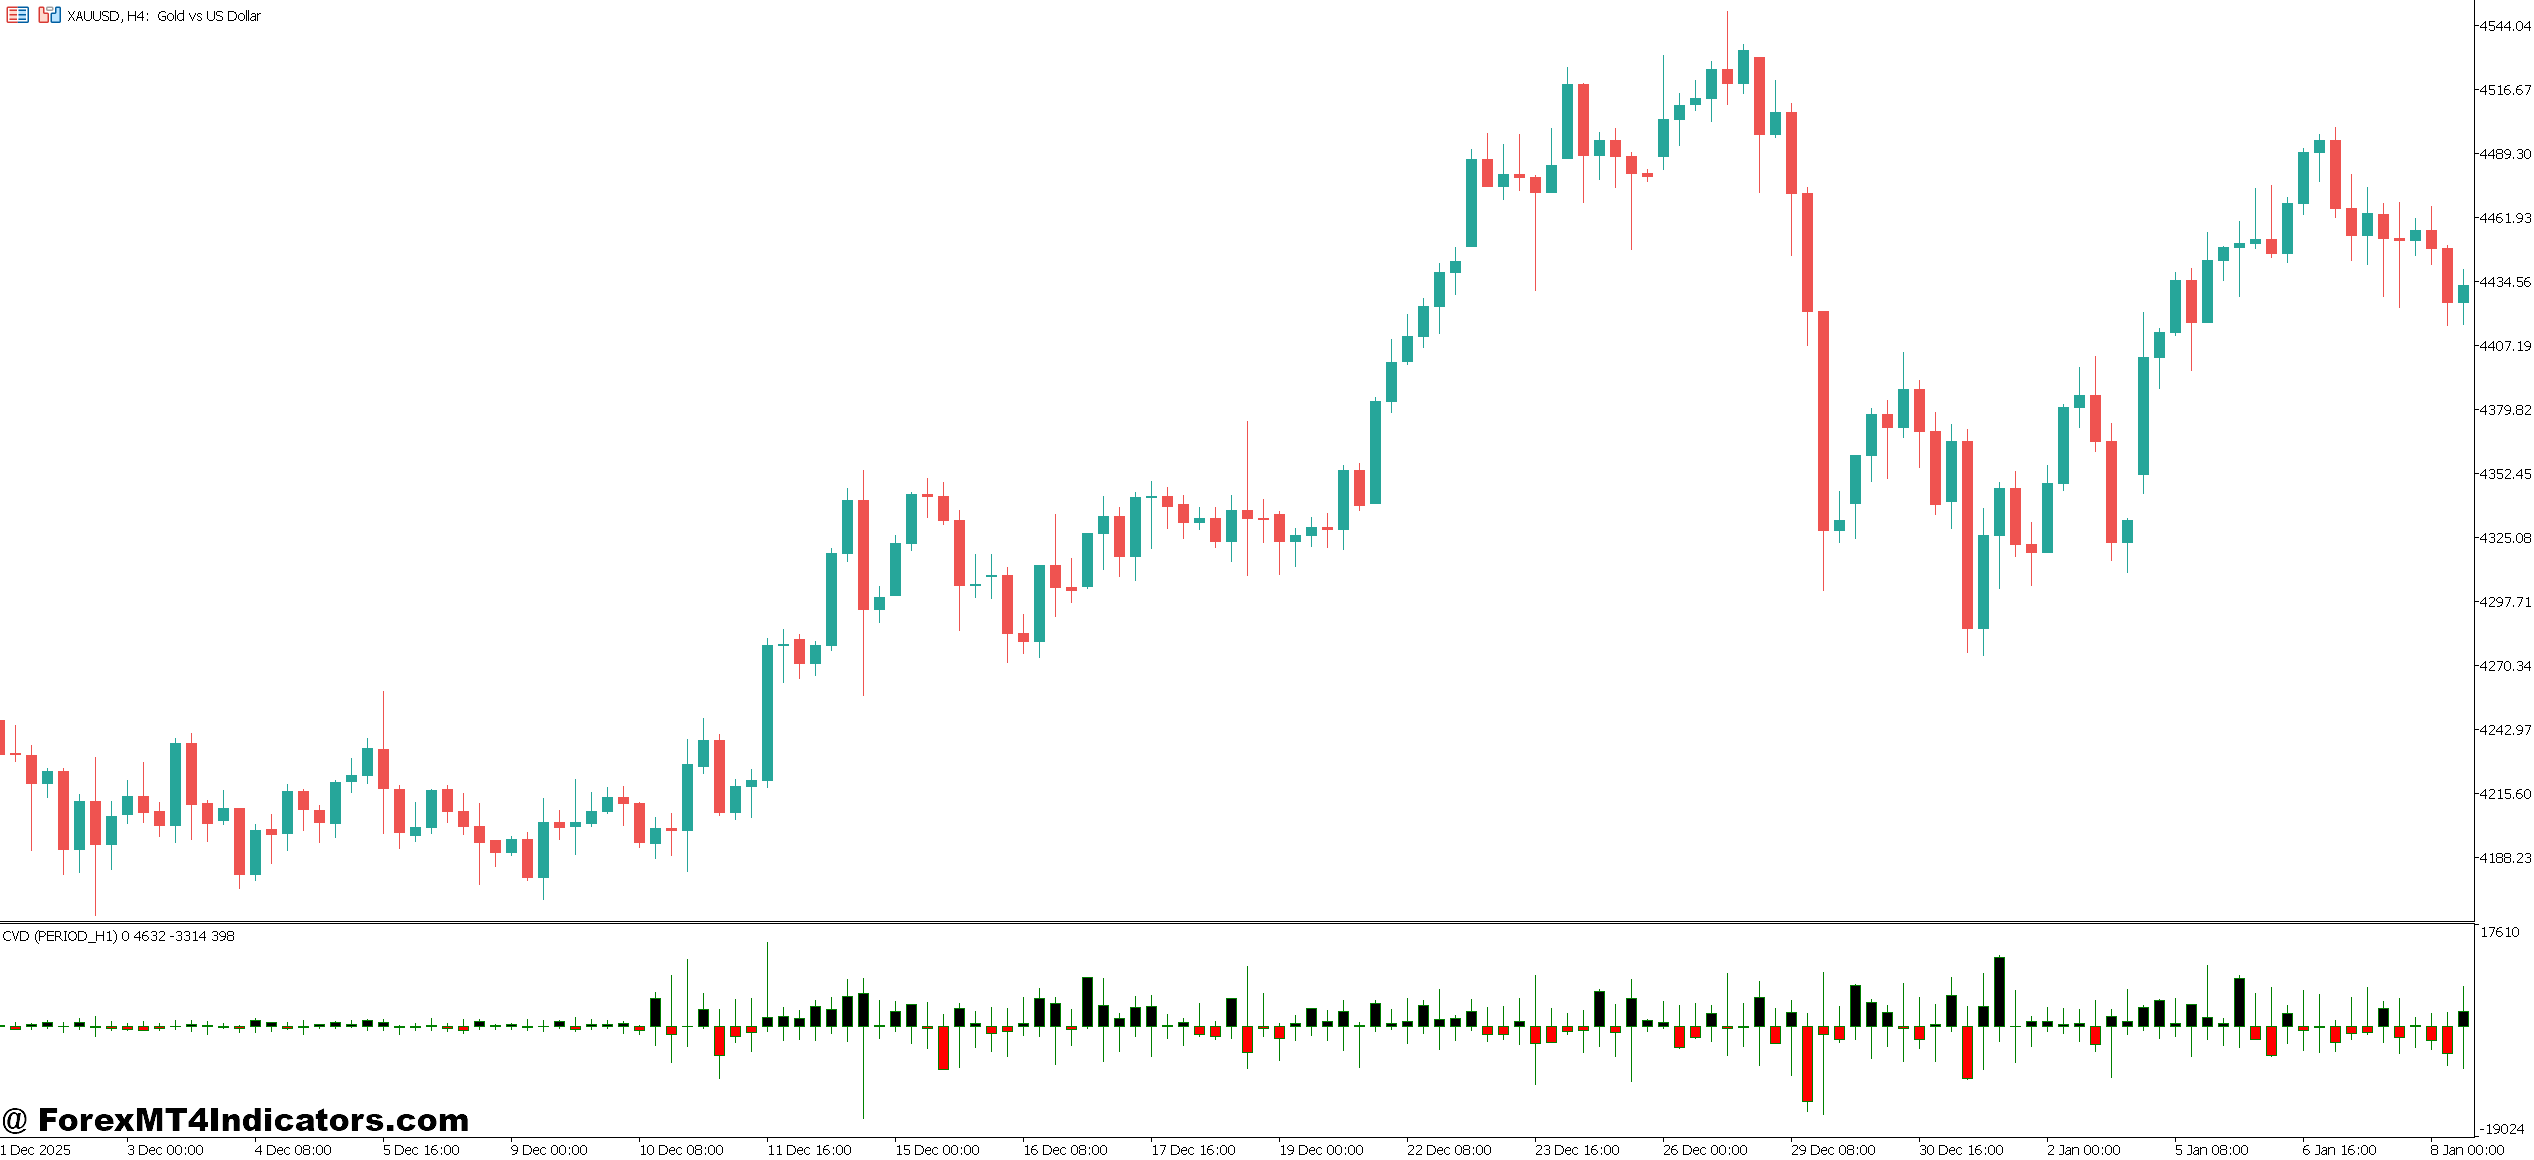
The real power of the CVD Indicator is in its application alongside price action and market structure. Here’s how traders use it:
- Confirm Breakouts: On USD/CHF 15-minute charts, a breakout above resistance with a rising CVD line suggests buyers are genuinely in control. Conversely, a flat or falling CVD may warn of a fake-out.
- Spot Divergences: If EUR/GBP price makes a new high but the CVD line fails to follow, it signals weakening buying pressure, hinting at a potential reversal.
- Volume-Based Entries: Traders sometimes enter positions when the CVD line crosses zero from negative to positive, indicating a shift from net selling to net buying.
- Trend Strength Assessment: During trending markets, the CVD line steepness correlates with trend momentum, helping traders decide whether to hold positions or scale out.
Testing on volatile NFP days showed that CVD could prevent premature exits. For example, on the 1-hour EUR/USD chart, price retraced sharply after the initial spike, but the CVD line’s consistent upward slope confirmed the bullish trend, allowing the trader to stay in the trade.
CVD Indicator MT5 Settings and Customization
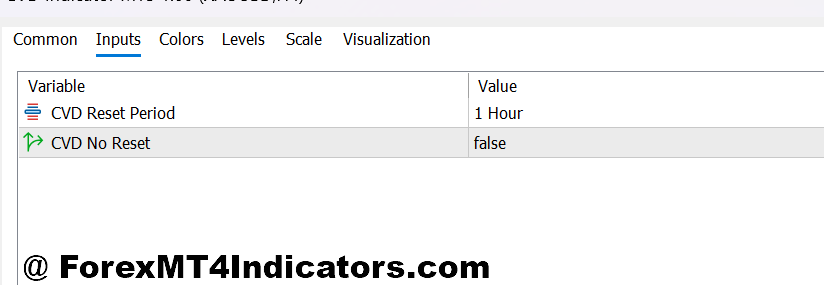
The CVD Indicator MT5 offers flexibility to suit different trading styles:
- Timeframe Selection: Short-term scalpers might use 1- or 5-minute charts, while swing traders prefer 1-hour or daily charts.
- Volume Source: Traders can choose tick volume or actual contract volume depending on available data.
- Smoothing: Some traders apply moving averages to the CVD line to reduce noise, particularly in volatile markets.
- Alerts: Setting alerts for zero-crossings or divergence points can help traders react quickly to changing pressure.
Adjusting these settings helps traders optimize the indicator for their specific currency pairs. For instance, the CVD behaves differently on highly liquid pairs like EUR/USD versus thinner pairs like USD/TRY, requiring sensitivity adjustments.
Advantages vs Limitations
The CVD Indicator offers several benefits:
- Advantages: Provides clarity on market pressure, helps confirm trends, reveals hidden divergences, improves trade timing.
- Limitations: Relies on accurate volume data, can produce false signals in extremely low-liquidity markets, does not guarantee profits, should be used in conjunction with other analysis methods.
For example, on GBP/USD during an Asian session, low liquidity caused the CVD line to fluctuate sharply without meaningful price confirmation. Recognizing this limitation prevents misinterpretation.
Comparison with Similar Indicators
Compared to traditional volume indicators, the CVD line gives directional insight rather than just magnitude. While tools like the On-Balance Volume (OBV) also accumulate volume, CVD separates buyer and seller activity explicitly, offering a more precise read of market dominance.
Relative Strength Index (RSI) and Moving Average Convergence Divergence (MACD) measure momentum based on price, not volume. Using CVD alongside these indicators can provide a more complete picture, confirming whether price moves are supported by real market pressure or merely temporary spikes.
How to Trade with CVD Indicator MT5
Buy Entry
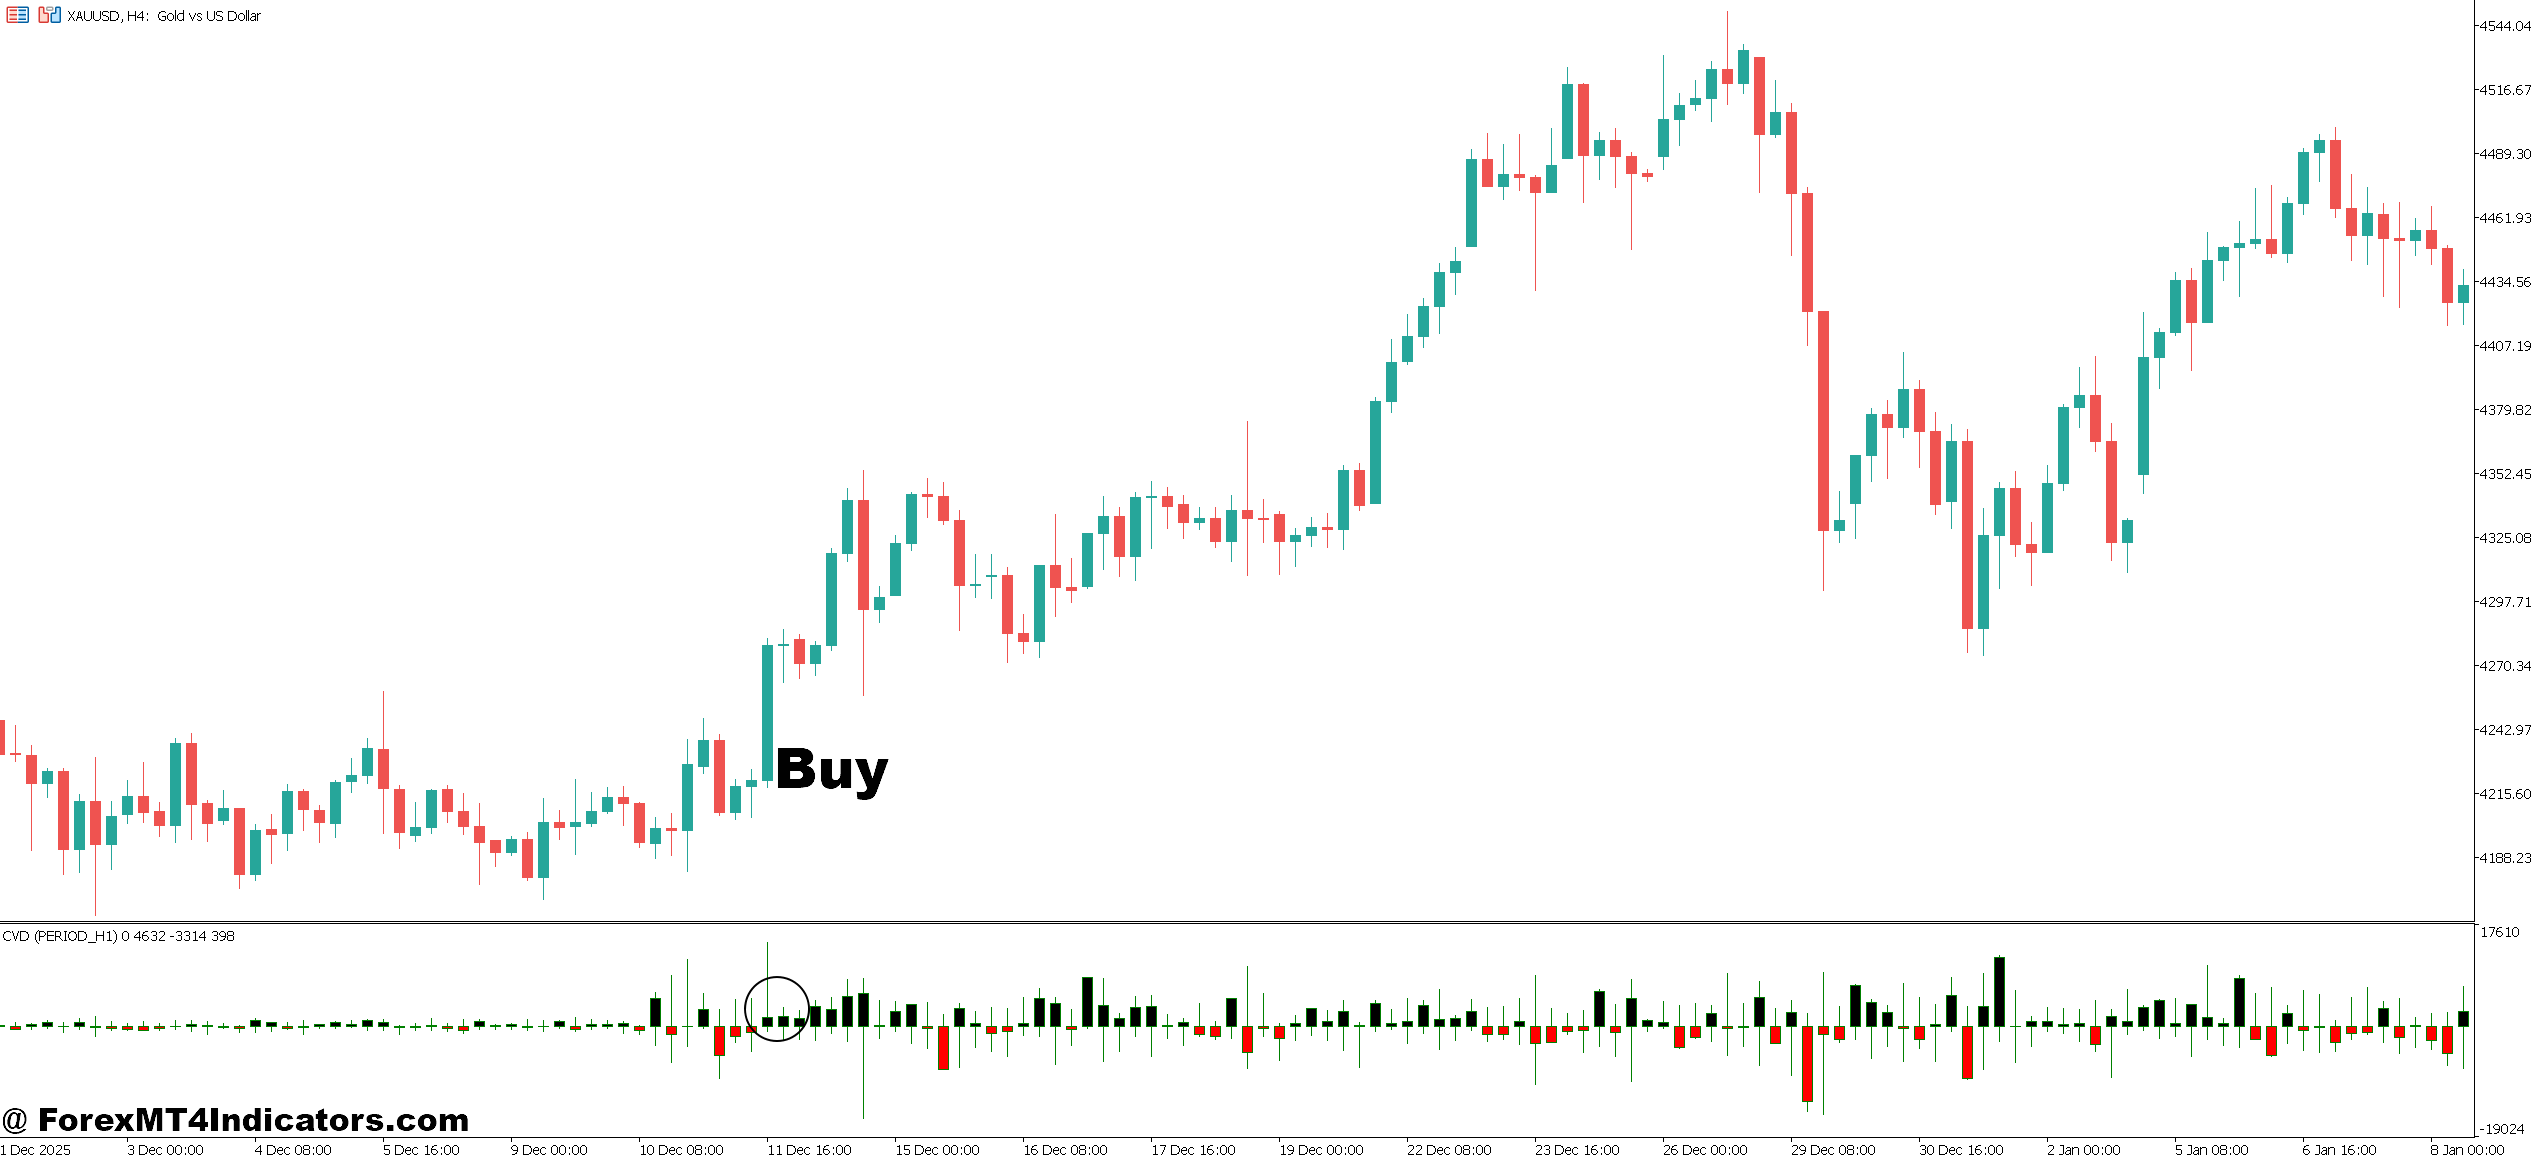
- CVD Line Crosses Zero Upwards – Enter when the CVD line moves from negative to positive, signaling net buying pressure. Best on EUR/USD 1-hour chart. Avoid trades during major news spikes.
- Price Breaks Resistance with Rising CVD – If GBP/USD 4-hour closes above 1.2850 and CVD is sharply rising, it confirms buyers are in control. Skip if CVD is flat or declining.
- Divergence Confirmation – Enter when price makes a new low but CVD forms a higher low (bullish divergence), e.g., USD/JPY 1-hour chart. Use tight stop-loss within 20–25 pips.
- CVD Momentum Spike – When CVD rises more than 5% within one hour, look for momentum entries on EUR/USD 15-minute chart. Avoid in illiquid sessions.
- Trend Pullback Entry – Enter on minor retracement to support while CVD maintains upward slope on GBP/USD daily chart. Stop-loss near previous swing low.
- CVD Supports Breakout Candle – Enter when a bullish candle closes above resistance and CVD confirms upward pressure. Example: EUR/USD 1-hour, breakout of 1.1020.
- Volume-Backed Reversal – After a small pullback, price resumes upward and CVD rises sharply. Confirm with 50 EMA on 4-hour chart. Avoid during low volume periods.
Sell Entry
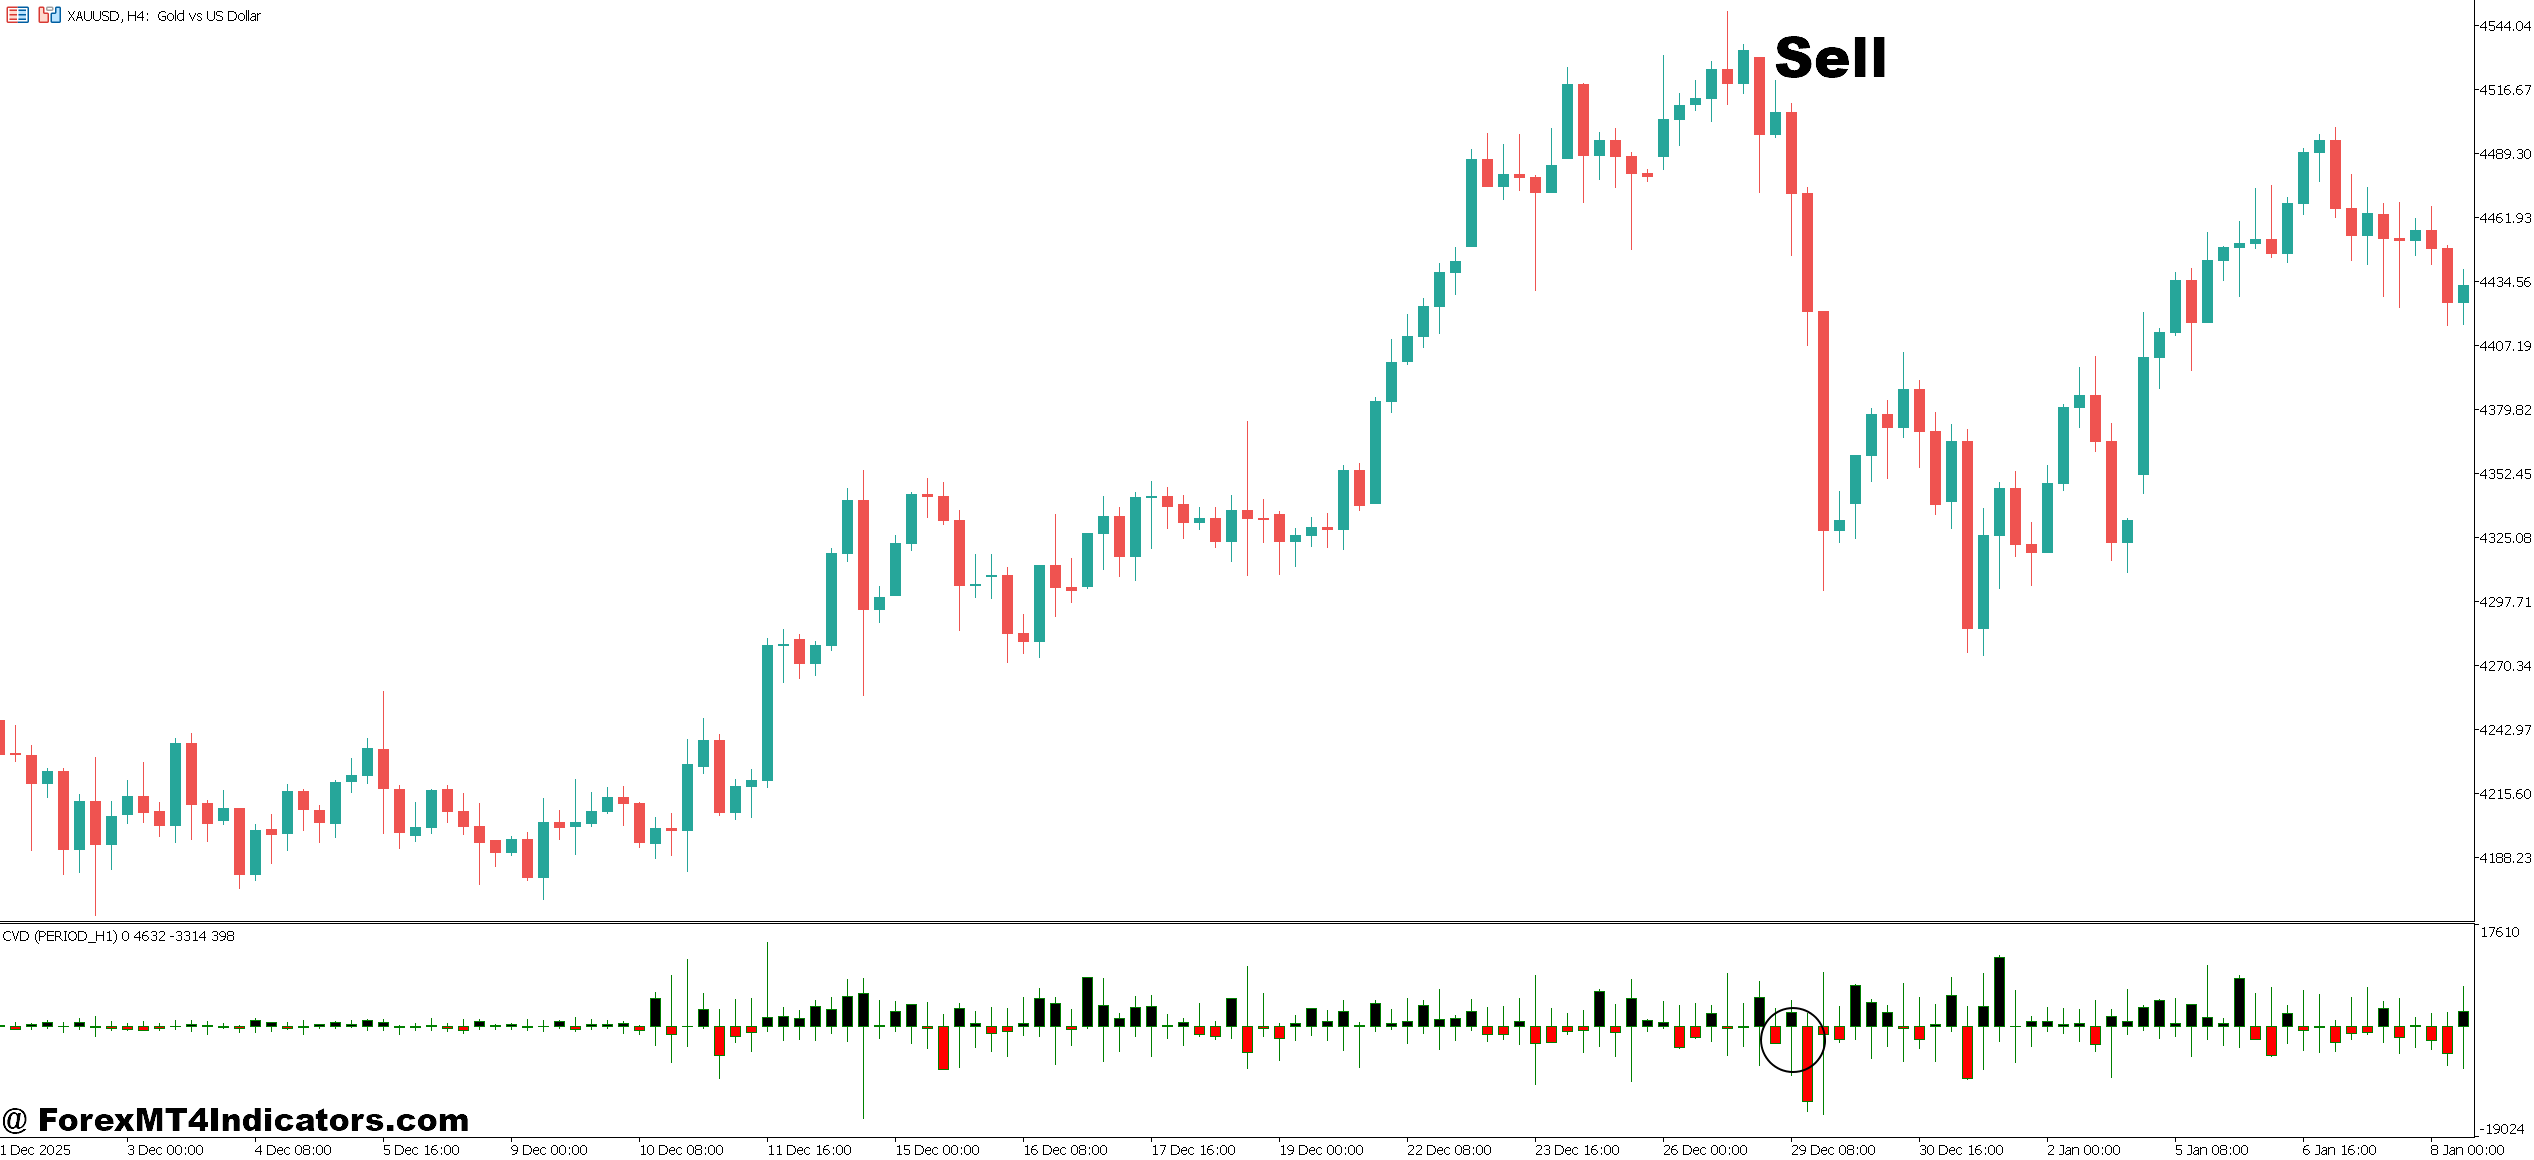
- CVD Line Crosses Zero Downwards – Enter when the CVD line moves from positive to negative, signaling net selling pressure, e.g., EUR/USD 1-hour. Avoid trades during sudden liquidity drops.
- Price Breaks Support with Falling CVD – GBP/USD 4-hour closes below 1.2780 and CVD sharply drops, confirming sellers. Skip if CVD is sideways.
- Bearish Divergence – Price makes a new high but CVD forms lower high (bearish divergence) on USD/JPY 1-hour chart. Set stop-loss 15–20 pips above last swing high.
- CVD Momentum Drop – When CVD falls more than 5% in one hour, short entries are favored on EUR/USD 15-minute chart. Avoid during overlapping news events.
- Trend Pullback Short – Enter on minor retracement to resistance while CVD slope remains downward, e.g., GBP/USD daily chart. Stop-loss above recent swing high.
- CVD Confirms Bearish Candle – Enter when a bearish candle closes below support with CVD showing downward pressure, e.g., EUR/USD 1-hour, below 1.0980.
- Volume-Backed Reversal – Price rises slightly, then resumes down with a sharp CVD drop; confirm with 50 EMA trend on 4-hour chart. Avoid low liquidity sessions.
Conclusion
Traders seeking to understand market pressure more accurately can benefit from integrating the CVD Indicator MT5 into their strategies. Key takeaways include:
- The CVD line distinguishes between buying and selling pressure, revealing hidden market dynamics.
- Divergences between price and CVD can signal potential reversals, improving trade timing.
- Proper settings tailored to timeframe and pair liquidity enhance reliability.
- Despite its utility, the indicator is not foolproof; it should complement other tools and sound risk management.
That said, trading forex carries substantial risk. No indicator guarantees profits, and thoughtful analysis remains essential. By combining the CVD Indicator with price action and trend analysis, traders can gain a clearer edge and make more informed decisions in their day-to-day trading.
Level up your trading Learn to read the chart — not just the indicator eBook · Instant PDF Video Course · 12 modules Trading forex and CFDs carries a significant risk of loss and is not suitable for everyone. Broker links are affiliate links — we may earn a commission at no cost to you.Recommended MT4/MT5 Brokers
Free MT4 Indicator Download

Enter Your Email Address below, download link will be sent to you.