

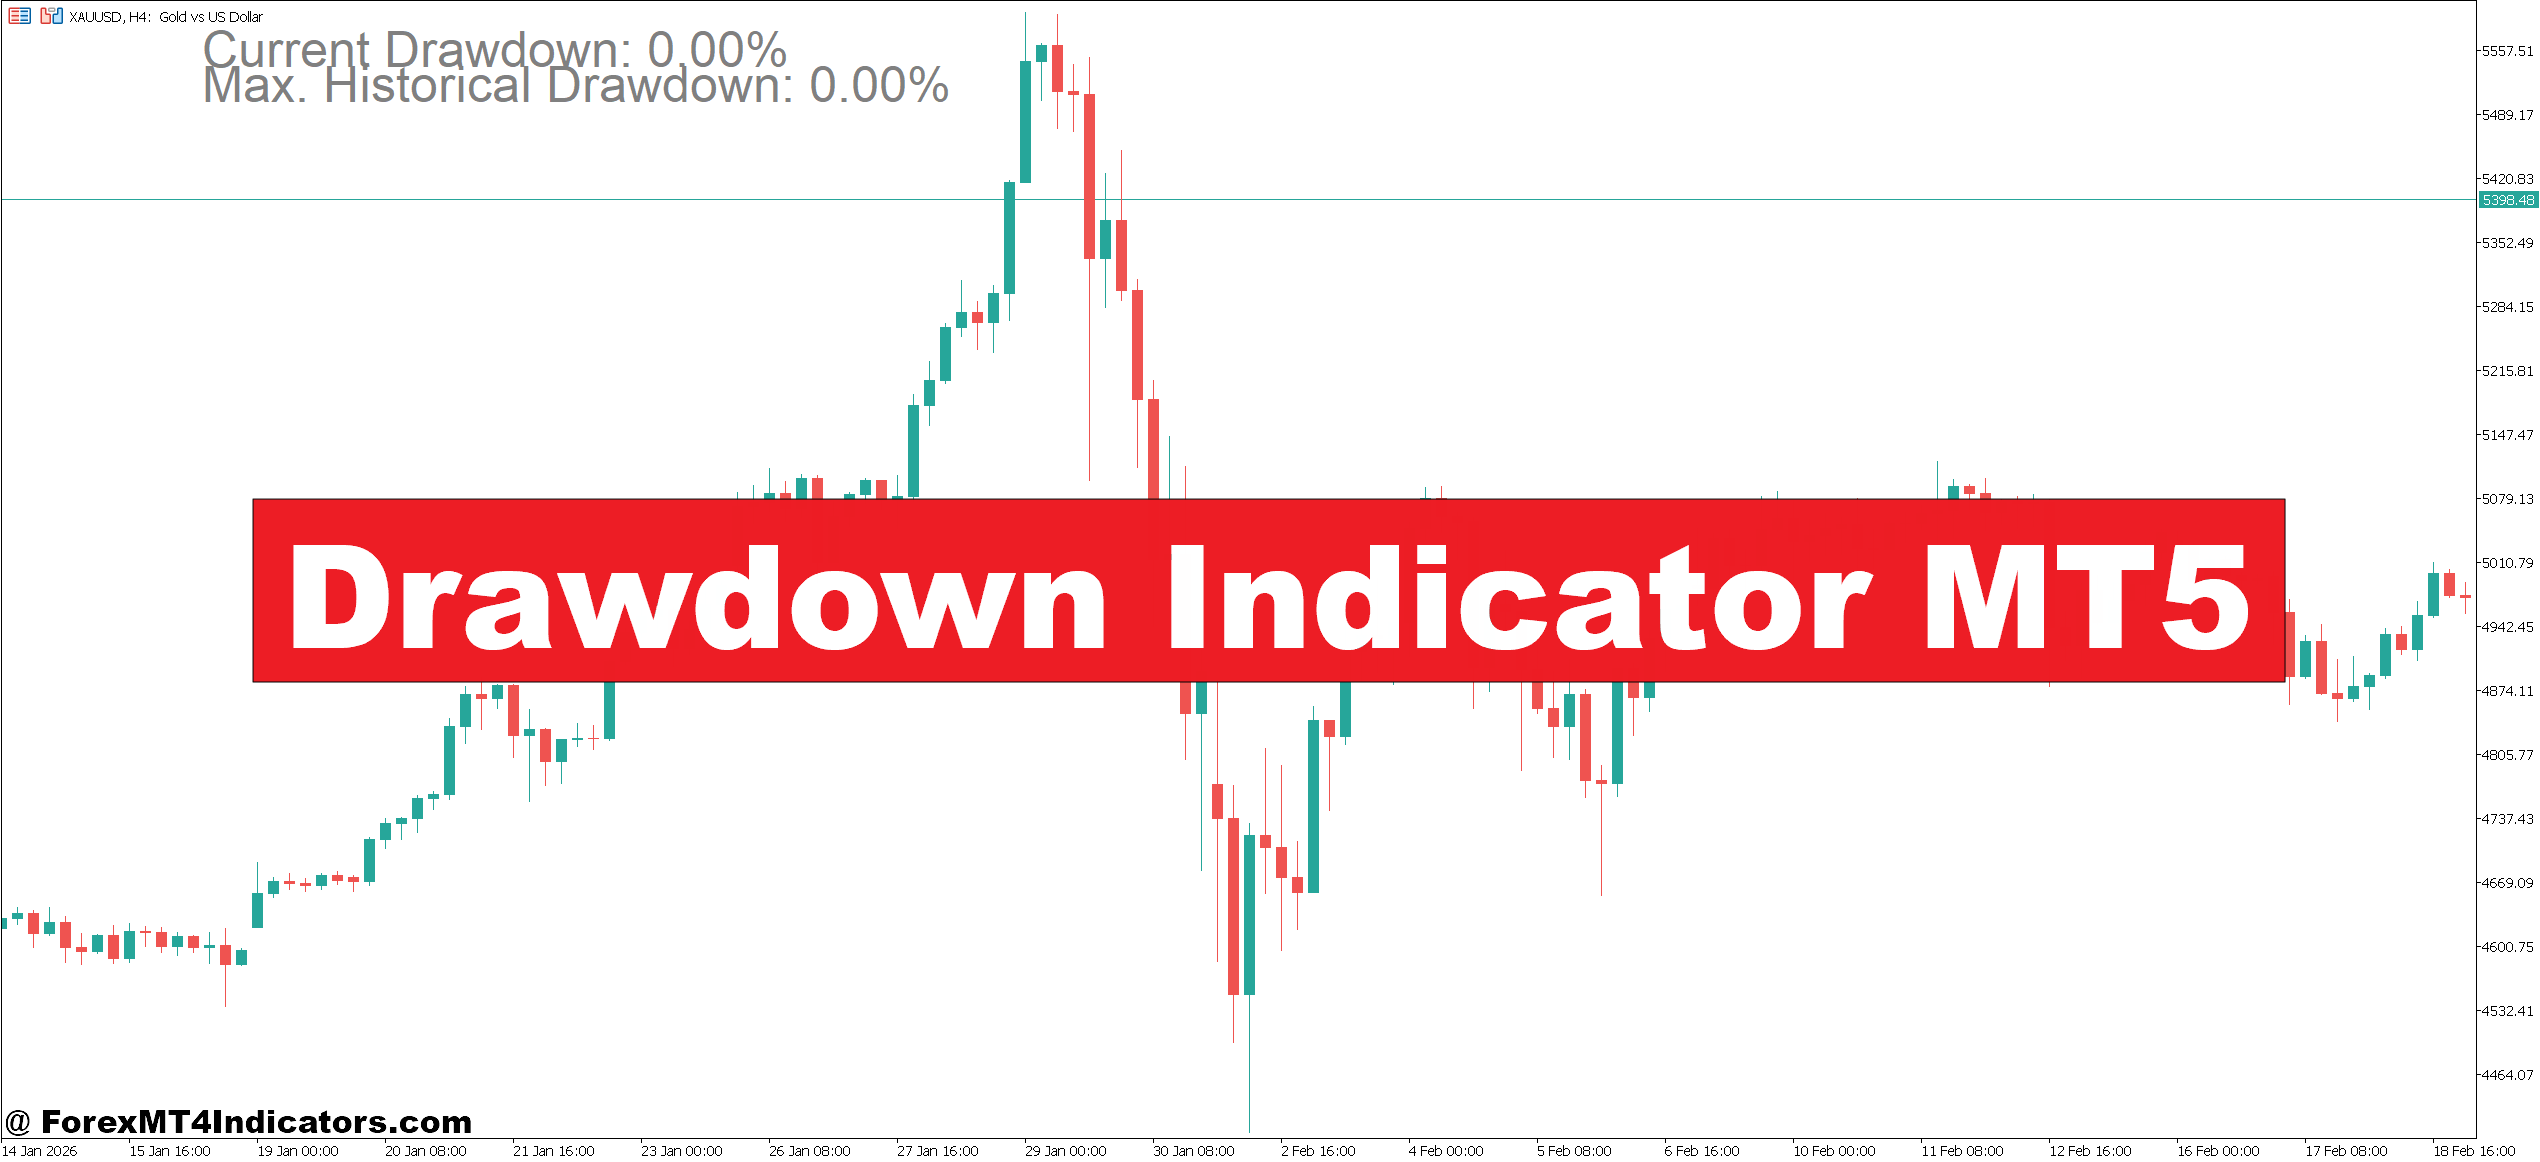
The Drawdown Indicator MT5 helps traders visualize and measure account decline directly on the MetaTrader 5 platform. Instead of guessing risk exposure, traders can clearly see peak-to-valley losses and adjust their strategy accordingly. Understanding drawdown changes how traders manage risk, position sizing, and expectations — and that’s exactly what this guide explores next.
What Is the Drawdown Indicator MT5?
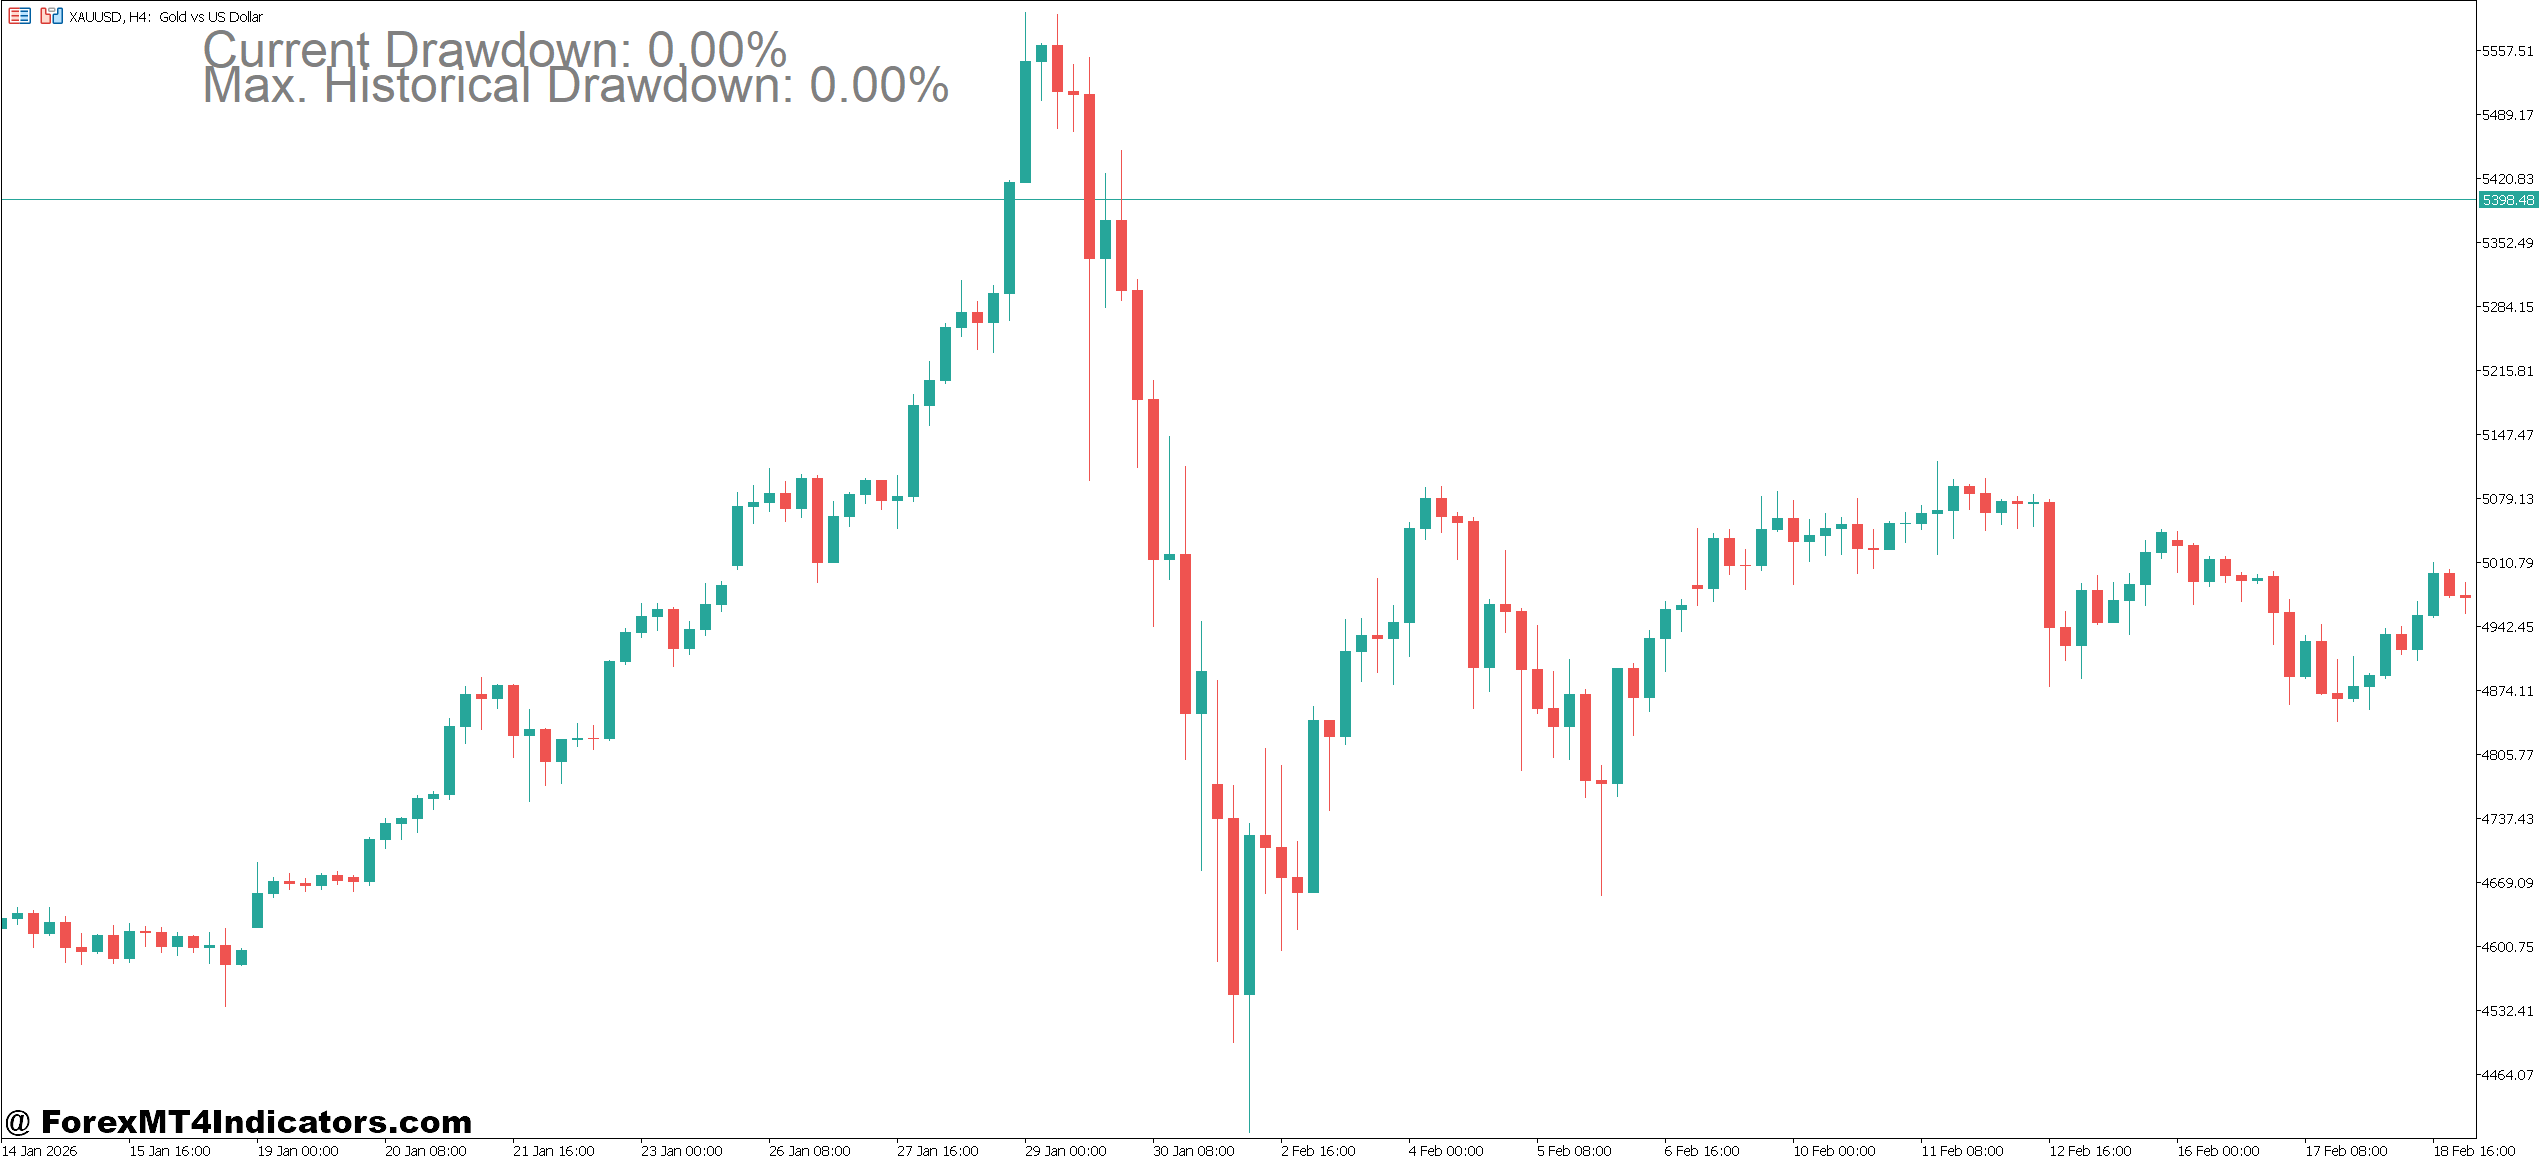
The Drawdown Indicator MT5 is a risk-analysis tool designed to track how much an account or strategy declines from its highest equity point before recovering. Unlike trend indicators or oscillators that analyze price movement, this tool focuses on trading performance and capital preservation.
In simple terms, drawdown measures the difference between the highest account equity and the lowest point reached during a losing period. For example:
- Account peak: $10,000
- Lowest equity during losses: $9,200
- Drawdown: 8%
This information matters more than many traders realize. A strategy showing strong profits but experiencing 40% drawdowns may be far riskier than a slower system with steady 10% declines.
On MT5 charts, the indicator typically displays:
- Current drawdown percentage
- Maximum historical drawdown
- Equity curve visualization
- Balance vs equity comparison
Traders often pair it with performance evaluation rather than entry signals. It answers a critical question: How much pain does this strategy create before profits arrive?
How the Indicator Works (Calculation Logic)
The logic behind the Drawdown Indicator MT5 is mathematical rather than predictive. It continuously monitors account equity and calculates declines relative to the highest recorded value.
Core Calculation
The basic formula used:
Drawdown (%) = (Peak Equity − Current Equity) ÷ Peak Equity × 100
Here’s how it works step by step:
- The indicator records the highest equity achieved.
- Every tick update compares current equity to that peak.
- If equity drops, drawdown increases.
- When a new equity high forms, drawdown resets.
Because MT5 calculates equity in real time, floating losses are included. This makes the tool especially useful during open trades, not just after closing positions.
Real Trading Example
Consider EUR/USD on the 1-hour chart during a volatile London session:
- Trader opens three buy positions following a trend breakout.
- Equity rises from $5,000 to $5,450.
- A sudden pullback creates floating losses, reducing equity to $5,150.
The indicator records a drawdown of roughly 5.5%. Even if trades later recover, the trader now understands the temporary risk exposure required by that setup.
Experienced traders often analyze this during backtesting. When testing strategies on high-impact NFP days, drawdown spikes frequently reveal hidden weaknesses that profit curves alone don’t show.
Practical Applications in Real Trading
The Drawdown Indicator MT5 isn’t about predicting price direction. Its value comes from improving decision-making and risk control.
1. Strategy Validation
A strategy may show consistent gains on GBP/JPY but still produce deep equity drops. If maximum drawdown exceeds personal risk tolerance — say 25% — traders know adjustments are needed before going live.
Many professionals aim to keep drawdown below half of annual expected return. For instance, a system targeting 20% yearly growth should ideally stay under 10–12% drawdown.
2. Position Size Control
Here’s a common situation:
A trader risks 2% per trade on EUR/USD using a breakout system. After tracking results with the indicator, they notice drawdown repeatedly reaches 18%. Reducing risk per trade to 1% lowers drawdown to 9%, while profitability remains stable.
That’s a practical improvement without changing strategy logic.
3. Avoiding Emotional Trading
Watching equity decline without context causes panic. But when traders expect a historical 8–10% drawdown range, temporary losses feel normal instead of alarming.
This helps prevent revenge trading — a major account killer during choppy market conditions.
Drawdown Indicator MT5 Settings and Customization
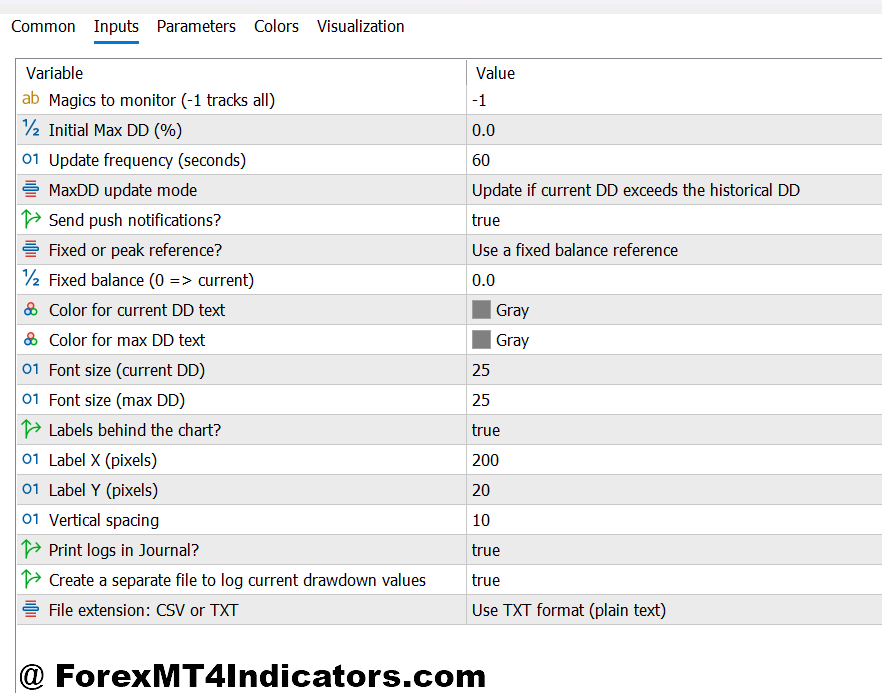
Most versions of the Drawdown Indicator MT5 allow several adjustable parameters. Proper configuration makes a noticeable difference.
Common Settings
Calculation Mode
- Balance-based (closed trades only)
- Equity-based (includes floating losses)
Equity mode is generally preferred for active traders because it reflects real-time exposure.
Lookback Period
- Short periods highlight recent performance
- Full-history mode shows long-term risk profile
Swing traders often use full-history tracking, while scalpers may analyze weekly or monthly drawdown cycles.
Display Options
- Percentage vs monetary drawdown
- Equity curve overlay
- Alert levels
Setting alerts at predefined levels — for example 10% drawdown — helps traders pause trading before losses escalate.
Timeframe Considerations
The indicator itself isn’t timeframe-dependent, but trading style matters:
- Scalping on M5 charts often produces frequent small drawdowns.
- H4 or Daily strategies may show fewer but deeper equity swings.
Understanding this difference prevents misinterpreting normal strategy behavior as failure.
Advantages, Limitations, and Comparison
Advantages
- Improves risk awareness and capital protection
- Helps optimize position sizing
- Provides objective performance metrics
- Works alongside any trading system or market
Many traders discover their real weakness isn’t entries — it’s tolerating excessive drawdown.
Limitations
The indicator doesn’t generate buy or sell signals. Traders expecting entry guidance may misuse it. Also, historical drawdown doesn’t guarantee future risk levels. Market volatility changes, especially during news events or shifting liquidity conditions.
And sometimes a strategy with low drawdown grows too slowly for certain trading goals. Balance is key.
Comparison With Similar Tools
Compared to built-in MT5 account history statistics, the Drawdown Indicator MT5 offers real-time visualization directly on charts. This makes it easier to connect equity behavior with market structure.
Versus equity curve indicators, drawdown tools focus specifically on loss depth rather than profit progression. Many traders combine both for a clearer performance picture.
When used alongside indicators like moving averages or RSI, it adds a missing layer — risk measurement instead of signal generation.
Risk Considerations and Best Practices
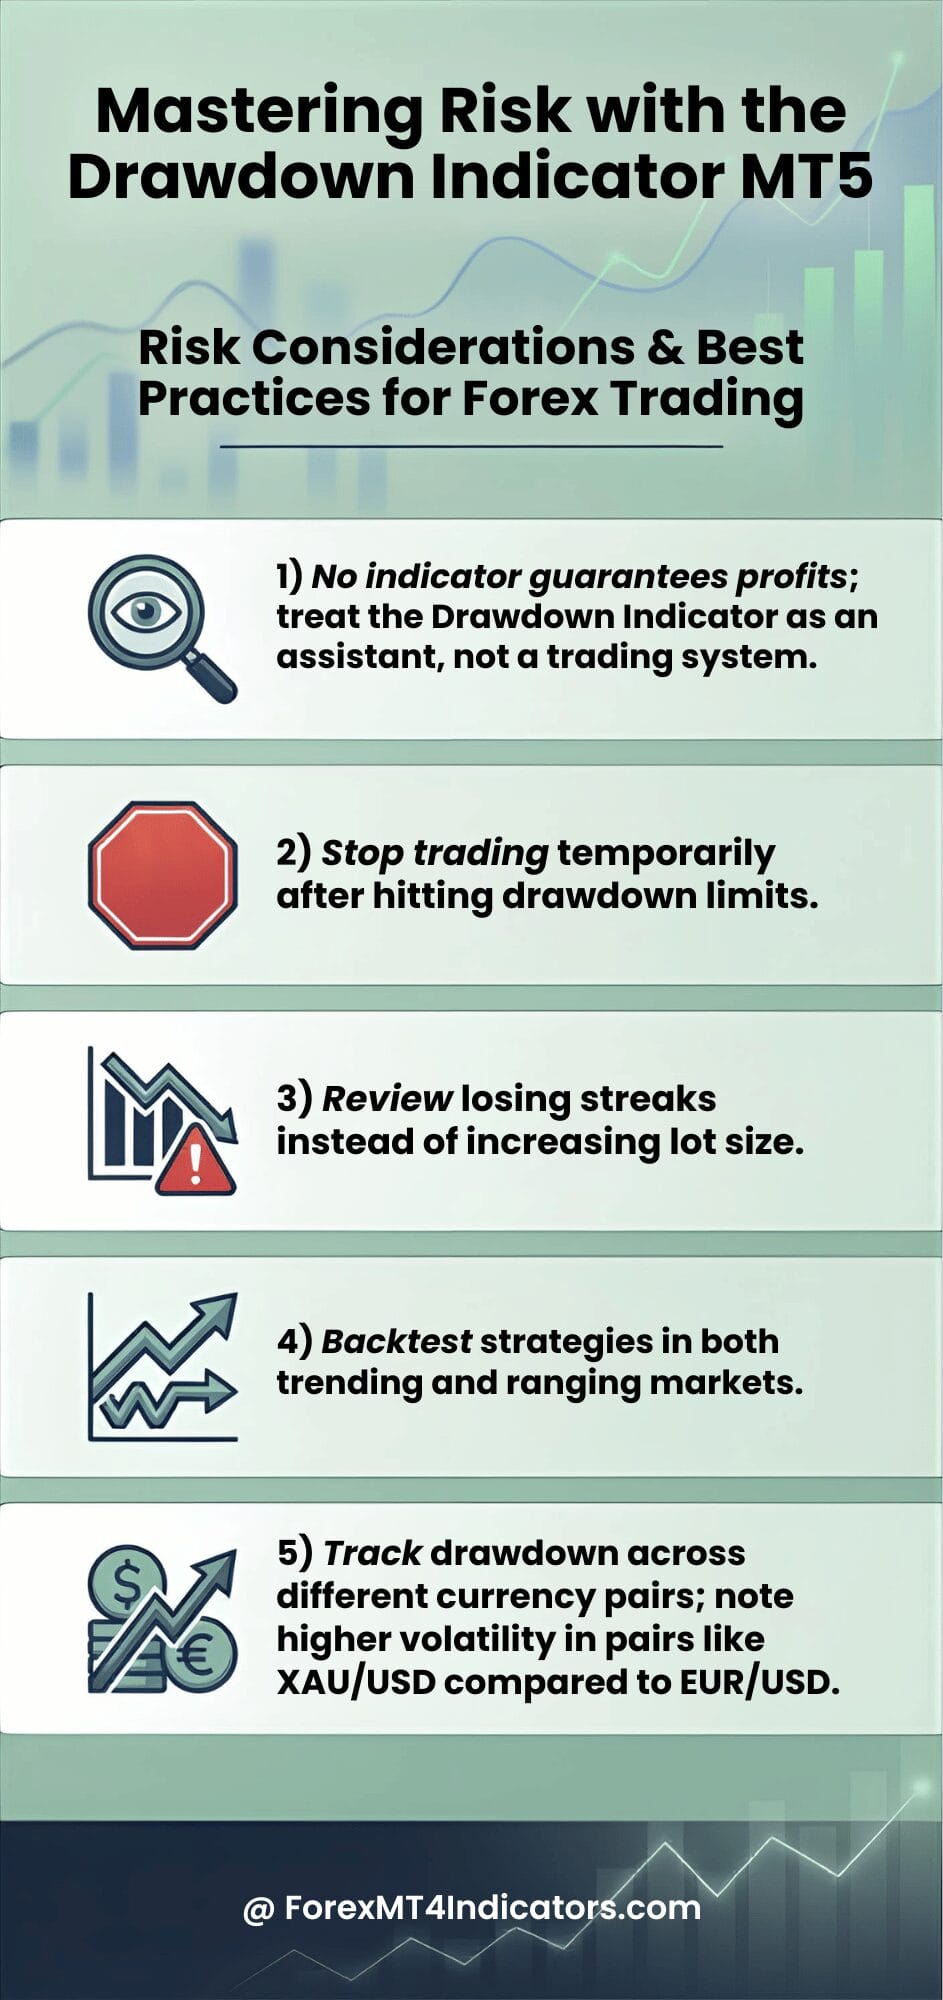
Trading forex carries substantial risk. No indicator guarantees profits. The Drawdown Indicator MT5 should be treated as a risk-management assistant, not a trading system.
Experienced traders often follow simple guidelines:
- Stop trading temporarily after hitting predefined drawdown limits.
- Review losing streaks instead of increasing lot size.
- Backtest strategies across trending and ranging markets.
One useful habit is tracking drawdown across different pairs. A system may behave safely on EUR/USD but show aggressive equity swings on XAU/USD due to higher volatility.
Conclusion
The Drawdown Indicator MT5 shifts a trader’s focus from chasing profits to protecting capital — a mindset shared by long-term survivors in forex trading. It highlights how strategies behave during losing periods, which is often overlooked when evaluating performance.
Key takeaways include: traders gain clear visibility into equity decline, position sizing becomes easier to optimize, emotional reactions decrease when losses fall within expected ranges, and strategy evaluation becomes more realistic. Rather than acting as a signal tool, it works as a decision-support system that strengthens risk control.
Used correctly, the Drawdown Indicator MT5 helps traders understand the true cost of their strategy. The next step isn’t just installing the indicator — it’s defining how much drawdown is personally acceptable and building a trading plan around that number.
Level up your trading Learn to read the chart — not just the indicator eBook · Instant PDF Video Course · 12 modules Trading forex and CFDs carries a significant risk of loss and is not suitable for everyone. Broker links are affiliate links — we may earn a commission at no cost to you.Recommended MT4/MT5 Brokers
Free MT4 Indicator Download

Enter Your Email Address below, download link will be sent to you.