

Last updated:
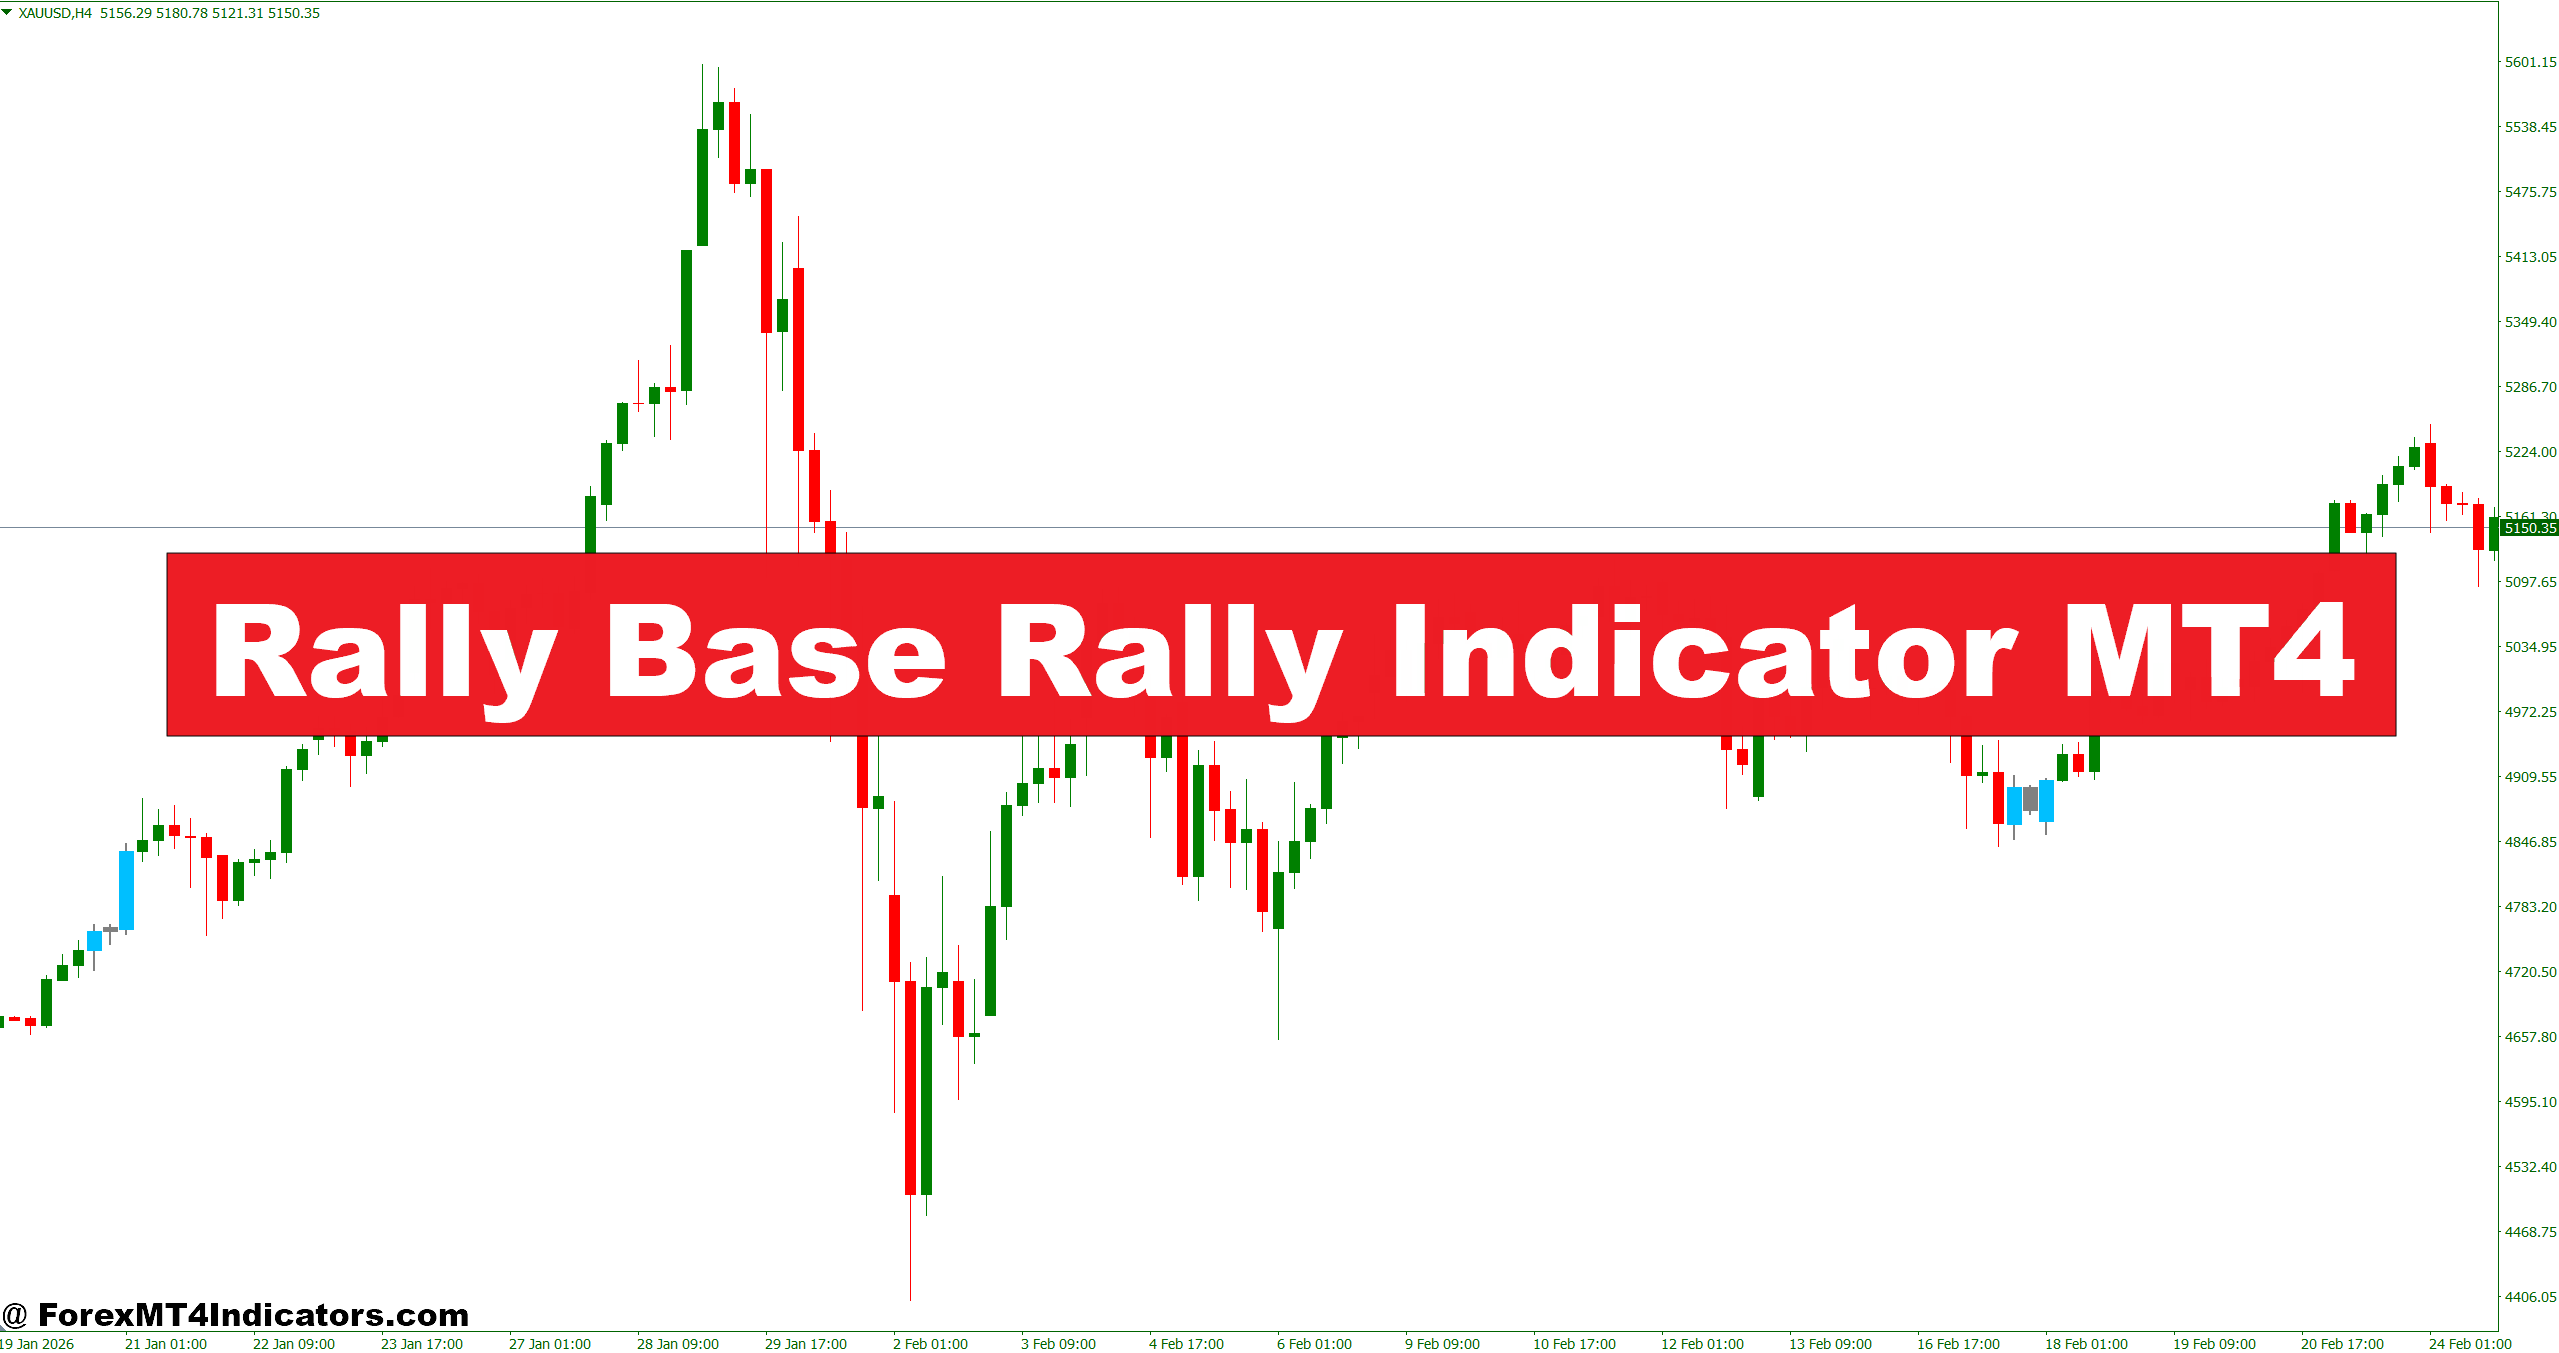
The Rally Base Rally Indicator MT4 is a technical analysis tool designed for the MetaTrader 4 platform. It automatically detects RBR formations on the chart. An RBR pattern typically forms when price rallies strongly, pauses in a tight consolidation range (the base), and then continues upward with another impulsive move.
This pattern often reflects institutional buying. Large players build positions during the base phase. Once orders are filled, price pushes higher again. Traders who recognize this structure early can position themselves near the base, aiming to ride the next leg up.
Unlike a simple moving average or oscillator, this indicator focuses purely on price structure. It highlights consolidation zones between two bullish impulses. That makes it especially useful for trend continuation strategies.
How the Indicator Works
At its core, the Rally Base Rally Indicator MT4 scans historical price data for three elements:
- Initial rally: A strong bullish move with consecutive bullish candles and above-average range.
- Base formation: A tight consolidation with small-bodied candles and overlapping wicks.
- Second rally: A breakout above the base high with momentum.
The indicator measures candle size and volatility, often using Average True Range (ATR) logic internally to distinguish impulsive moves from minor fluctuations. If the initial rally exceeds a certain threshold—say 1.5 times the recent average candle range—it qualifies as the first leg.
Then it checks the base. If the consolidation remains within a narrow band (for example, 10–20 pips on EUR/USD 1-hour chart) and lasts 3 to 8 candles, the pattern becomes valid. Once price closes above the base high, the indicator confirms the RBR structure and may mark the zone visually.
In practice, this helps traders avoid entering during random sideways movement. They wait for a defined structure instead.
Practical Trading Application
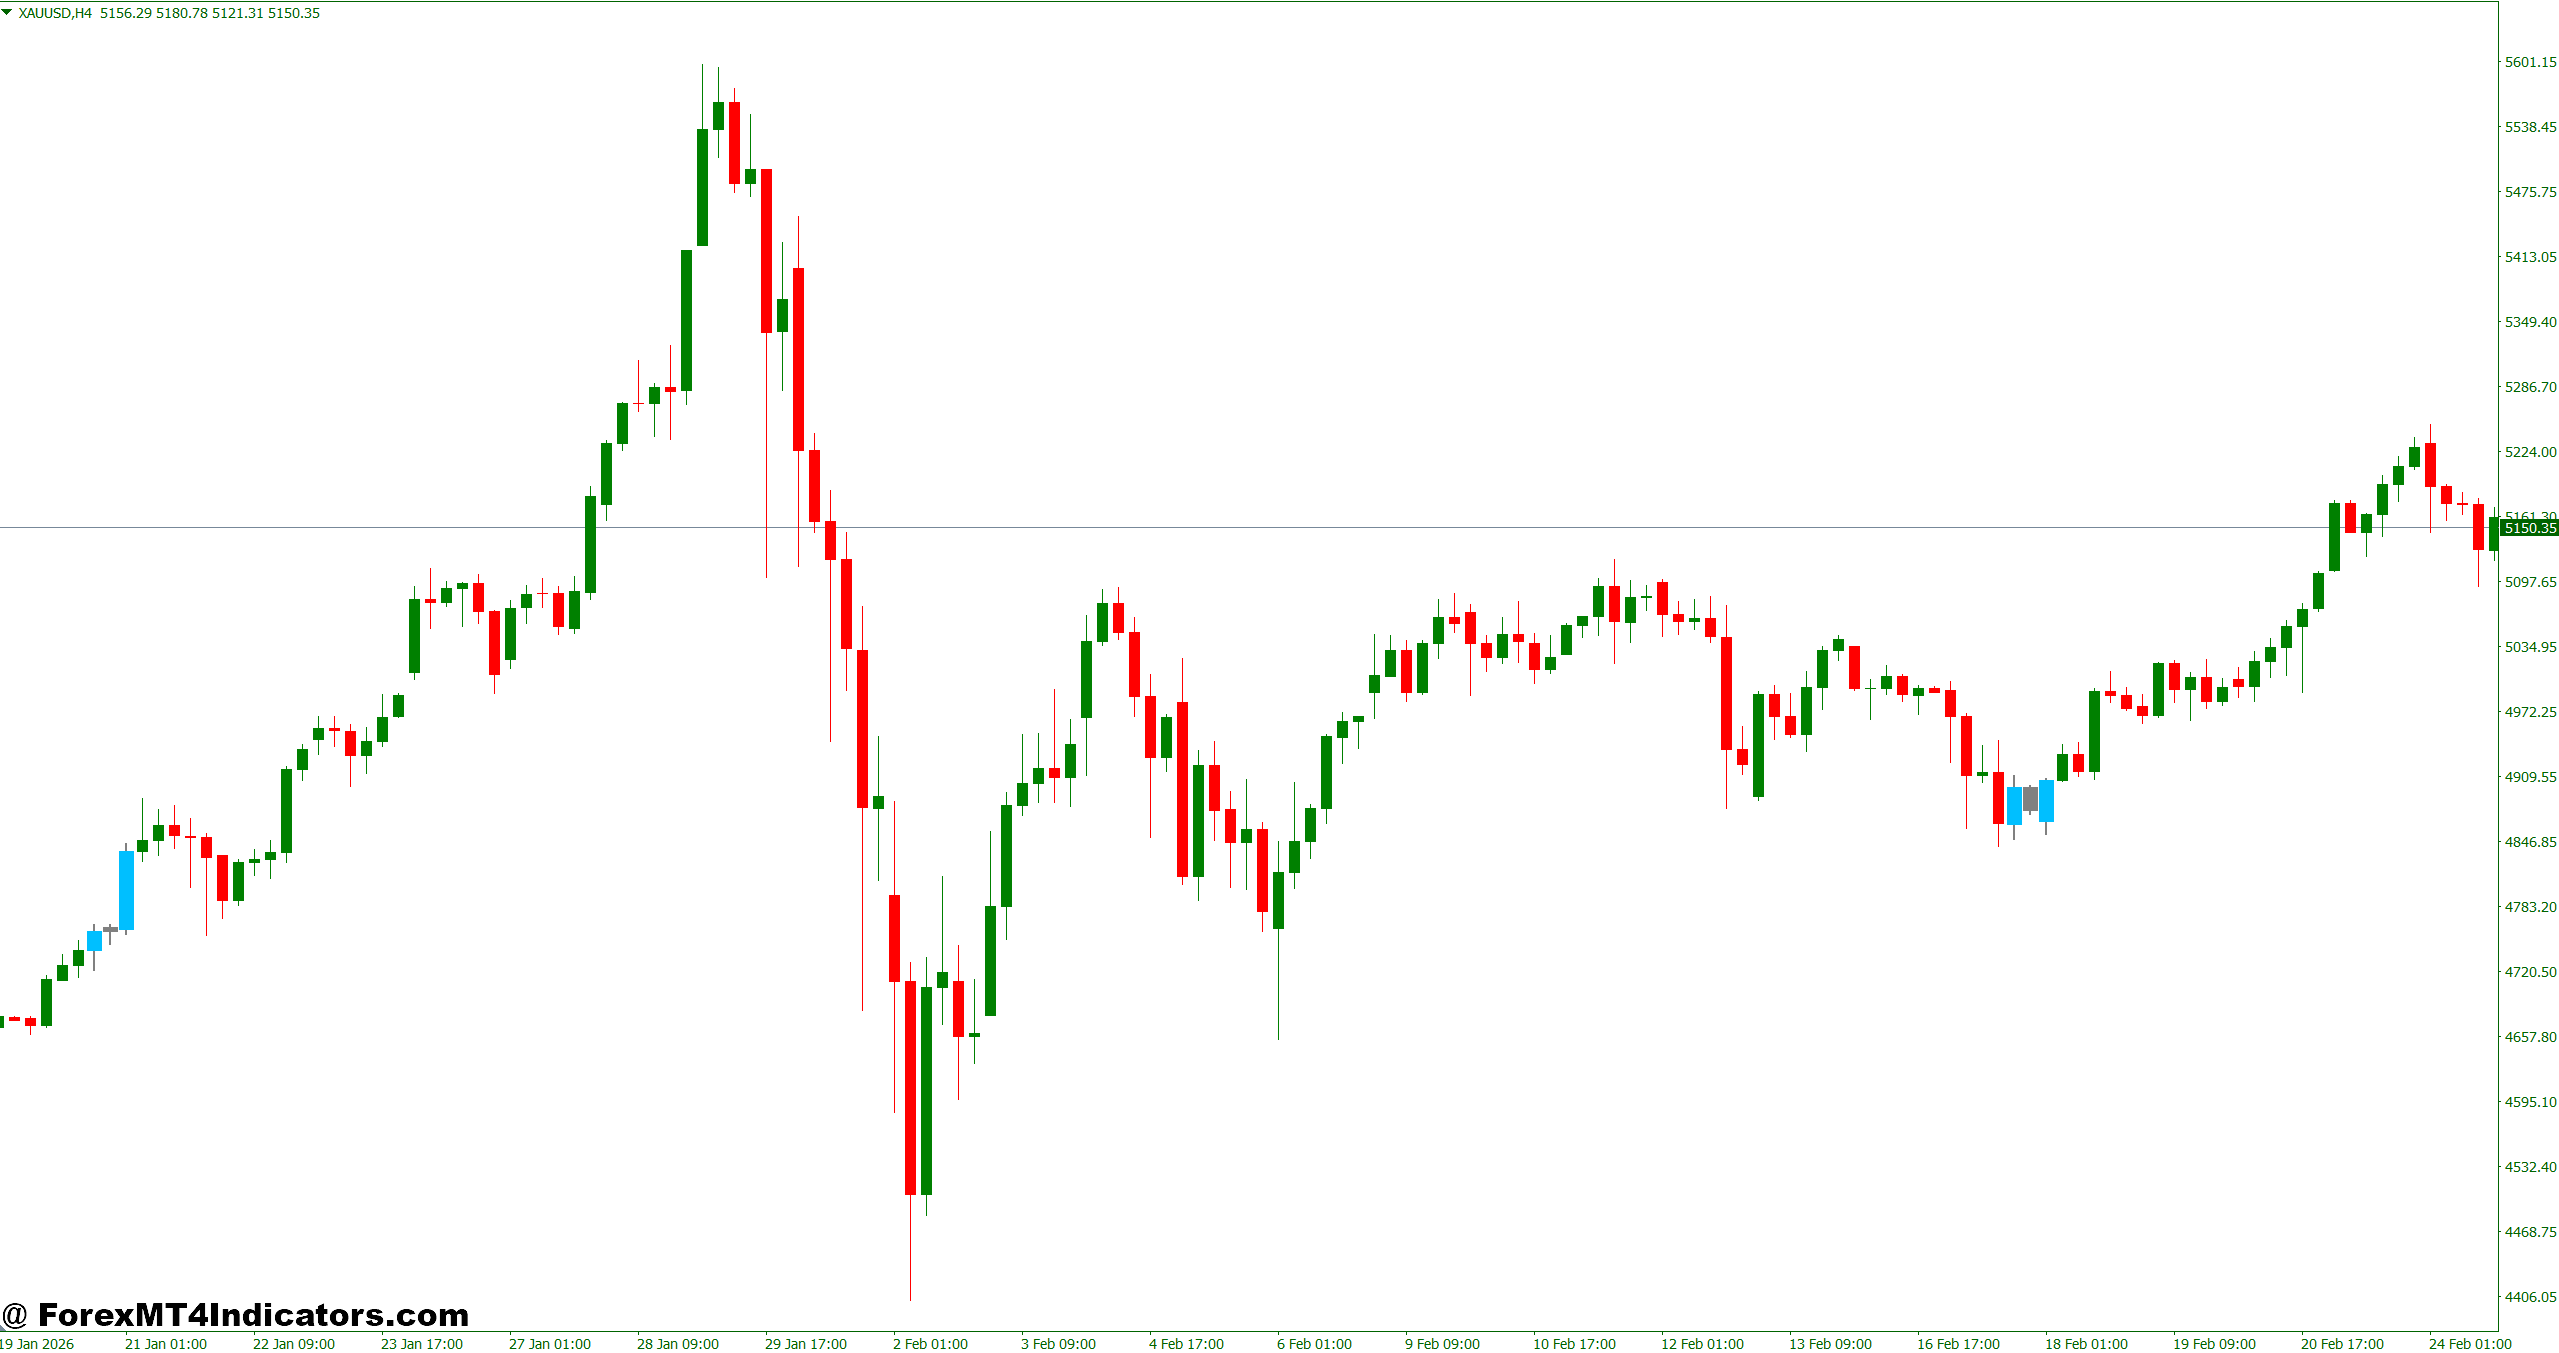
Here’s a real-world style example.
On GBP/USD 1-hour chart, price rallies from 1.2500 to 1.2570 in a steady bullish run. It then consolidates between 1.2555 and 1.2575 for six candles. The Rally Base Rally Indicator MT4 marks this area as a base zone.
When price breaks above 1.2575 and closes at 1.2585, traders can consider a buy entry near the breakout or on a minor pullback toward the base.
A common setup might look like this:
- Entry: 1.2580 after breakout confirmation
- Stop-loss: Below base low at 1.2545 (35 pips risk)
- Take-profit: Previous resistance at 1.2650 (70 pips reward)
That’s a 1:2 risk-to-reward ratio. But here’s the thing: experienced traders often wait for a slight retracement into the base before entering. This improves risk positioning and reduces slippage during volatile sessions.
During high-impact events like Non-Farm Payroll (NFP), volatility can distort base structures. When testing this on volatile NFP days, traders noticed more false breakouts. So many prefer to trade RBR setups during London or early New York sessions when liquidity is stable.
Rally Base Rally Indicator MT4 Settings and Customization
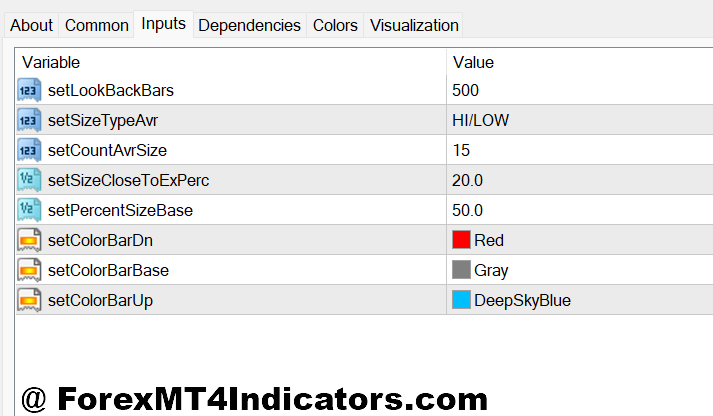
Most versions of the Rally Base Rally Indicator MT4 allow adjustments such as:
- Minimum candle size for rally detection
- Maximum range allowed for the base
- Number of consolidation candles
- Alert notifications
On lower timeframes like M15, traders often reduce the minimum rally threshold to account for smaller average candle sizes. On H4 charts, they may increase the base candle count to filter out minor pauses.
For example, on USD/JPY H4 chart, a trader might define a rally as a 50+ pip move and allow a base range of up to 25 pips. This keeps the pattern relevant to the timeframe.
Customization matters. If settings are too sensitive, the chart fills with weak zones. Too strict, and valid setups disappear.
Advantages and Limitations
The Rally Base Rally Indicator MT4 offers several strengths:
- Clear visual identification of continuation structures
- Helps align trades with trend direction
- Encourages trading near institutional accumulation zones
- Works well with support and resistance analysis
It pairs effectively with tools like the 50-period EMA for trend confirmation or RSI for momentum filtering. When both price structure and momentum align, probability improves.
But no tool is perfect.
RBR patterns fail in ranging markets. In sideways conditions, breakouts often turn into whipsaws. And during extreme news volatility, base formations may not reflect true institutional accumulation.
Trading forex carries substantial risk. No indicator guarantees profits. The Rally Base Rally Indicator MT4 improves structure recognition, but risk management still defines long-term survival.
Comparison with Similar Indicators
Traders sometimes compare this tool to supply and demand indicators. Both aim to identify institutional zones. The difference lies in focus.
Supply and demand tools mark imbalance areas where price left quickly. The Rally Base Rally Indicator MT4 specifically tracks continuation patterns within an existing trend. It doesn’t try to predict reversals. It builds on momentum.
Compared to breakout indicators, RBR analysis offers context. A simple breakout above resistance doesn’t explain why price paused before moving. The RBR structure shows that pause clearly.
That added context can reduce emotional trading. Instead of chasing price, traders wait for structure.
How to Trade with Rally Base Rally Indicator MT4
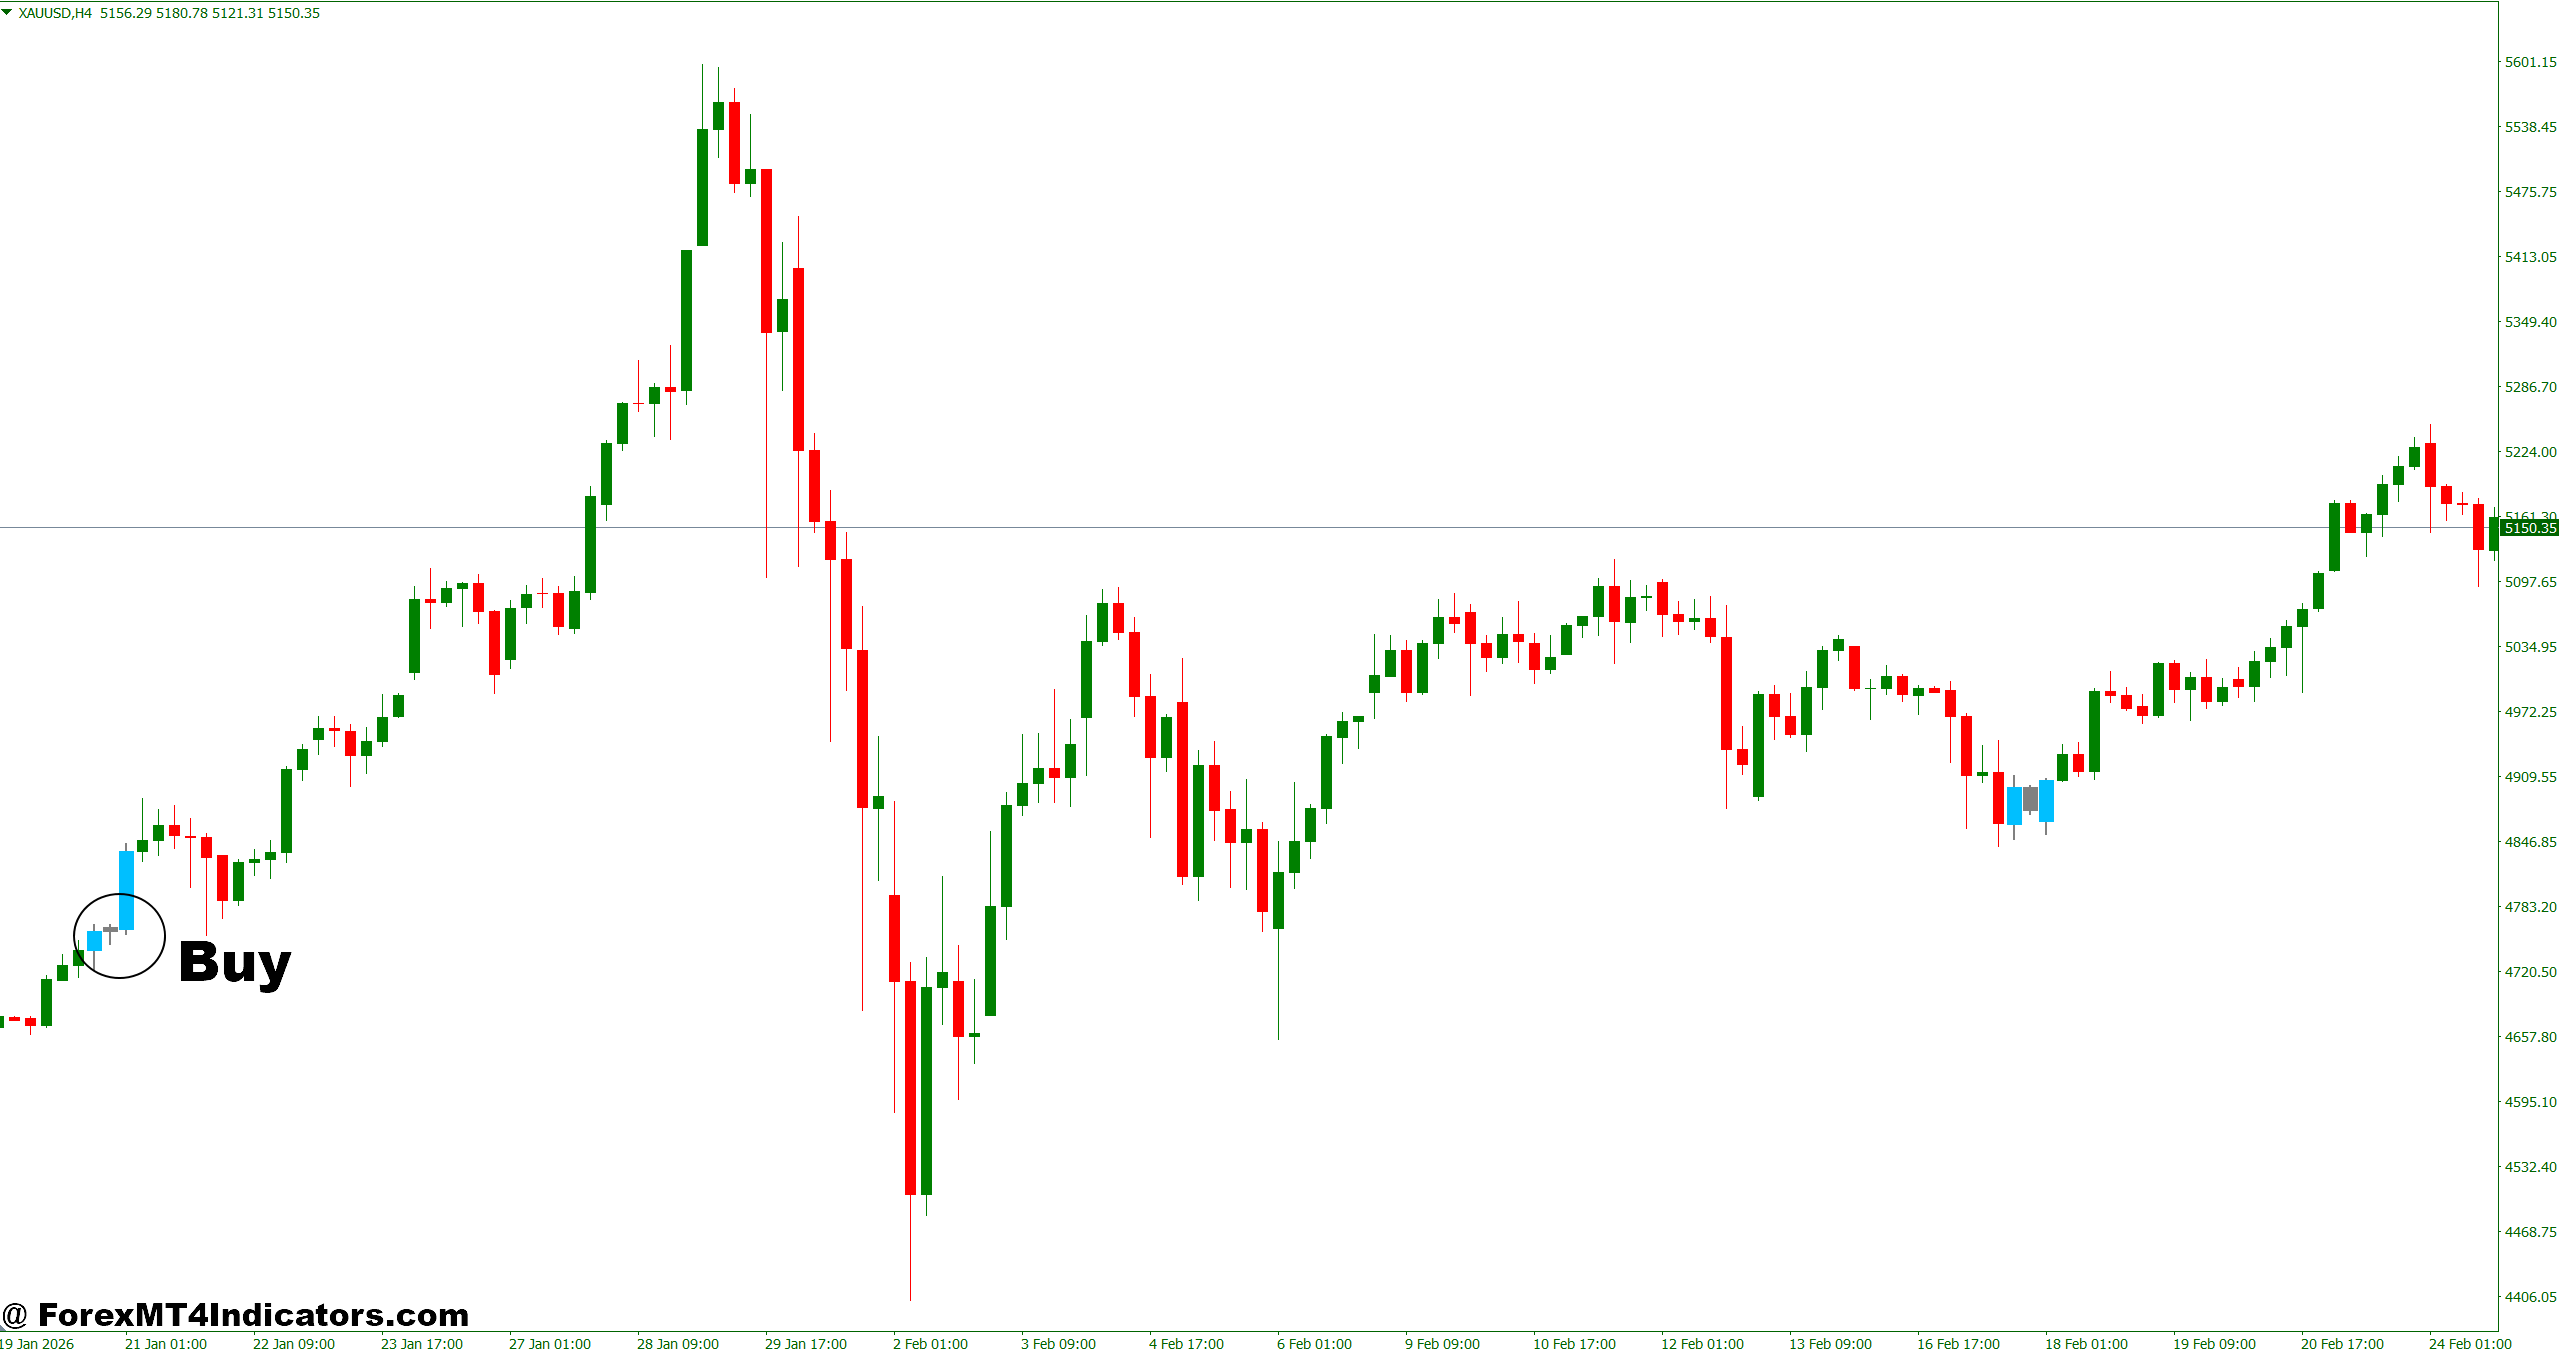
Buy Entry
- Wait for clear Rally-Base-Rally structure – Enter only after a strong bullish move of at least 30–50 pips on EUR/USD 1-hour chart, followed by a tight 10–20 pip base and a confirmed breakout close above the base high.
- Buy on breakout candle close – Open a buy trade when a full candle closes 5–10 pips above the base resistance to avoid fake-outs during low liquidity sessions.
- Enter on pullback to base zone – Instead of chasing price, wait for a retracement back into the base area and enter near the midpoint for a better risk-to-reward ratio (minimum 1:2).
- Set stop-loss below base low – Place stop-loss 5–10 pips below the base low (for example, 25–40 pips on GBP/USD 1-hour) to protect against sudden reversals.
- Confirm with higher timeframe trend – Only take buy setups if the 4-hour or daily chart shows higher highs and higher lows to stay aligned with overall market direction.
- Avoid choppy market conditions – Skip signals when the base forms inside a sideways range of less than 20 pips for several hours; these often lead to whipsaws.
- Use volume or momentum confirmation – If RSI is above 55 or momentum increases during breakout, the setup has stronger continuation potential. Avoid weak breakouts with low volatility.
- Target next resistance level – Aim for previous swing high or 50–100 pips profit on 4-hour setups, trailing stop once price moves 30 pips in profit.
Sell Entry
- Identify Drop-Base-Drop structure – Enter sell trades after a strong bearish impulse of 40–60 pips on GBP/USD 1-hour chart, followed by a narrow consolidation zone before breakdown.
- Sell after confirmed breakdown close – Wait for a candle to close at least 5 pips below the base support to reduce risk of false breakdowns.
- Sell on pullback to broken base – After breakdown, allow price to retest the base resistance and enter near that zone for tighter stop placement and improved reward potential.
- Place stop-loss above base high – Keep stop 5–15 pips above consolidation high (usually 30–50 pips risk on 4-hour timeframe trades).
- Trade with higher timeframe bias – Only take sell setups when daily chart shows a clear downtrend or lower highs structure on EUR/USD or USD/JPY.
- Avoid major news releases – Don’t enter right before NFP or CPI events; high volatility can invalidate the base and cause 20–40 pip spikes.
- Look for momentum confirmation – If MACD histogram turns negative or RSI drops below 45 during breakdown, continuation probability improves.
- Secure profits at key support – Target previous swing low or 60–120 pips on 4-hour trades, and move stop to breakeven after 40 pips in profit.
Conclusion
The Rally Base Rally Indicator MT4 gives traders a structured way to identify continuation opportunities within trending markets. It highlights rally, consolidation, and breakout phases that often reflect institutional participation. Traders who apply it carefully can:
- Spot trend continuation setups with defined risk
- Enter closer to consolidation zones for better reward ratios
- Filter weak breakouts during choppy conditions
- Combine structure with momentum tools for confirmation
Still, it works best as part of a broader trading plan. Risk control, position sizing, and patience matter more than any single indicator. Used with discipline, the Rally Base Rally Indicator MT4 can become a practical addition to a price action strategy rather than a standalone signal generator.
Level up your trading Learn to read the chart — not just the indicator eBook · Instant PDF Video Course · 12 modules Trading forex and CFDs carries a significant risk of loss and is not suitable for everyone. Broker links are affiliate links — we may earn a commission at no cost to you.Recommended MT4/MT5 Brokers
Free MT4 Indicator Download

Enter Your Email Address below, download link will be sent to you.