

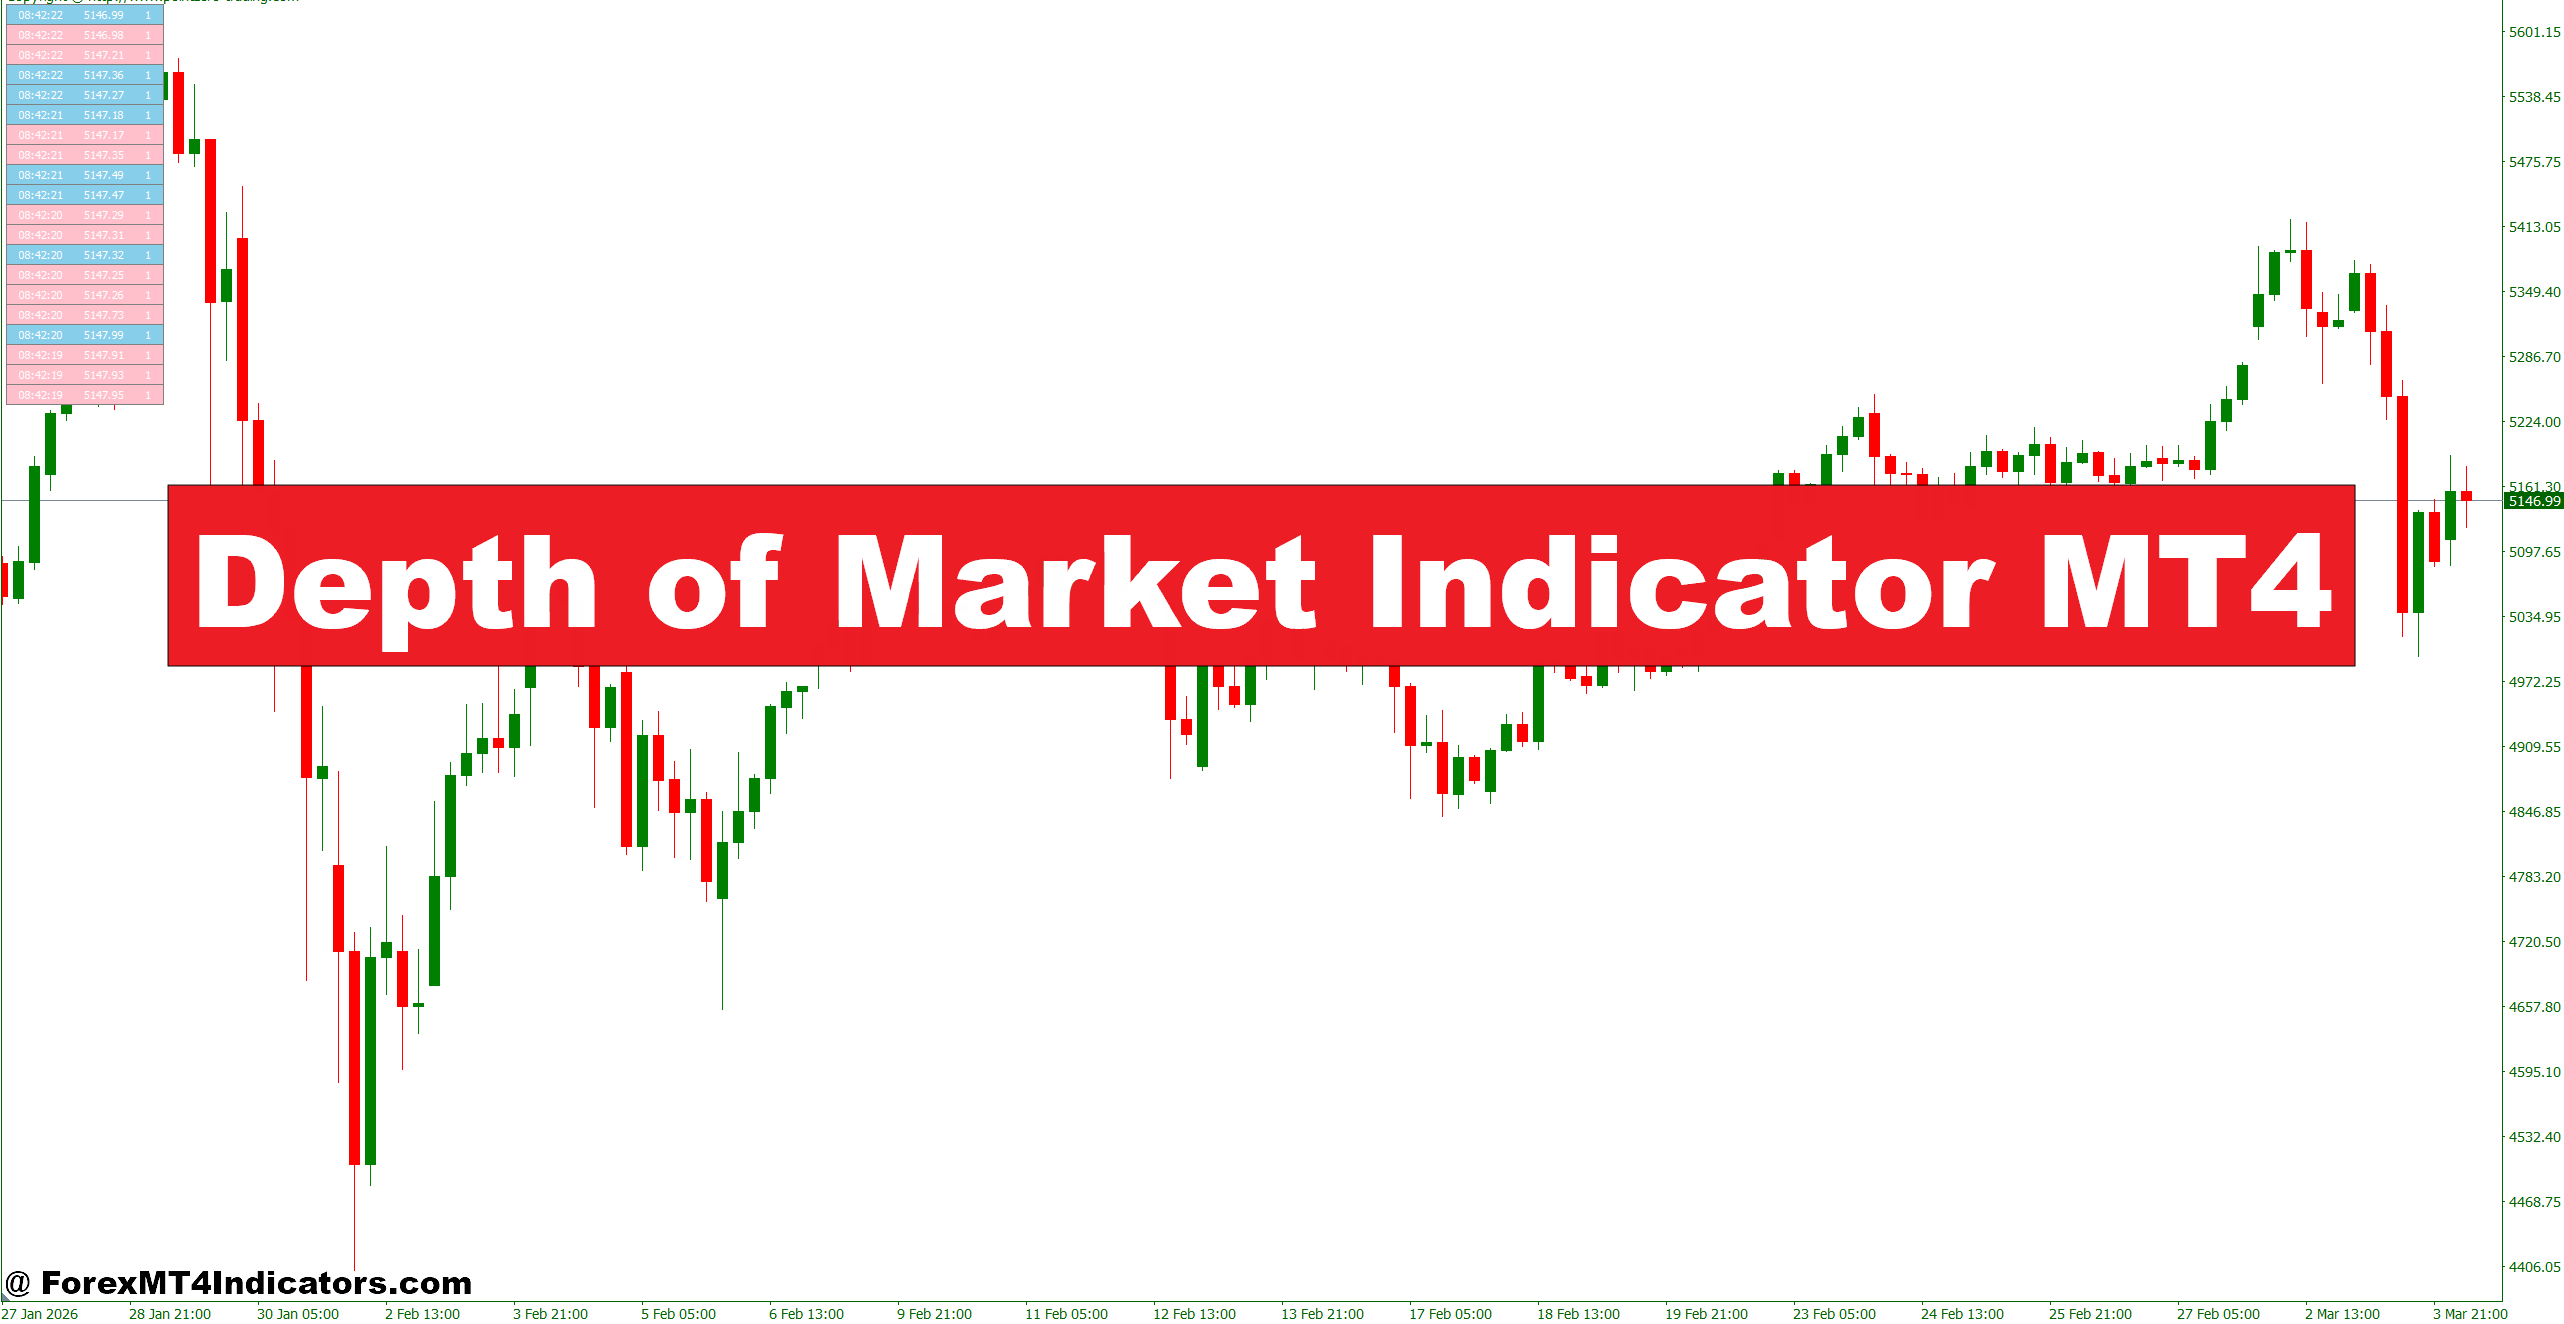
The Depth of Market Indicator MT4 (often called DOM) displays real-time buy and sell orders at different price levels. In simple terms, it shows how much volume is waiting above and below the current market price.
Unlike traditional oscillators such as RSI or MACD, this tool focuses on order book data. It presents a ladder-style view where:
- Bid orders (buyers) appear below current price
- Ask orders (sellers) appear above current price
- Volume size indicates potential support or resistance
For example, if EUR/USD is trading at 1.0850 and the indicator shows a large cluster of sell orders at 1.0860, that level may act as short-term resistance. Price might hesitate or reverse there.
However, traders should understand that MT4’s DOM depends on broker data. It reflects available liquidity from that specific provider, not the entire global forex market.
How the Depth of Market Indicator Works
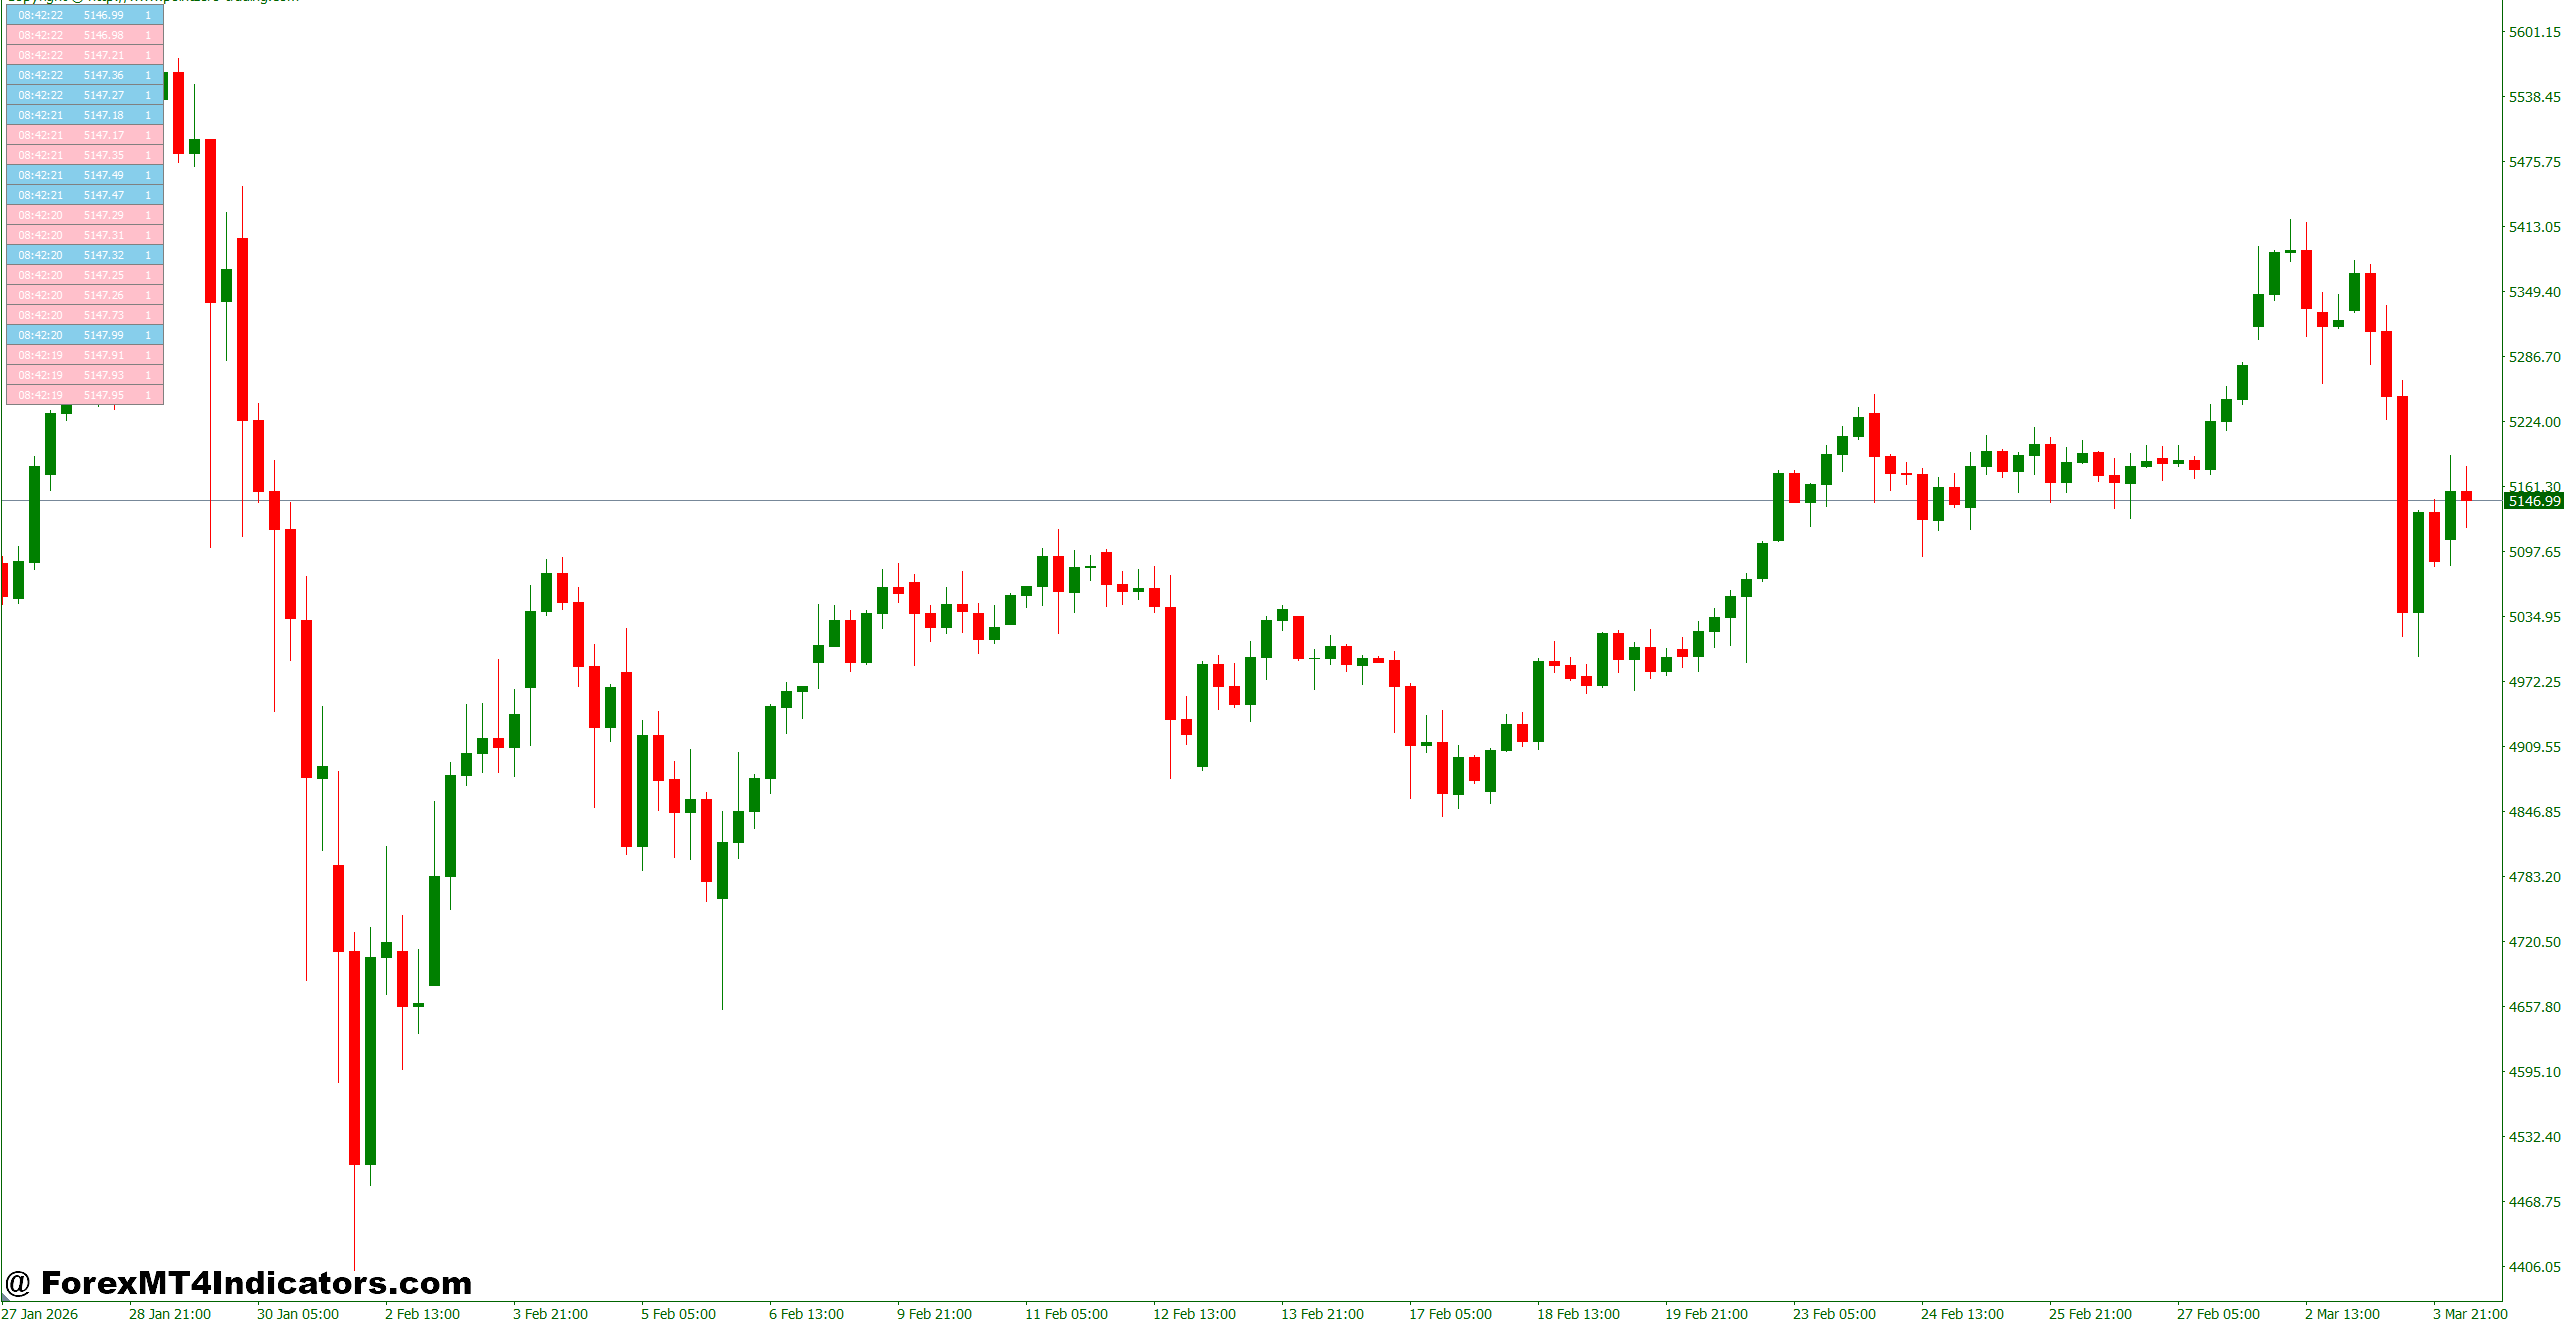
The logic behind this MT4 indicator is straightforward. It collects and displays:
- Pending limit orders
- Available liquidity at each price level
- Real-time changes in order size
When large institutions or active traders place significant orders, they create liquidity pockets. These pockets often attract price, especially during low-volatility sessions.
Example Scenario
On a 1-hour GBP/USD chart, price trades near 1.2700 before a major news event. The Depth of Market Indicator MT4 shows heavy buy orders stacked between 1.2680 and 1.2690.
During a pullback, price drops into that zone. Instead of breaking lower, it finds strong support and rebounds 35 pips toward 1.2735. Traders who watched the DOM saw the liquidity cushion forming before the bounce.
But here’s the thing. Large players sometimes pull orders at the last second. On volatile NFP days, traders may see big orders disappear just before impact. So the indicator works best when combined with price action and market structure.
Practical Trading Applications
Identifying Liquidity-Based Support and Resistance
Traditional support and resistance rely on historical price reactions. The Depth of Market Indicator MT4 adds another layer: real-time liquidity.
If USD/JPY trades at 150.20 and the DOM shows unusually large sell orders at 150.50, traders may plan short setups near that level. Stop-loss could sit 10–15 pips above the liquidity cluster, targeting a 1:2 risk-reward ratio.
Avoiding Breakout Traps
Breakout traders often get caught in whipsaws. When price pushes above a level but large opposing orders sit just beyond it, the breakout may lack follow-through.
On EUR/USD 15-minute chart, price breaks 1.1000. The DOM shows strong sell volume at 1.1008–1.1012. Instead of chasing the breakout, cautious traders wait. Price stalls and drops 25 pips. That hesitation saves a losing trade.
Scaling Into Trades
Advanced traders use order flow tools to scale entries. If buy liquidity gradually increases at lower levels, they may split entries:
- First position at 1.0950
- Second at 1.0940
- Stop below 1.0925
This structured approach improves average entry price while controlling risk.
Trading forex carries substantial risk. No indicator guarantees profits. Depth data can shift quickly, and liquidity conditions change within seconds.
Depth of Market Indicator Settings and Customization in MT4
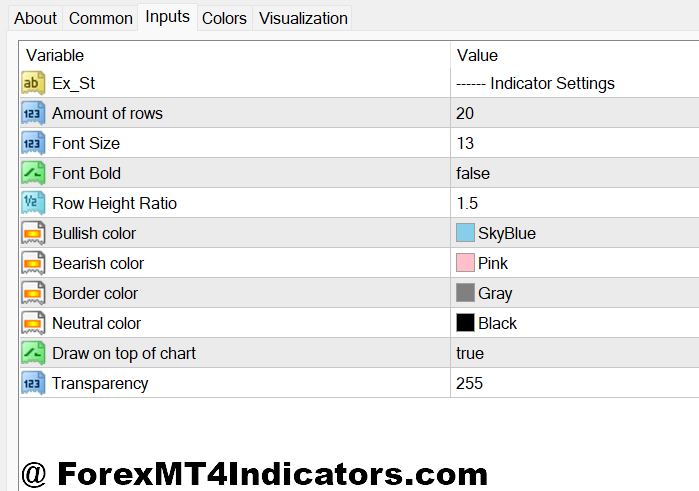
Most versions of the Depth of Market Indicator MT4 allow traders to adjust:
- Display format (ladder view or histogram)
- Number of price levels shown
- Volume filtering threshold
- Refresh speed
Short-term traders on 1-minute or 5-minute charts often prefer faster refresh rates and more detailed levels. Swing traders on 4-hour charts may reduce visual clutter by showing fewer levels.
For highly liquid pairs like EUR/USD or USD/JPY, default settings work well. But exotic pairs may show thinner books, making signals less reliable.
A practical tip from live testing: during Asian sessions, liquidity often appears thinner. DOM signals tend to perform better during London and New York overlap when real volume enters the market.
Advantages and Limitations
Advantages
- Provides insight into real-time order flow
- Helps confirm support and resistance zones
- Useful for short-term scalping strategies
- Improves timing around news events
Compared to indicators like Bollinger Bands or Stochastic Oscillator, the Depth of Market Indicator MT4 focuses on actual liquidity rather than historical price averages.
Limitations
- Broker-dependent data (not centralized forex volume)
- Orders can be canceled quickly
- Less effective during extreme volatility
- Can overwhelm new traders visually
What makes this tool different? It doesn’t predict price. It reveals intent. Traders still need discipline and risk management.
Some traders pair it with Volume Profile or VWAP to confirm high-interest zones. When liquidity clusters align with previous structure levels, probability improves.
Comparing DOM With Traditional Indicators
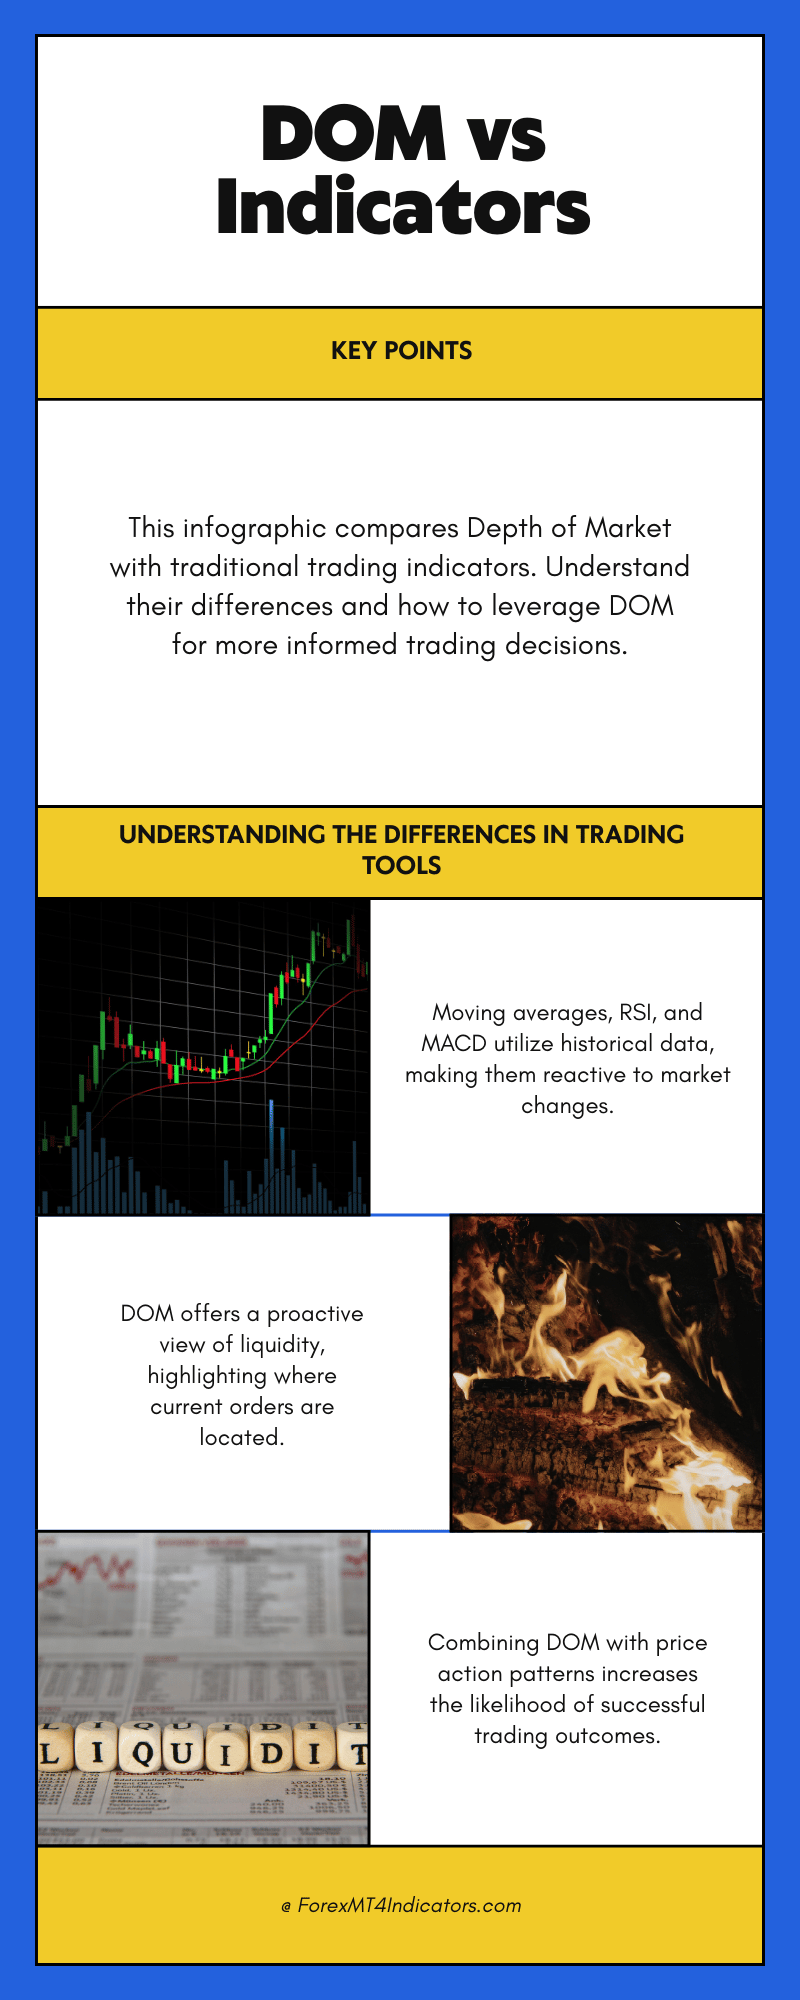
Moving averages smooth past price. RSI measures momentum shifts. MACD tracks trend changes. All rely on historical data.
The Depth of Market Indicator MT4, on the other hand, shows forward-looking liquidity. That distinction matters. Instead of reacting to what already happened, traders observe where orders currently sit.
Still, DOM alone won’t replace a full trading plan. Many experienced traders use it as confirmation rather than primary signal generation. In practice, combining it with price action patterns – like engulfing candles near liquidity walls – produces better outcomes.
Conclusion
The Depth of Market Indicator MT4 offers traders a clearer look at liquidity and order flow. It helps identify real-time support and resistance, reduces breakout traps, and improves entry timing. At the same time, it depends heavily on broker data and shifting market conditions.
In short: it shows where orders sit, it complements price action strategies, and it requires disciplined risk control. Traders who test it on live spreads during active sessions often gain better execution insight. Those expecting automatic signals may feel disappointed.
Used properly, the Depth of Market Indicator MT4 becomes a tactical tool – not a magic formula. The next step? Add it to a demo account, observe liquidity behavior during London session, and document how price reacts around large order clusters. Experience will teach more than theory ever could.
Level up your trading Learn to read the chart — not just the indicator eBook · Instant PDF Video Course · 12 modules Trading forex and CFDs carries a significant risk of loss and is not suitable for everyone. Broker links are affiliate links — we may earn a commission at no cost to you.Recommended MT4/MT5 Brokers
Free MT4 Indicator Download

Enter Your Email Address below, download link will be sent to you.