


Last updated:
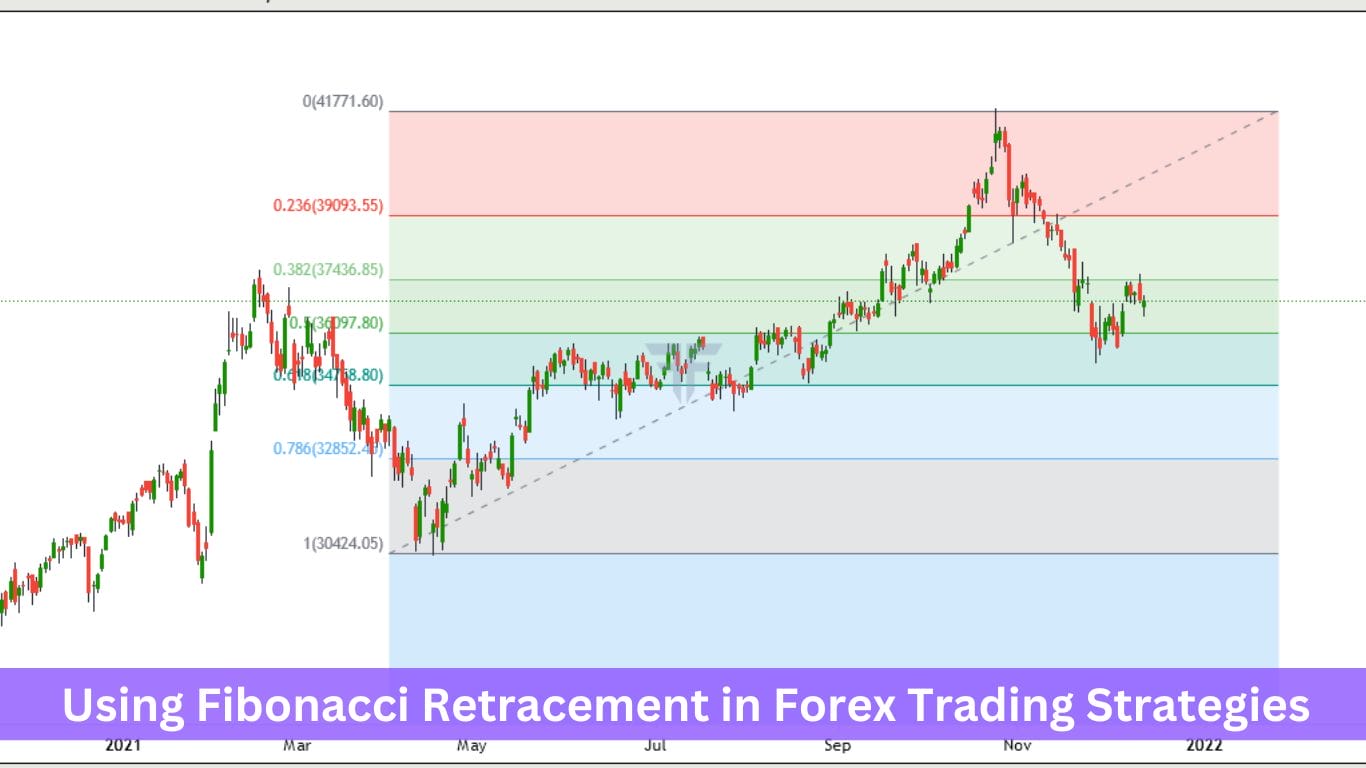
Fibonacci retracement is a tool that marks likely pullback levels in a trend using horizontal lines at 23.6%, 38.2%, 50%, 61.8%, and 78.6% of a prior move. Traders draw it between a swing low and swing high, then watch those levels for entries where a trending pair is likely to bounce and continue.
Key takeaways
- The Fibonacci retracement levels are 23.6%, 38.2%, 50%, 61.8%, and 78.6% (plus the 0% and 100% anchors).
- 50% is not a true Fibonacci ratio — it is included by convention because price often pulls back to the halfway point.
- You draw the tool from swing low to swing high in an uptrend, and swing high to swing low in a downtrend.
- The 61.8% level (“the golden ratio”) is the most-watched retracement for trend-continuation entries.
- Fibonacci works best as a confluence tool — combined with trend direction, structure, and candlestick confirmation, not on its own.
- Every level is a zone of interest, not a guaranteed reversal. Always place a stop and size the position for a controlled loss.
What is Fibonacci retracement in forex?
Fibonacci retracement is a technical tool that plots horizontal support and resistance levels at set percentages of a prior price move. In forex, it answers one question: after a strong move, how far is price likely to pull back before the trend continues?
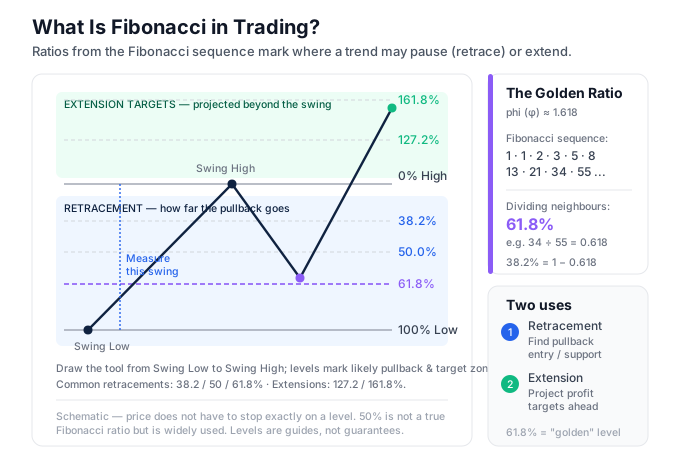
The tool takes the distance between a swing high and a swing low and divides it into ratios derived from the Fibonacci sequence: 23.6%, 38.2%, 50%, 61.8%, and 78.6%. These become horizontal lines on your chart.
The idea is simple. Markets rarely move in a straight line. A pair that rallies 200 pips usually retraces part of that move before continuing. Fibonacci levels give you a map of where that pullback is likely to pause — which is exactly where a trend trader wants to enter.
Where does the sequence come from? Leonardo of Pisa (nicknamed Fibonacci) introduced the number sequence 0, 1, 1, 2, 3, 5, 8, 13, 21… to Europe in 1202. Divide any number by the next and you converge on 0.618 — the “golden ratio.”
Traders don’t need the history. They need the levels and the rules, which is what the rest of this guide covers. If you are still learning the basics of forex trading, start there first, then come back to this.
The key Fibonacci levels (and why 50% isn’t Fibonacci)
There are five retracement levels you will use, framed by the 0% and 100% anchors that mark the ends of the move you measured.
| Level | Where it comes from | How traders read it |
|---|---|---|
| 23.6% | 1 − (ratio two steps ahead) | Shallow pullback; strong trend |
| 38.2% | 1 − 0.618 | Common first bounce level |
| 50% | Halfway point (not Fibonacci) | Psychological midpoint |
| 61.8% | The golden ratio (0.618) | The most-watched entry level |
| 78.6% | Square root of 0.618 | Deep pullback; last-chance zone |
The 61.8% level is the one most traders care about. It comes directly from dividing one Fibonacci number by the next (34 ÷ 55 = 0.618), and price reacts to it often enough that it earned the nickname “the golden ratio.” The 38.2% level is its mirror (1 − 0.618 = 0.382).
The 50% level is not a Fibonacci ratio at all. It is the simple halfway point of the move. It got bundled into the tool because price frequently retraces about half of a swing before continuing — a pattern also seen in Dow Theory. Every charting platform includes it by default, so we use it, but call it what it is: a convention, not real Fibonacci maths.
We treat each level as a zone, not a precise line. Price rarely reverses to the exact pip. On EUR/USD H1 we watch a band of a few pips around each level; on XAU/USD, where volatility is higher, we widen that band to 15-25 pips because gold overshoots levels more often than forex majors do.
How to draw Fibonacci retracement on a chart (step by step)
Drawing direction is the single most common mistake beginners make. Get the two anchor points right and everything else follows. The rule: you always draw from the start of the move to the end of the move, in the direction the trend is going.
In an uptrend: swing low to swing high
In an uptrend, you click the swing low first and drag to the swing high.
- Identify the most recent clear impulsive move up — a leg where price rallied without a deep pullback.
- Select the Fibonacci retracement tool in your platform.
- Click on the swing low (the 100% anchor, bottom of the move).
- Drag up and release on the swing high (the 0% anchor, top of the move).
- The levels now print below the high. As price pulls back, watch 38.2%, 50%, and 61.8% for a bounce and continuation upward.
In a downtrend: swing high to swing low
In a downtrend, you reverse the direction: click the swing high first and drag down to the swing low.
- Find the recent impulsive move down.
- Click on the swing high (the 0% anchor for a down move).
- Drag down and release on the swing low (the 100% anchor).
- The levels now print above the low. As price bounces back up, watch the same ratios for a rejection and continuation downward.
The direction feels backwards to some beginners, but the logic is constant: 0% sits at the most recent end of the move, 100% at the start. If your levels look upside down, you dragged the wrong way — redraw. Choosing the right swing points is a core technical analysis skill, and it improves with screen time.
How to trade Fibonacci retracement: entry, stop, target
A Fibonacci level is a decision zone, not a signal by itself. Our rule is never to enter on a level touch alone — we wait for the level to hold and for price to show it is turning.
Entry. Wait for price to reach a level (we favour 61.8% in a healthy trend, 38.2% in a strong one) and print a confirmation — a rejection wick, an engulfing candle, or a small structure break in the trend’s direction. Then enter in the direction of the larger trend.
Stop loss. Place the stop a few pips beyond the next Fibonacci level. If you enter at 61.8%, your stop sits below the 78.6% level. The logic: if price blows through 78.6%, the retracement is probably a full reversal and your trade idea is invalid — so you want out.
Target. Take partial or full profit at the prior swing high (in an uptrend) or swing low (in a downtrend). For a runner, use Fibonacci extensions (below) to project targets beyond the original move.
This gives you a complete plan before you click: where you get in, where you’re wrong, and where you get out. The stop placement is what keeps a wrong Fibonacci read from becoming a large loss.
Using the Fibonacci tool in MT4 and MT5
Both MetaTrader 4 and MetaTrader 5 include the Fibonacci retracement tool natively. Find it under Insert → Objects → Fibonacci → Fibonacci Retracement, or click the Fib icon on the toolbar, then click-and-drag across your swing.
By default MT4/MT5 show the 0, 23.6, 38.2, 50, 61.8, and 100 levels. To add 78.6%, double-click the tool, open Fibo Levels, and add a level with the value 0.786 and a description. We add 78.6% on every setup because it is our stop-reference level.
Drawing the tool by hand on every swing gets tedious, and it invites the wrong-direction error. Free automatic Fibonacci retracement indicators plot the levels for you off the most recent swing. We keep versions for both platforms: the automatic Fibonacci retracement indicator for MT4 and the same tool for MT5. Auto-plotting is convenient, but always sanity-check that the indicator picked the swing you would have chosen — a badly chosen swing gives useless levels.
If you want to check exact level prices before you’re at the chart, our Fibonacci Calculator takes a high and low and returns every retracement and extension price instantly.
Confluence: Fibonacci with trendlines, MAs, candlesticks and price action
A Fibonacci level on its own is a coin flip. A Fibonacci level that lines up with another independent signal is a setup. This overlap is called confluence, and it is where the tool earns its place.
The strongest confluences we use:
- Trendline touch. When a rising trendline meets the 61.8% level at the same price, both tools point to a bounce. That agreement raises the odds.
- Moving average. A 50 or 200 EMA sitting on the 50% or 61.8% retracement is a classic institutional-interest zone.
- Prior structure. If old support or resistance sits on a Fib level, the level is far more likely to hold.
- Candlestick confirmation. A pin bar or bullish engulfing candle right at the 61.8% level is our trigger to enter. Read our full guide to candlestick confirmation for the exact patterns we trust.
We don’t take a Fibonacci trade without at least one confluence factor. Reading price action at retracement levels — how the candles behave when they reach the zone — is what separates a level that holds from one that gets sliced through.
On XAU/USD, confluence matters even more. Gold wicks through single levels constantly during the New York session and around news, so a Fib level backed by structure and a clean rejection candle is far more reliable than a bare level.
Fibonacci extensions for profit targets
Where retracements measure how far a pullback goes, Fibonacci extensions project how far the next move might run. They use ratios beyond 100% — most commonly 127.2%, 161.8%, and 261.8%.
The workflow: after price bounces off a retracement level and the trend resumes, extensions give you logical take-profit zones ahead of price. The 161.8% extension is the most popular first target for a trend continuation.
We use extensions to set the target end of a trade after Fibonacci retracement gave us the entry. Retracement gets you in; extension tells you where to consider getting out. Together they frame the whole trade.
Worked example: a EUR/USD Fibonacci trade
Here is a full setup with the maths, so you can see how the pieces fit. All numbers are illustrative and rounded to whole pips.
The move. EUR/USD rallies from a swing low of 1.0800 to a swing high of 1.1000. That is a 200-pip up-leg. We draw the Fibonacci tool from the low (100% anchor) to the high (0% anchor).
The levels (price = 1.1000 − 200 pips × ratio):
| Level | Price |
|---|---|
| 23.6% | 1.0953 |
| 38.2% | 1.0924 |
| 50% | 1.0900 |
| 61.8% | 1.0876 |
| 78.6% | 1.0843 |
Entry. Price pulls back to the 61.8% level at 1.0876 and prints a bullish engulfing candle on H1 — our confirmation. We buy at 1.0876.
Stop. We place the stop 10 pips below the 78.6% level (1.0843), at 1.0833. That is a 43-pip stop. If price trades below 78.6%, the retracement is likely a reversal and we are out.
Target. We target the prior swing high at 1.1000 — a 124-pip move from entry. That is a risk-to-reward of roughly 1:2.9. A runner could aim for the 161.8% extension at 1.1124.
Position size. On a $5,000 account risking 1% ($50) with a 43-pip stop:
- Pip value on a EUR/USD standard lot = $10 per pip.
- Lots = $50 ÷ (43 pips × $10) = 0.116, rounded down to 0.11 lot.
- 0.11 lot × 43 pips × $10 = $47.30 risk = 0.95% of the account — safely under the 1% cap.
We round down, never up, so the real risk stays below the limit. To size any trade this way in seconds, use our position size calculator: enter account balance, risk percent, and stop distance, and it returns the lot size.
Common Fibonacci mistakes beginners make
Most Fibonacci failures are user error, not tool error. These are the five we see most:
- Drawing in the wrong direction. Anchoring low-to-high in a downtrend flips every level. Always draw from the start of the move to its end, in the trend’s direction.
- Picking the wrong swings. Using a tiny, unclear swing produces meaningless levels. Only measure clear, impulsive legs.
- Trading the level with no confirmation. A touch is not a signal. Wait for a rejection candle or structure shift before entering.
- Ignoring the trend. Fibonacci is a trend-continuation tool. Buying retracements in a downtrend is fighting the market.
- No stop, or a stop that’s too tight. Skipping the stop turns a small managed loss into an account-killer. Placing it inside the noise gets you stopped out before the bounce.
Fix all five and the tool goes from random to genuinely useful. Note that none of these fixes make Fibonacci “accurate” — they only stop you from using it badly.
Do Fibonacci levels actually work?
Honest answer: Fibonacci levels work often enough to be useful, and not because of any mystical property of the numbers. They work partly as a self-fulfilling pattern — so many traders watch 61.8% that orders cluster there, which makes price react there.
That means Fibonacci is a probability tool, not a prediction machine. Levels get respected in trending, liquid markets and get ignored in choppy, ranging, or low-volume conditions. During the Asian session or ahead of high-impact news, expect more false reactions.
Set your expectations accordingly. Used with the trend, with confluence, and with a stop, Fibonacci retracement improves your entries. Used alone as a magic reversal signal, it will disappoint you. No indicator has a fixed win rate, and anyone selling you a “100% accurate” Fibonacci system is selling a story.
Forex and CFD trading carries a high level of risk and may not be suitable for all traders. The strategies and indicators described in this article are educational. Past performance does not guarantee future results. Always test on a demo account before risking real capital.
Frequently asked questions
What is Fibonacci retracement in forex trading?
Fibonacci retracement is a technical tool that marks likely pullback levels within a trend using horizontal lines at 23.6%, 38.2%, 50%, 61.8%, and 78.6% of a prior price move. Traders draw it between a swing high and swing low, then watch those levels for trend-continuation entries.
What are the main Fibonacci retracement levels?
The main levels are 23.6%, 38.2%, 50%, 61.8%, and 78.6%, framed by the 0% and 100% anchors. The 61.8% “golden ratio” level is the most watched. Of these, 50% is the odd one out — it is the halfway point and not a true Fibonacci ratio.
How do you draw Fibonacci retracement correctly?
Draw from the start of a move to its end, in the trend’s direction. In an uptrend, click the swing low first and drag to the swing high. In a downtrend, click the swing high first and drag to the swing low. If your levels look inverted, you dragged the wrong way — redraw them.
Which Fibonacci level is best for forex?
The 61.8% level is the most-watched and our default entry zone in a healthy trend, because so many traders react to it that orders cluster there. In strong trends, price often turns earlier at 38.2%. There is no single “best” level — you read them together with trend and confirmation.
Is 50% a Fibonacci level?
No. 50% is the halfway point of the move, not a ratio from the Fibonacci sequence. It is included in the tool by convention because price frequently retraces about half a swing before continuing. Every charting platform shows it by default, but it is not real Fibonacci maths.
How do you trade Fibonacci in an uptrend vs a downtrend?
In an uptrend you buy pullbacks: draw low-to-high, wait for a bounce at 38.2-61.8%, and enter long with the trend. In a downtrend you sell bounces: draw high-to-low, wait for a rejection at those same levels, and enter short. The levels are identical; only the direction and order flip.
What’s the difference between retracement and extension?
Retracement measures how far a pullback goes within a move, using levels up to 100%. Extension projects how far the next move might run beyond the original, using levels like 127.2% and 161.8%. Retracement gives you the entry; extension gives you the profit target.
Do Fibonacci levels really work in forex?
They work often enough to be useful, largely because they are self-fulfilling — many traders watch the same levels, so orders cluster there. But they are a probability tool, not a guarantee. Levels hold in trending, liquid markets and fail in choppy or low-volume conditions. Always combine them with trend, confluence, and a stop.
Fibonacci retracement is one of the few tools that stays useful across every timeframe and pair, because it maps something real: where trends pause before continuing. Draw it correctly from swing to swing, favour the 61.8% level, demand confluence and a confirmation candle, and always trade it with a stop. Do that, and Fibonacci becomes a repeatable part of your entry process — not a crystal ball, but a genuine edge on trend-continuation trades.
