


Last updated:
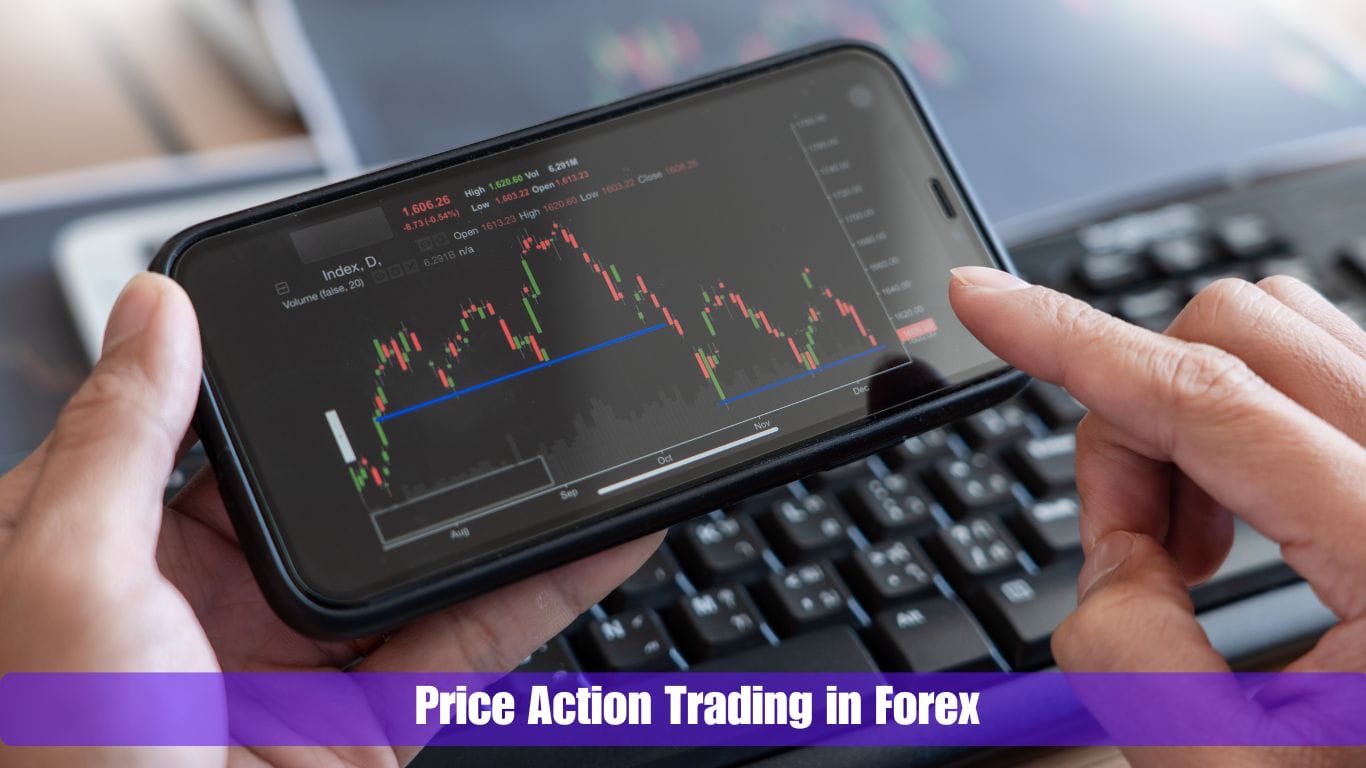
Price action trading in forex is reading raw price on a clean chart — candlesticks, market structure, and support and resistance — to decide when to buy and sell, without relying on lagging indicators. You trade what price is actually doing, using patterns like pin bars and engulfing candles at key levels to time entries and place stops.
Key takeaways
- Price action trading means making decisions from raw candlestick movement and chart structure, not from indicator readings.
- The core building blocks are candlesticks, market structure (higher highs/lows or lower highs/lows), and support and resistance.
- The three patterns beginners actually need are the pin bar, the inside bar, and the engulfing candle — traded at a level, not in isolation.
- Price action works best on H1, H4, and D1 charts; on M5 it fires far more false signals because spread and noise dominate.
- You can trade price action without indicators, but most consistent traders still add one confluence factor — a moving average, Fibonacci, or a higher-timeframe bias.
- Price action is beginner-friendly to understand but not easy to master. It removes indicator clutter; it does not remove risk. Size every trade to risk no more than 1% of your account.
What is price action trading in forex?
Price action trading is a method of analysing a market using the raw movement of price itself, shown through candlesticks and chart structure, instead of technical indicators. A price action trader looks at where price has been, where buyers and sellers reacted, and what the current candles are doing right now.
The idea is simple: every indicator is nothing more than a formula applied to price. RSI, MACD, moving averages — all of them are derived from the same open, high, low, and close that you can read directly on the candles. Price action skips the middle step and reads the source.
This does not mean price action is guesswork. It has a clear vocabulary — support, resistance, trend structure, and a handful of repeatable candlestick patterns. If you are still learning the basics, start with our beginner guide to forex trading, then come back here.
Price action sits inside the broader field of technical analysis. The difference is emphasis: technical analysis often leans on indicators, while price action keeps the chart clean and lets the candles do the talking.
Why traders use price action
The first reason is a clean chart. Traders who stack five indicators on one screen often end up paralysed — one says buy, another says sell. A price action chart shows only candles and a few drawn levels, so the decision is clearer.
The second reason is speed of reaction. Indicators lag by design; they average past prices. A pin bar rejecting a level tells you buyers stepped in on that candle, not three candles later. For timing entries, that immediacy matters.
The third reason is transferability. Once you can read structure and candlestick signals, the skill works on any market — EUR/USD, GBP/USD, XAU/USD, indices, even crypto. You are not tied to one indicator’s quirks on one instrument.
None of this makes price action a magic edge. “Naked” trading (charts with no indicators) still requires discipline, a tested plan, and strict risk control. What it removes is clutter and lag — not the need to be wrong sometimes.
The building blocks: candlesticks, market structure, and support and resistance
Before any pattern makes sense, you need three foundations. Skip these and you will misread every setup.
Candlesticks
A candlestick shows four prices for one time period: the open, high, low, and close. The body is the distance between open and close; the wicks (or shadows) show the high and low the price reached before closing.
The body tells you who won the period. A long green body means buyers dominated the close; a long red body means sellers did. Long wicks tell you a level was tested and rejected. Reading candles fluently is the foundation of everything below — our full guide to candlestick patterns breaks down each one.
Market structure
Market structure is the sequence of swing highs and lows that defines the trend. An uptrend makes higher highs and higher lows. A downtrend makes lower highs and lower lows. A range makes roughly equal highs and lows.
Trade in the direction of structure and your setups have the trend behind them. Fight it, and you are picking tops and bottoms — a low-probability game for beginners.
Support and resistance
Support is a price level where buyers have repeatedly stepped in and pushed price up. Resistance is a level where sellers have repeatedly capped price. These levels are where price action signals carry the most weight.
A pin bar in the middle of nowhere means little. The same pin bar rejecting a support level that has held three times before is a real setup. Levels turn patterns into edges.
Core price action patterns every beginner needs
You do not need fifty patterns. Three do most of the work, and they are worth knowing cold.
The pin bar
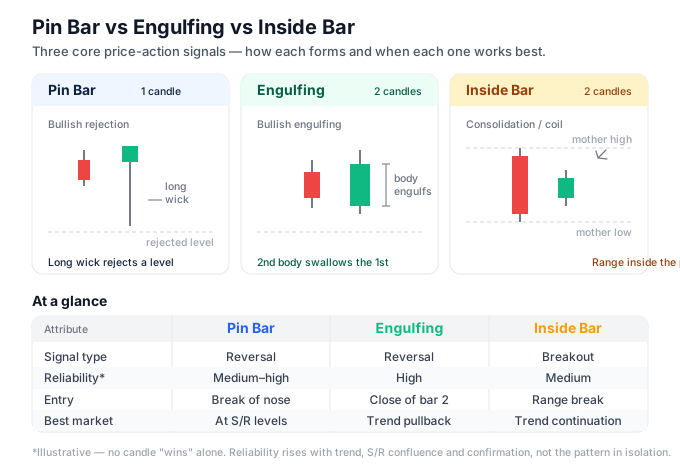
A pin bar is a single candle with a small body and one long wick. The long wick shows that price pushed into a level and got rejected hard. A bullish pin bar has a long lower wick (buyers rejected lower prices); a bearish pin bar has a long upper wick.
Trade it at a level, in the direction the wick points away from. Entry is typically on the break of the pin bar’s body or nose; the stop goes beyond the tip of the wick.
The inside bar
An inside bar is a candle whose entire range (high to low) sits inside the previous candle’s range. That prior candle is the “mother bar.” An inside bar shows the market pausing and coiling — a compression before a move.
It is a breakout pattern, not a reversal one. Traders enter on the break of the mother bar’s high or low, usually in the direction of the prevailing trend. It works best as a continuation signal after a strong move.
The engulfing candle
A bullish engulfing pattern is a green candle whose body completely engulfs the prior red candle’s body. A bearish engulfing is the opposite. It signals a sharp shift in who controls the market.
Of the three, engulfing patterns tend to be the most reliable at levels, because they show a decisive takeover in a single close. Entry is on the close of the engulfing candle; the stop sits beyond the pattern’s extreme.
How to trade price action: a step-by-step beginner workflow
Here is a repeatable routine you can run on any pair. The order matters — structure first, level second, signal last.
- Mark the trend. Open the H4 or D1 chart. Is price making higher highs and higher lows (uptrend), lower highs and lower lows (downtrend), or ranging? This sets your bias.
- Draw your levels. Mark the two or three clearest support and resistance levels where price has reacted before. Fewer, stronger levels beat a chart covered in lines.
- Drop to your trading timeframe. Move to H1 and wait for price to approach one of your marked levels. Patience here separates winners from over-traders.
- Wait for a signal at the level. Only act when a pin bar, inside bar, or engulfing candle forms at a level in the direction of your bias. No signal at a level means no trade.
- Define entry, stop, and target before you click. Enter on the pattern’s trigger, place the stop beyond the pattern’s extreme, and set a take-profit at the next structural level. Aim for at least a 1:2 risk-to-reward.
- Size the position to your risk, then execute. Calculate the lot size so a stop-out costs no more than 1% of your account (worked example below), then place the trade and leave it alone.
Setting up price action on MT4 and MT5
One quiet advantage of price action is that MT4 and MT5 need almost no setup — the platform ships ready for it.
Start by stripping the chart. Remove default indicators, set the candlesticks to a clean colour scheme (a plain green/red or black/white), and switch the chart type to candlesticks under Charts → Candlesticks (or press Alt+2).
Use the horizontal line tool to mark support and resistance, and the trendline tool for diagonal structure. Save the clean layout as a template (right-click → Template → Save Template) so every new chart opens the same way.
You do not need a paid tool to trade price action, but two optional additions help beginners: a single moving average (such as the 50 EMA) for trend context, and the built-in Fibonacci tool for measuring pullbacks. Both are native to MT4/MT5 — no download required.
On XAU/USD (gold), keep price action but widen your stops. Gold’s candles print longer wicks than most forex pairs, so a stop placed too tight behind a pin bar gets swept out by normal noise. Give gold setups roughly 1.5 times the stop distance you would use on EUR/USD.
Managing risk on a price action trade: a worked example
A pattern is only half the trade. Position sizing is what keeps you in the game. Here is the full math on a clean, beginner-sized example.
Setup:
- Account balance: $1,000
- Risk per trade: 1% = $10
- Pair: EUR/USD
- Signal: a bullish engulfing candle at support
- Stop-loss distance: 20 pips (a few pips below the pattern’s low)
- Take-profit: 40 pips away, at the next resistance level (a 1:2 risk-to-reward)
Step 1 — confirm the pip value. On EUR/USD, one pip is 0.0001. The pip value on a full standard lot (100,000 units) of a USD-quoted pair is $10 per pip. That scales down proportionally with lot size.
Step 2 — calculate the position size. The formula is:
Lot size = risk in dollars ÷ (stop in pips × pip value per standard lot)
Plugging in the numbers:
Lot size = $10 ÷ (20 × $10) = $10 ÷ $200 = 0.05 lot
Step 3 — verify the risk. A 0.05 lot is worth $0.50 per pip (0.05 × $10). A 20-pip stop-out therefore costs 20 × $0.50 = $10 — exactly your 1% limit. The math holds.
Step 4 — check the reward. The 40-pip take-profit at $0.50 per pip returns 40 × $0.50 = $20, or 2R. Win this trade and you gain $20; lose it and you lose $10.
Run this calculation on every trade before you click. Our position size calculator does it instantly if you would rather not do the arithmetic by hand. Consistent sizing, not pattern-picking, is what compounds an account over time.
Price action vs indicator trading: which is better for beginners?
This is the wrong question, but it gets asked constantly, so here is the honest answer.
| Factor | Price action | Indicator trading |
|---|---|---|
| Chart clarity | Clean, minimal | Can get cluttered |
| Lag | None — reads price directly | Indicators lag by design |
| Learning curve | Concepts simple, mastery slow | Rules feel concrete early |
| Objectivity | More discretionary | More mechanical |
| Best use | Timing entries at levels | Confirming trend or momentum |
Price action is not “better” than indicators — they answer different questions. Indicators are good at measuring trend strength and momentum in a mechanical, rules-based way. Price action is good at timing an entry at a level and reading intent candle by candle.
For most beginners, the strongest approach is not one or the other. It is price action as the core skill, with one indicator (often a moving average) for context. That keeps the chart clean while giving you an objective trend filter.
Common price action mistakes to avoid
These are the errors that quietly drain beginner accounts. Each has a specific fix.
- Trading patterns in a vacuum. A pin bar with no level behind it is noise. Fix: only take a signal at a marked support/resistance level or structural point.
- Ignoring the higher timeframe. Taking a bullish signal against a clear D1 downtrend is fighting the current. Fix: set your bias on H4/D1 before you look for entries.
- Dropping to M5 too soon. Price action on M5 fires constant false signals because spread and noise dominate small candles. Fix: learn on H1/H4/D1 first; add lower timeframes only once you are consistent.
- Over-marking the chart. Twenty support lines are as useless as none. Fix: keep two or three of the clearest levels per chart.
- Skipping the stop. “The pattern is obvious, I don’t need a wide stop.” Gold and news candles disagree. Fix: always place the stop beyond the pattern’s extreme, and size the position accordingly.
- Forcing trades on quiet days. No clean signal at a level means no trade. Fix: accept that patience is part of the method; a no-trade day is a valid outcome.
Putting it together: price action, candlesticks, and Fibonacci confluence
The highest-probability setups happen when several unrelated factors point the same way. This agreement is called confluence, and it is where price action stops being a single pattern and becomes a system.
Here is a simple three-part confluence workflow beginners can build on:
- Structure and level. Price pulls back into a support level within an established uptrend.
- A price action signal. A bullish engulfing candle or pin bar forms at that level — one of the candlestick patterns that shows buyers taking control.
- A measured retracement. The pullback lands in the 50–61.8% zone of the prior move, drawn with Fibonacci retracement — a common area where trends resume.
When all three line up — trend direction, a candlestick signal, and a Fibonacci level — you have a far stronger case than any one of them alone. That is the real payoff of learning price action: it combines cleanly with the other tools rather than competing with them.
Confluence does not guarantee a winner. It tilts the odds. Even a three-factor setup should risk no more than 1% and use a defined stop.
Frequently asked questions
What is price action trading in forex?
Price action trading is reading raw price movement — candlesticks, market structure, and support and resistance — to make trading decisions without relying on indicators. Instead of interpreting RSI or MACD, you read what buyers and sellers are doing directly on the candles, using patterns like pin bars and engulfing candles at key levels to time entries.
Is price action trading good for beginners?
Yes, in the sense that the concepts are intuitive and the charts stay clean. A beginner can learn candlesticks, structure, and support/resistance in a few weeks. But intuitive does not mean easy to profit from — it is discretionary, so consistency takes practice. Start on a demo account and trade H1 or higher before risking real money.
Can you trade forex with price action alone, without indicators?
Yes — many traders use “naked” charts with only candlesticks and drawn levels. Price action is self-contained because every indicator is derived from price anyway. That said, most consistent traders add one confluence factor — a moving average for trend or Fibonacci for pullbacks — to make discretionary calls more objective. Pure price action works, but it demands more discipline.
What are the most important price action patterns?
The three that matter most for beginners are the pin bar (a long-wick rejection candle), the inside bar (a compression/breakout pattern), and the engulfing candle (a decisive shift where one candle’s body swallows the prior one). Traded at a support or resistance level in the direction of the trend, these three cover the majority of high-probability setups.
How do you read price action on a chart?
Work top-down, starting with market structure: higher highs and lows mean an uptrend, lower highs and lows a downtrend. Next, mark the clearest support and resistance levels. Then watch the candlesticks at those levels — long wicks show rejection, large bodies show conviction. A signal candle at a level, aligned with the trend, is your setup.
Is price action trading profitable, and does it really work?
Price action can be profitable, but it is a skill, not a shortcut — no method wins every trade. It works because levels and candlestick behaviour reflect real supply and demand. Profitability comes from combining it with strict risk management: risking 1% per trade, using a defined stop, and aiming for at least a 1:2 risk-to-reward. Expect losses along the way.
What time frame is best for price action trading?
H1, H4, and D1 are the sweet spot for beginners. Higher timeframes produce cleaner, more reliable signals because each candle represents more trading activity and less noise. M5 and M1 fire far more false signals, and spread eats into tight stops. Learn the method on H4/D1, then only drop lower once you trade consistently.
How do you set a stop loss in price action trading?
Place the stop a few pips beyond the pattern’s extreme — below the low of a bullish pin bar or engulfing candle, above the high of a bearish one. Then size the position so that stop-out costs no more than 1% of your account. On XAU/USD, widen the stop by roughly 1.5 times, because gold’s longer wicks sweep tight stops.
Forex and CFD trading carries a high level of risk and may not be suitable for all traders. The strategies and patterns described in this article are educational. Past performance does not guarantee future results. Always test on a demo account before risking real capital.
Price action trading strips the chart back to what actually moves the market: buyers and sellers reacting at levels. Learn candlesticks, read structure, mark clean support and resistance, and trade a few reliable patterns with strict 1% risk. Add one confluence factor when you are ready, keep a stop on every trade, and let the skill compound. It is the most transferable edge in trading — and it starts with a clean chart.
