


Last updated:
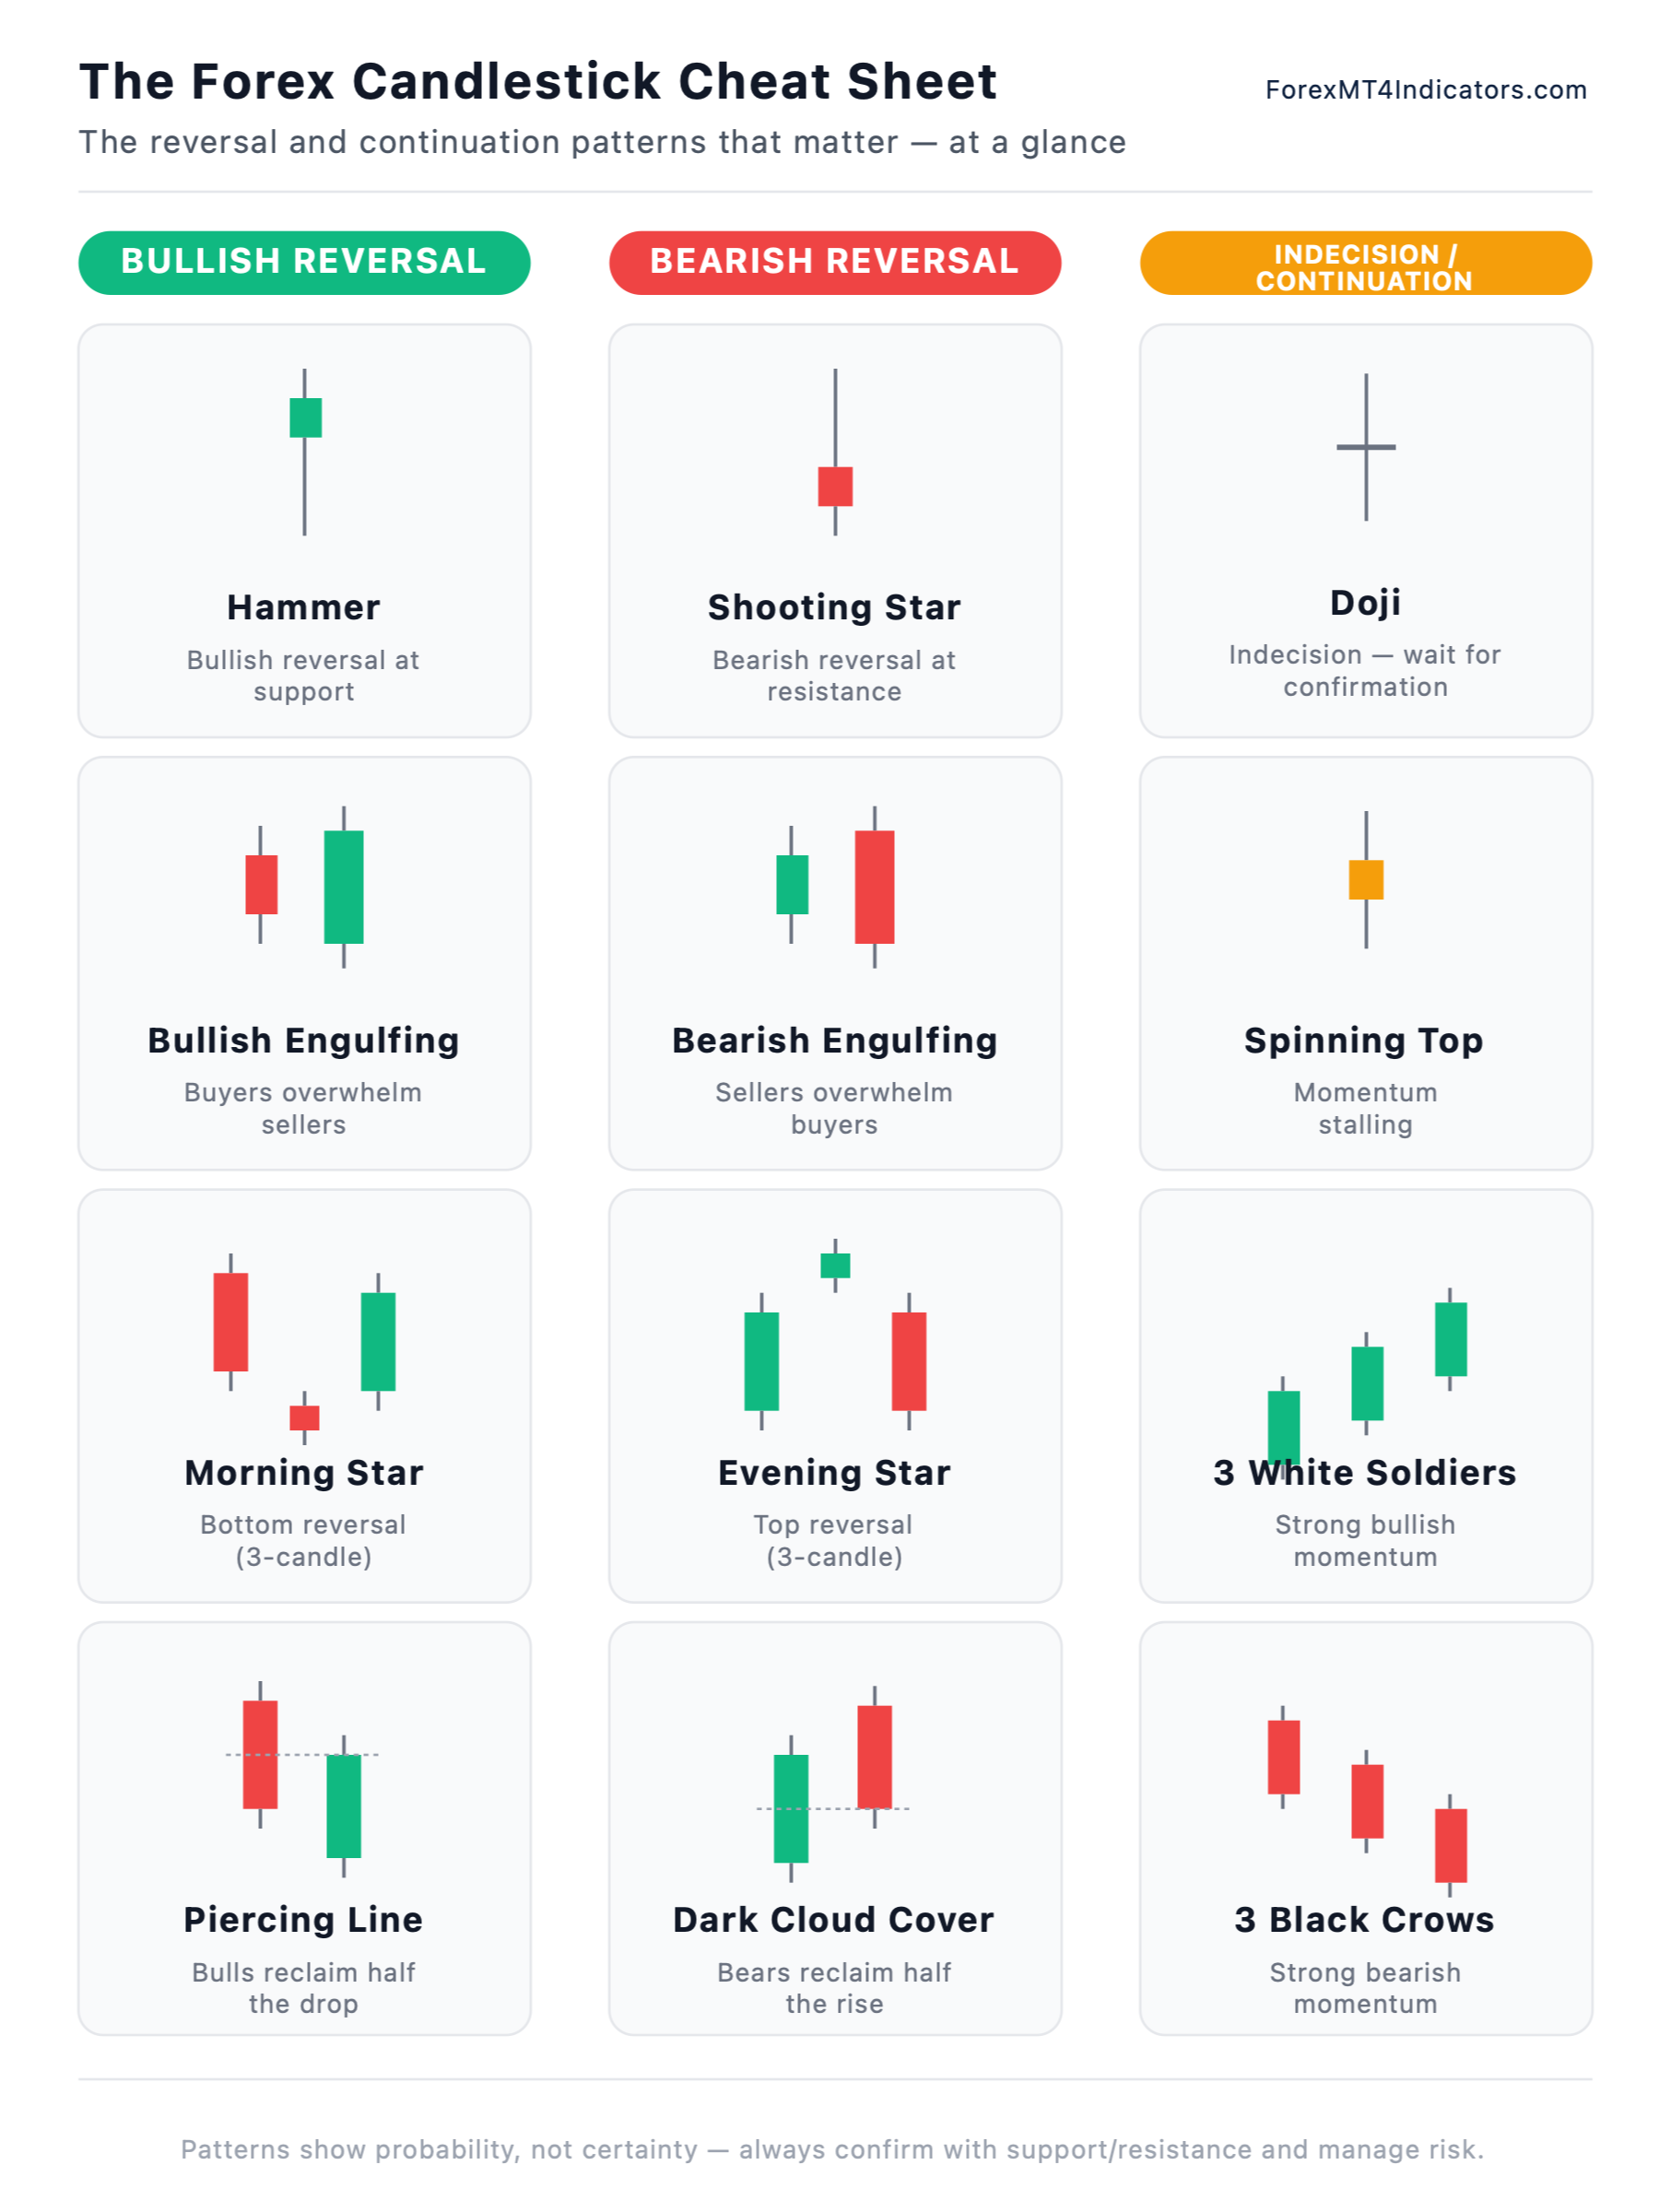

Forex candlestick patterns are shapes that one, two, or three candles form on a price chart to signal a possible reversal, continuation, or indecision. Each shape reads the balance of power between buyers and sellers through the candle body and wicks. Common examples include the Doji, Hammer, Pin Bar, Engulfing pattern, and Morning and Evening Star.
Key takeaways
- A candlestick shows four prices for one period (open, high, low, close). The body is the open-to-close range; the wicks (shadows) are the extremes beyond it.
- Patterns fall into three families: bullish reversal (Hammer, Bullish Engulfing, Morning Star, bullish Pin Bar), bearish reversal (Shooting Star, Bearish Engulfing, Evening Star, bearish Pin Bar), and continuation or indecision (Marubozu, Doji variants).
- The three shapes every trader learns first are the Doji (indecision), the Hammer (bullish reversal), and the Engulfing pattern (reversal in either direction).
- Location decides meaning. A Hammer at the bottom of a downtrend is bullish; the identical shape at the top of an uptrend is a Hanging Man and bearish.
- No pattern is a guarantee. Reliability is context-dependent: it rises at support or resistance with confirmation, and falls when a shape floats in open space.
- On XAU/USD (gold), long wicks are normal, so single-candle patterns fire more false signals. Demand extra confirmation.
- You can auto-detect these shapes with a free candlestick pattern indicator in MT4 or MT5 instead of scanning charts by eye.
This page is the reference: what each pattern is, how to spot it, where it works, and how to turn a shape into a trade. Read it top to bottom the first time, then keep it open as a lookup while you practise on live charts.
How to read candlesticks
A candlestick is a single mark that records four prices for one slice of time: the open, the high, the low, and the close. Read those four points and you have read the candle. Its shape tells you who controlled that period, buyers or sellers.
The body is the block between the open and the close, and the wicks (also called shadows) are the thin lines that reach to the high and the low. A green or white candle closed above its open, so buyers won the period. A red or black candle closed below its open, so sellers won.
Every candle covers one unit of your chart’s timeframe, whether that is five minutes, one hour, or one day. Higher timeframes such as H1, H4, and D1 carry more weight than M1 or M5, where spread and noise blur the picture. The anatomy section below labels each part so you can name what you are seeing.
Anatomy of a candlestick
Before any pattern makes sense, get fluent with a single candle. Every pattern in this guide is two, three, or four of these stacked in a recognisable order. A candle has three parts worth naming.
- The body is the open-to-close range. A long body means one side dominated the period; a short body means buyers and sellers fought to a draw.
- The upper wick runs from the top of the body to the high. A long upper wick means sellers rejected higher prices.
- The lower wick runs from the bottom of the body to the low. A long lower wick means buyers rejected lower prices.
Here is the read most beginners get wrong: a long wick is a rejection, not a continuation. When you see a long lower wick, sellers tried to push price down during that period and failed. That failure is often more informative than the body itself.
The single most important rule is that location decides meaning. The same shape is bullish at the bottom of a downtrend and meaningless in the middle of a range. If the wider picture is still fuzzy, our beginner’s guide to technical analysis covers trend, structure, and support or resistance first.
Bullish reversal patterns
These form after a downtrend and hint that sellers are losing control, the bullish side of the broader family of reversal candlestick patterns. The key word is hint: they signal a possible turn, not a certainty, and only carry weight at the bottom of a move or at a support level.
Hammer
A Hammer is a single candle with a small body near the top and a long lower wick, at least twice the body length, with little or no upper wick. It appears at the bottom of a downtrend. The story is simple: sellers drove price down hard during the period, then buyers stepped in and pushed the close back up near the open.
That rejection of lower prices is the bullish tell. A green Hammer is marginally stronger than a red one, but the shape matters more than the colour. Example: on EUR/USD H1, price has fallen for six candles, then the seventh dips 40 pips and closes only 5 pips below its open, leaving a long lower wick. That is a Hammer, and it warns the downtrend may be exhausting.
Bullish Pin Bar
A Pin Bar (pinocchio bar) is close kin to the Hammer: a single candle with a small body and one long wick that sticks out from the surrounding price. A bullish Pin Bar has its long wick pointing down, rejecting lower prices. The difference from a strict Hammer is looseness, since a Pin Bar can have a small opposite wick and the body can sit slightly off-centre.
Traders use “Pin Bar” as the broad price-action label, while a Hammer is the strict version at a downtrend bottom. Swing traders build entire setups around it, as our pin bar swing trading strategy walks through with entries and stops. Every Hammer is a bullish Pin Bar, but a Pin Bar can appear anywhere and point either way.
Bullish Engulfing
A Bullish Engulfing pattern is two candles: a smaller bearish (red) candle, then a larger bullish (green) candle whose body fully engulfs the prior candle’s body. The green body opens at or below the previous close and closes at or above the previous open. It shows a sharp swing from selling to buying in a single period.
Note that it is body engulfment that matters, not the wicks. The bigger the engulfing candle relative to the one it swallows, the stronger the signal. A green candle that barely covers a tiny red one is weak, while one that dwarfs the prior body at support is one of the more dependable two-candle reversals.
Morning Star
A Morning Star is a three-candle bottom reversal: a long bearish candle, then a small-bodied candle (the “star,” often a Doji) that stalls, then a long bullish candle that closes well into the first candle’s body. The middle candle is the pivot, marking the moment selling momentum stalled.
The third candle confirms buyers have taken over. Because it needs three candles to complete, it is slower to form but generally more reliable than a single Hammer.
Three White Soldiers
Three White Soldiers is three consecutive long bullish candles, each opening within the prior candle’s body and closing near its high. It signals strong, sustained buying after a downtrend or a stretch of consolidation.
The pattern’s strength is also its trap. By the time all three have printed, much of the move may be spent, so chasing the third candle often means buying near a short-term top. Wait for a pullback rather than entering on the third soldier.
Bearish reversal patterns
These are the mirror images. They form after an uptrend and warn that buyers may be exhausted. Trade them only near the top of a move or at resistance.
Shooting Star
A Shooting Star is a single candle with a small body near the bottom and a long upper wick, at least twice the body length, at the top of an uptrend. The long upper wick shows buyers pushed price up, then sellers rejected it back down. It is the bearish mirror of the Hammer.
Hanging Man
A Hanging Man shares the Hammer’s shape, a small body with a long lower wick, but appears at the top of an uptrend. The lower wick shows sellers tested lower prices mid-uptrend, a first crack in buyer control. Same shape as a Hammer, opposite location, opposite meaning, which is proof that context is everything. It needs bearish confirmation on the next candle to be trusted.
Bearish Pin Bar
A bearish Pin Bar is the Pin Bar with its long wick pointing up, rejecting higher prices at the top of a move or at resistance. The Shooting Star is the strict version of a bearish Pin Bar. As with its bullish twin, the tell is a single long wick that stands out from the candles around it.
Bearish Engulfing
A Bearish Engulfing pattern reverses its bullish twin: a smaller bullish (green) candle followed by a larger bearish (red) candle whose body fully engulfs it. It appears at the top of an uptrend or at resistance, showing sellers overwhelmed buyers in a single period.
Example: on XAU/USD H1 after a run-up, a small green candle prints, then the next candle opens near that green candle’s close and sells off hard, closing below its open, its red body fully swallowing the prior green body. That is a Bearish Engulfing at resistance.
Evening Star
An Evening Star is the Morning Star flipped: a long bullish candle, a small-bodied star that stalls, then a long bearish candle closing deep into the first candle’s body. It marks a three-candle top reversal where buying momentum stalled and sellers took control.
Three Black Crows
Three Black Crows is three consecutive long bearish candles, each opening within the prior body and closing near its low. It signals sustained selling after an uptrend. Like Three White Soldiers, the risk is entering late, since much of the drop may already be spent by the third crow.
Dark Cloud Cover
Dark Cloud Cover is a two-candle top pattern: a strong bullish candle followed by a bearish candle that opens above the prior high but closes below the midpoint of the first candle’s body. That close past the halfway mark is the key. A bearish candle that only dips slightly into the prior body does not qualify, and the pattern is a softer warning than a full Bearish Engulfing.
Continuation and indecision patterns
Not every pattern reverses a trend. Some mark strong conviction in the current direction, and others mark a pause where neither side wins. These are the shapes you read between the reversals.
Marubozu
A Marubozu is a single candle with a full body and little or no wick on either end, so the open and close sit at or right up against the high and low. A bullish Marubozu (opens at the low, closes at the high) shows buyers controlled the entire period; a bearish Marubozu shows sellers did.
The marubozu candlestick pattern signals strong conviction and often appears mid-trend as a continuation cue: the side in control is still firmly in control. A bullish Marubozu inside an uptrend says the buyers have not tired.
Doji
A Doji is a candle where the open and close are almost exactly equal, leaving a tiny or non-existent body with wicks on one or both sides. It looks like a cross or a plus sign, and it means neither buyers nor sellers won the period. A Doji on its own is not a signal; it is a pause.
Its meaning comes from what surrounds it. A Doji after a long uptrend, at resistance, warns momentum is fading, while the same Doji in the middle of a quiet range means nothing. Three variants are worth knowing.
- Dragonfly Doji: long lower wick, with open, close, and high all near the top. A bullish rejection of lower prices, like a Hammer’s cousin.
- Gravestone Doji: long upper wick, with open, close, and low all near the bottom. A bearish rejection of higher prices.
- Long-legged Doji: long wicks both ways. Maximum indecision, a coin-flip candle.
The practical rule: treat a Doji as a warning to wait for the next candle, not as an entry. The candle after the Doji usually tells you which side finally won.
Spinning Top
A Spinning Top is a small body with upper and lower wicks of roughly equal length. Like the Doji, it signals indecision, but with a real (if small) body, so one side edged ahead. It carries the same message: the current push is losing steam, so wait for the next candle to confirm direction.
Inside Bar
An inside bar is a candle whose entire range, high to low, sits within the previous candle’s range. It marks a pause where price coils inside the prior bar’s extremes, often before the trend resumes. Traders treat a break of the larger “mother bar” as the trigger, a setup covered in our inside bar price action strategy.
Rising and Falling Three Methods
The Rising Three Methods (and its bearish twin, Falling Three Methods) is a long trend candle, then a few small counter-trend candles that stay inside the first candle’s range, then another long candle in the original direction. It is the market catching its breath, not turning. For beginners this is lower priority than reversals: if you can spot a healthy pullback inside a trend, you have most of the practical value without memorising every name.
Most reliable patterns and how to confirm
Traders always ask which candlestick pattern is “most reliable.” The honest answer is that reliability is not a property of the shape alone. It is a property of the shape plus its context, so the same Hammer is a high-quality signal at a support level and noise in open space.
That said, some patterns tend to be more dependable than others because they show a fuller shift in control.
- Multi-candle patterns beat single candles. The Engulfing pattern and the three-candle Morning and Evening Star show a more complete handover of control than a lone Hammer or Doji.
- Bigger, cleaner shapes beat marginal ones. A large engulfing candle that dwarfs the one it swallows is stronger than one that barely clears it.
Three filters turn any pattern from a shape into a trustworthy read. First, trend context: a reversal pattern only matters at the end of a move, a Hammer at the bottom of a downtrend or a Shooting Star at the top of an uptrend. Second, level context: a pattern at a marked support or resistance zone, trendline, or Fibonacci level is far stronger than one floating in the middle of nowhere. Third, confirmation: wait for the next candle to agree before you treat the pattern as valid.
On XAU/USD (gold), apply these filters more strictly. Gold’s long, frequent wicks print Hammer- and Doji-like shapes constantly, many of them meaningless. On gold, demand a level and confirmation before trusting a single-candle pattern.
How to actually trade a candlestick pattern
This is where most traders go wrong. They spot a Hammer, buy immediately, and get stopped out. A pattern is a reason to look closer, not an automatic entry, and turning it into a trade takes three steps.
Wait for confirmation. A Bullish Engulfing at support is a signal; a bullish close on the following candle is confirmation. This one habit removes a large share of false starts, because a shape that looked decisive often unravels on the next bar. Patience here costs you a few pips of entry and saves you many losing trades.
Place the stop where the pattern is wrong. Put the stop immediately beyond the wick that defines the pattern, below a Hammer’s low or above a Shooting Star’s high. If price trades through that wick, the rejection failed and your reason for the trade is gone. A stop placed on structure, not on a round number, keeps you in valid trades and out of dead ones.
Size the position to your risk, not your hope. Set the position so that the distance to your stop risks no more than 1% of your account on the trade. Our free position size calculator does the maths from your entry, stop, and balance in a few seconds. Higher timeframes such as H1, H4, and D1 carry more weight than M1 or M5, where spread and noise produce constant false patterns, so learn the process on H1 and H4 first.
Candlestick and support, resistance, and Fibonacci confluence
The single biggest upgrade to your candlestick trading is to stop reading candles in isolation and start reading them at levels. A reversal candle only matters where a reversal is plausible, so the level does half the work before the candle even prints. Build the confluence in three layers.
First, mark the level before you look for candles. Draw your support and resistance zones or a Fibonacci retracement first, so the level tells you where to expect a reaction. Second, wait for the candle at the level. A Bullish Engulfing that forms exactly at a support zone or a 61.8% Fibonacci retracement is a high-quality signal, while the same candle away from any level is not.
Third, confirm and enter. Only after the pattern completes at the level, and the next candle agrees, do you take the trade. This overlap of unrelated signals is the core idea behind price action trading, and it is the difference between “I saw a Hammer” and “I saw a Hammer reject a Fibonacci level that also lines up with prior support.” The second is a plan; the first is a hope.
Common mistakes when trading candlesticks
Most losing candlestick trades come from a short list of avoidable errors. Scan this before every trade.
- Trading the pattern anywhere. A Hammer only matters at the bottom of a downtrend or at support. The fix: mark your levels first, then look for candles at them.
- Entering without confirmation. Buying the instant a pattern appears, before the next candle confirms, catches every fakeout. The fix: wait one candle.
- Ignoring the trend. Fading a strong trend on a single reversal candle is a fast way to lose. The fix: prefer reversals into the higher-timeframe trend, or wait for structure to break.
- Trusting M1 and M5 patterns. On low timeframes, spread and noise print false patterns constantly. The fix: learn on H1 and H4 first.
- Chasing three-candle patterns late. Buying the third soldier or selling the third crow often means entering after the move. The fix: wait for a pullback.
- Forgetting a stop. A pattern can fail, and gold or news candles can run far. The fix: always place a stop beyond the pattern’s defining wick and size to a 1% risk.
Get a candlestick pattern indicator
Scanning dozens of charts by eye for a single Doji is slow and easy to get wrong. A candlestick pattern indicator labels the shapes on your chart automatically, so you spend your time judging context rather than spotting shapes.
For MetaTrader 5, the free Japanese candlestick patterns indicator labels Hammers, Engulfing patterns, Dojis, and Stars directly on the price bars. There is an equivalent Forex Candlestick Patterns MT4 Indicator for MT4 users, so you can auto-detect the same shapes on either platform.
One honest caveat: an indicator finds the shape, not the setup. It will flag every Hammer, including the ones in open space that you should ignore. Use it as a first filter that saves your eyes, then apply the trend, level, and confirmation checklist above before acting on anything it marks. Candlestick patterns are one piece of a wider toolkit, so see how they sit alongside oscillators and moving averages in our guide to using indicators for forex analysis.
Keep a candlestick cheat sheet nearby
A printable cheat sheet is the fastest way to build recall. Our free candlestick pattern cheat sheet lays out every reversal, indecision, and continuation pattern in one place: the shape, what it means, and where it works. Keep it beside your charts for the first few months and check every pattern against it until the shapes are automatic.
If you want a printable, quiz-style version to drill recognition away from the screen, The Candlestick Playbook ebook ($27) packages the same patterns as a reference you can print and mark up. It is an optional next step, not a requirement, since the cheat sheet page already covers the shapes for free.
For traders who would rather watch the patterns applied on live charts, The Price Action Masterclass ($97) is a video course that shows candlesticks read at levels in real setups. Treat it as a secondary option once you can name the shapes cold. Neither product changes the core skill, which is repetition and reading context.
Forex and CFD trading carries a high level of risk and may not be suitable for all traders. The strategies and indicators described in this article are educational. Candlestick patterns are probabilities, not certainties, and no pattern guarantees a result. Past performance does not guarantee future results. Always test on a demo account before risking real capital.
Frequently asked questions
What are forex candlestick patterns?
Forex candlestick patterns are shapes that one to three candles form on a price chart, each hinting at a possible reversal, continuation, or indecision. They read the balance between buyers and sellers through the body (open-to-close) and the wicks (rejected highs and lows). Common ones include the Doji, Hammer, Pin Bar, Engulfing pattern, and Morning and Evening Star.
What are the 3 basic candlestick patterns?
The three every trader learns first are the Doji (open and close nearly equal, signalling indecision), the Hammer (small body, long lower wick at a bottom, a bullish reversal), and the Engulfing pattern (a large candle whose body swallows the previous one, a reversal in either direction). Master these before the multi-candle patterns.
What is a Doji and what does it mean?
A Doji is a candle where the open and close are almost equal, leaving a tiny body and a cross-like shape. It means neither buyers nor sellers won, so the market is undecided. On its own it is a pause, not a signal. Its meaning depends on context: a Doji at resistance after an uptrend warns momentum is fading.
What is the difference between a Pin Bar and a Hammer?
A Pin Bar is a candle with a small body and one long wick that sticks out from surrounding price, showing that side’s move was rejected. A Hammer is a stricter kind of Pin Bar: small body, long lower wick, at the bottom of a downtrend. Every Hammer is a bullish Pin Bar, but a Pin Bar can appear anywhere and point either way.
What is the most reliable candlestick pattern?
No single pattern is “most reliable” in isolation, because reliability comes from context. That said, the Engulfing pattern and the three-candle Morning and Evening Star tend to be more dependable than single candles, since they show a fuller shift in control. Any pattern’s reliability rises sharply when it forms at support or resistance with confirmation from the next candle.
How do you confirm a candlestick pattern before trading?
Wait for the next candle to agree with the pattern before entering, for example a bullish close after a Bullish Engulfing. Add confluence: the pattern should sit at a support or resistance level, a trendline, or a Fibonacci level. Higher timeframes such as H1 and H4 confirm more reliably than M1 or M5, where noise creates false patterns.
Do candlestick patterns work in forex?
Yes, but as probabilities, not guarantees. Candlestick patterns describe shifts in buyer and seller control that often precede moves, but they fail regularly when read alone. They work best as one input alongside trend, support and resistance, and confirmation. On volatile instruments like gold, they throw more false signals, so demand extra confirmation.
What is the best timeframe for candlestick patterns?
H1 and H4 are the best starting point for most traders, high enough to filter spread noise and low enough to give regular patterns. D1 patterns carry the most weight but appear slowly. Avoid M1 and M5 while learning, because spread and noise print constant false patterns that teach the wrong lessons.
Ready to put this into practice?
Open an account with a regulated broker and apply what you have learned. These are the three brokers we recommend:
Trading forex and CFDs carries a significant risk of loss and is not suitable for everyone. Broker links are affiliate links — we may earn a commission at no cost to you.

Utile , semplice e chiaro: grazie
Thank you 🙂 Hope you learn something from here.
thanks for simplifying it