


ICT killzones are specific intraday time windows — always quoted in New York time (ET) — when institutional order flow and volatility tend to concentrate, so ICT traders hunt their setups there instead of watching the clock all day. The four canonical windows are the Asian, London, New York and London Close killzones. Treat them as high-probability periods, not precise magic hours.
What ICT killzones are
A killzone is a block of hours on the intraday clock where price tends to move with more speed and cleaner intent than in the quiet stretches around it. The idea comes from Michael J. Huddleston, better known as The Inner Circle Trader (ICT), whose material popularised the term. The logic is straightforward: liquidity and volatility are not spread evenly across the 24-hour forex day. They bunch up around the major session opens, when banks, funds and other large participants are most active. A killzone is simply a name for one of those busy bands.
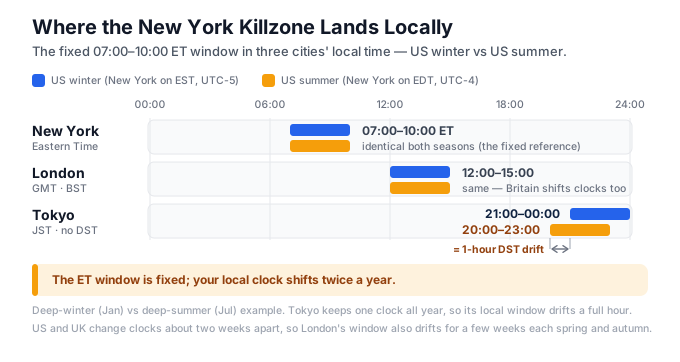
There are four canonical killzones, and every one of them is quoted in New York local time (America/New_York, ET). This matters more than any other single fact on this page. The window follows the US clock, so it stays fixed in ET while its equivalent in London, Tokyo or Sydney shifts by an hour whenever US daylight saving flips — EST in winter, EDT in summer. Quote a killzone without stating the timezone and the numbers are meaningless.
The four windows, in ET:
- London killzone — approximately 02:00–05:00 ET. This catches the European open, historically the most active session for EUR and GBP pairs.
- New York killzone — approximately 07:00–10:00 ET. A common variant instead uses 08:30–11:00 ET, built around the New York equity open and the 08:30 and 10:00 news releases.
- London Close killzone — approximately 10:00–12:00 (noon) ET, covering the late-morning fade as London winds down and often reverses part of the day’s move.
- Asian killzone — most commonly 20:00–00:00 ET (8pm to midnight). Some ICT sources cite 19:00–22:00 ET (7–10pm) instead. ICT treats the tight overnight range this session builds as a liquidity pool that London and New York later run.
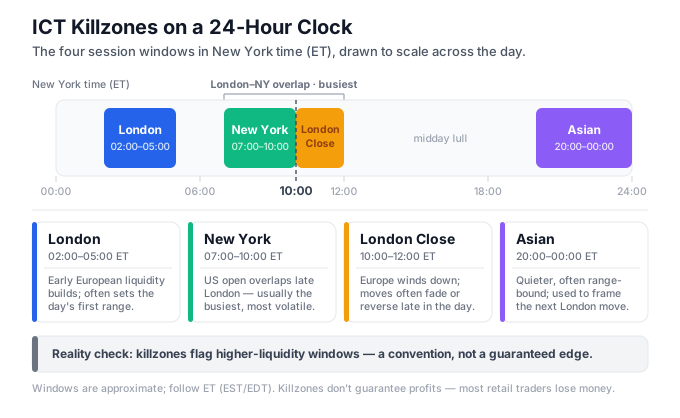
Notice the disagreement in those numbers. That is deliberate on our part — different ICT teaching materials genuinely quote different minutes, and the New York killzone alone has two widely used definitions. The honest way to read this is that a killzone is an approximate high-volatility band, not a precise switch that flips at a single timestamp. If your whole plan depends on 07:00:00 rather than 07:04, you have misunderstood what the tool is.
One narrower idea often gets confused with killzones: the ICT Silver Bullet. The ICT Silver Bullet is a fixed one-hour window — most commonly the New York AM window, 10:00–11:00 ET. Note it begins exactly where this article’s primary New York Open killzone (07:00–10:00 ET) ends, so it overlaps the London Close killzone (10:00–12:00 ET); it falls inside the New York killzone only under the wider 08:30–11:00 ET variant some ICT traders use. Treat it as a high-focus hour adjacent to the NY Open, not a separate session. The killzone is the container — a broad window where you pay attention; the Silver Bullet is one named setup you might find within or beside it.
Killzones are a discretionary filter within the wider Smart Money Concepts framework, not a standalone system. They tell you when to look. They do not tell you what to do, and they certainly do not guarantee a move.
How to spot a killzone setup
The first job is not analysis, it is calibration. Set your chart clock to New York time. Every ICT killzone is quoted in ET, and the ET window tracks US daylight saving automatically. If you re-anchor the numbers to London time or your own local zone, you will be marking the wrong hours for half the year without noticing. Get this wrong and nothing else on this page will line up.
With the clock set, mark the four boxes on your day. A session or killzone indicator can shade them for you so you are not eyeballing the vertical grid — our MT5 trading sessions indicator draws session and killzone windows straight onto the chart. If you would rather understand the underlying session mechanics first, the plain-English breakdown in forex sessions explained covers when each market opens and why the overlaps matter.
Then watch the sequence unfold, in this order:
- Let the Asian killzone build its range. Overnight, price usually coils into a tight band. ICT treats the high and low of that range as a pool of resting orders — the stops of everyone who traded the range edges.
- Inside the London or New York box, wait for a sweep. Look for price spiking past an obvious level — the previous day’s high or low, the session high or low, or the edge of that Asian range — and then rejecting. That spike-and-reject is a liquidity sweep, and it is the event a killzone is built to catch.
- Look for the structure shift. After the sweep, you want price to break the most recent swing in the opposite direction — a genuine change in market structure. This is the difference between a break of structure and a change of character, and it is the part that actually carries information. The displacement candle that breaks structure is the signal; the time of day is only the filter.
- Find the imbalance it left behind. Fast, one-sided moves leave gaps. Mark the fair value gap or order block that the displacement created — that is your likely entry zone on the pullback. (If you are unsure how an FVG differs from a plain price gap, imbalance vs FVG draws the line.)
- Check the volatility is real. A killzone with flat, thin candles and no clean sweep is giving you no edge that session, whatever the clock says. No setup means no trade. This is the single most-ignored rule.
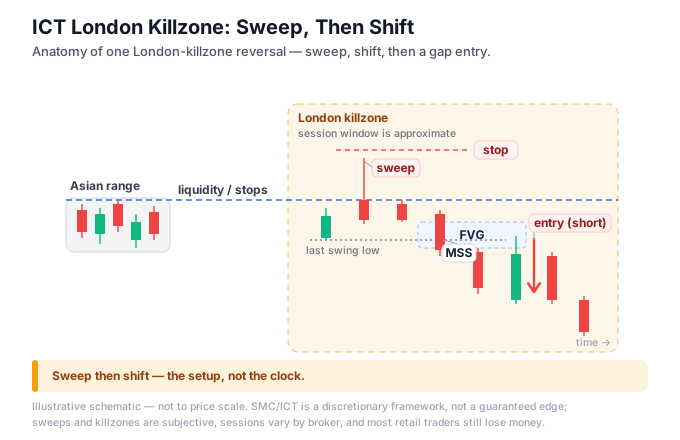
The sweep frequently targets the sort of obvious level thousands of traders already watch — an old swing high, a round number, a pair of equal highs or lows. Those levels are exactly where retail stops cluster, which is why price is drawn to them. That is also the honest mechanic behind the whole thing, and it is worth being blunt about it in the next section.
How to trade or use a killzone
Use the killzone as a filter, not a trigger. The window tells you when to be at the screen. Your entry still needs a real reason inside the box: a sweep, a structure shift, and an FVG or order block to enter against. Entering at 07:00 ET simply because it is 07:00, with no sweep and no shift, is betting on a timestamp.
Pick the killzone that fits your pairs and your hours. London (02:00–05:00 ET) favours EUR and GBP crosses. The New York killzone (07:00–10:00 ET) favours USD pairs and overlaps London until roughly 05:00 ET. If you trade cable and live in Europe, London probably suits you; if you trade USD pairs on a US schedule, New York does. Do not force yourself to trade every window — most traders should specialise in one.
Define risk before you enter, never after. Put your stop beyond the swept high or low — the level price just rejected from — and size the position so a stop-out costs a fixed, small fraction of the account, commonly 0.5–1%. Killzones concentrate volatility, and volatility cuts both ways: the bigger moves that make the setup attractive also make a wrong entry more expensive. If position sizing is new to you, fold it into a written trading plan before you risk money, and be clear on your entry mechanics — order types and whether you are going long or short — so nothing is improvised mid-session.
Respect scheduled news inside the New York AM window. The 08:30 and 10:00 ET releases sit right in the middle of the New York killzone. Spreads widen, spikes whipsaw, and a clean-looking sweep can be pure news noise. Plenty of traders wait for the data to process rather than trade into the release.
Convert timezones carefully if you are outside the US. The ET window is fixed, but its clock time in London (GMT/BST) or Tokyo (JST) shifts by an hour twice a year at the US daylight-saving changeovers. A hard-coded local-time box will silently drift an hour and quietly wreck both your live sessions and any backtest.
A worked example
Say you trade GBP/USD and specialise in the London killzone. Your chart is on New York time.
Overnight, the Asian session coils GBP/USD into a 25-pip range. You mark the range high at 1.2740. (If you need a refresher on what a pip is worth here, see what is a pip.) That high sits just above a level the previous day also respected, so you flag it as an obvious pool of resting stops — the sort of support-and-resistance level everyone can see.
At 02:40 ET, inside the London box, price accelerates up through 1.2740, prints 1.2748, and immediately rejects with a long upper wick. That is your sweep — it took the stops above the Asian high and found no follow-through. You do nothing yet.
At 02:55 ET, price breaks back below the last minor swing low at 1.2725. That is your structure shift, and the fast drop into it left a small fair value gap between 1.2734 and 1.2729. You now have a plan: sell a retracement into that FVG, stop above the 1.2748 sweep high (a 20-pip risk from ~1.2732), sized so the stop costs no more than 1% of the account. Price pulls back into the gap at 03:10 ET and you enter short.
Note what did the work here. Not the clock — the clock only told you to be watching London. The sweep of an obvious level, the shift in structure, and the imbalance were the actual signal. Change any one of those and there is no trade, regardless of the hour.
Common mistakes
Treating the exact minutes as magic hours. ICT sources disagree — Asian is quoted 20:00–00:00 by some and 19:00–22:00 by others; New York as 07:00–10:00 or 08:30–11:00. The window is an approximate band, not a precise switch. Trading it to the second is false precision.
Quoting killzones without a timezone. The numbers only mean anything in New York time. Most retail confusion comes from people applying ET numbers to their own local clock and marking the wrong hours entirely.
Ignoring daylight saving. The ET window stays put, but its UTC and local equivalent move an hour when US DST flips. A fixed local-time box misaligns for months and you may never spot it because the chart still “works” the other half of the year.
Believing the “banks are hunting YOUR stop” story. This is marketing, and it is worth saying plainly. Liquidity sits at obvious highs and lows because thousands of traders cluster their stops there — no desk knows or targets your individual order, and no desk needs to. Price is drawn to pooled liquidity, not to you personally. The related idea of inducement — an obvious-looking level set up to attract those stops — is a real, useful concept, but it is statistical and subjective, not a conspiracy aimed at your account.
Trading the clock instead of the setup. Entering because it is 07:00 ET, with no sweep and no structure shift, is gambling on a timestamp. The time is the least important part of the trade.
Assuming a killzone guarantees a move. Plenty of London and New York sessions are thin and directionless. The concentration of volatility is a statistical tendency, not a promise. And the harder truth underneath all of this: killzones are a discretionary filter, the setups are subjective, and most retail traders lose money regardless of when they trade. A better entry window does not fix a broken plan, poor risk control, or an untested edge.
How killzones fit the wider SMC framework
Killzones are a timing layer, and timing is only one part of the Smart Money Concepts toolkit. On their own they answer a single question — when is volatility most likely to show up — and nothing else. They carry no directional bias, no risk model, and no higher-timeframe context.
The framework becomes coherent only when the timing layer is combined with the structural pieces. You use the killzone to decide when to look. You use a liquidity sweep to identify the trigger, a change of character to confirm intent, and a fair value gap or order block to define the entry. You use premium and discount zones to judge whether price is expensive or cheap relative to the range you are trading. And underneath all of it sits the honest reading of what “smart money” actually means — large, patient participants leaving footprints in the order flow, not an omniscient cabal targeting individuals.
Automation can shade the windows and flag the imbalances, but it cannot make the discretionary calls for you. If you want the timing marked on your MT5 charts, the trading sessions indicator draws the killzone boxes; the structural reads still come down to your judgement. Treat killzones as what they are — a filter that narrows your attention to the hours where clean setups are more likely — and the rest of the SMC framework does the actual work. Backtest any of it before you believe it: run 50–100+ setups per killzone on your own pairs, with correct DST handling, because performance varies by instrument and window, and no session is a guaranteed edge.
Frequently asked questions
What are ICT killzones?
ICT killzones are specific intraday time windows, quoted in New York time, when institutional activity and volatility tend to concentrate. ICT traders focus their setups in these periods. The four canonical windows are the Asian, London, New York and London Close killzones — high-probability bands, not guaranteed or precise magic hours.
What are the ICT killzone times?
In New York time (ET): London killzone roughly 02:00–05:00, New York killzone roughly 07:00–10:00 (some use 08:30–11:00), London Close roughly 10:00–12:00, and the Asian killzone most commonly 20:00–00:00 (some sources say 19:00–22:00). Exact minutes vary between ICT sources — treat them as approximate.
What timezone are ICT killzones in?
All ICT killzones are quoted in New York local time (America/New_York, ET). The window follows US daylight saving automatically — EST in winter, EDT in summer — so its UTC and local-clock equivalent shifts by an hour at each changeover. Traders outside the US must convert and re-check that offset twice a year.
Do ICT killzones actually work?
Volatility genuinely does cluster around session opens, so killzones are a reasonable filter for when to look. But they are a statistical tendency, not a guaranteed edge, and many sessions are flat. Used alone they lack risk management and higher-timeframe context, and most retail traders lose money regardless of timing.
Which ICT killzone is best to trade?
There is no single best killzone — it depends on your pairs and your schedule. London (02:00–05:00 ET) suits EUR and GBP; the New York killzone (07:00–10:00 ET) suits USD pairs and overlaps London. Pick one that fits your instruments and waking hours rather than trading every window.
What is the difference between ICT killzones and the Silver Bullet?
The Silver Bullet is a specific 1-hour window (most commonly 10:00–11:00 ET), not a full killzone. Under this article’s primary NY Open killzone (07:00–10:00 ET) it sits just after that window and overlaps London Close (10:00–12:00 ET); it lands inside the NY killzone only under the 08:30–11:00 ET variant. Killzones are the broader 2–3 hour institutional-activity windows; the Silver Bullet is a narrower sub-window within/adjacent to them.
Ready to put this into practice?
Open an account with a regulated broker and apply what you have learned. These are the three brokers we recommend:
Trading forex and CFDs carries a significant risk of loss and is not suitable for everyone. Broker links are affiliate links — we may earn a commission at no cost to you.