


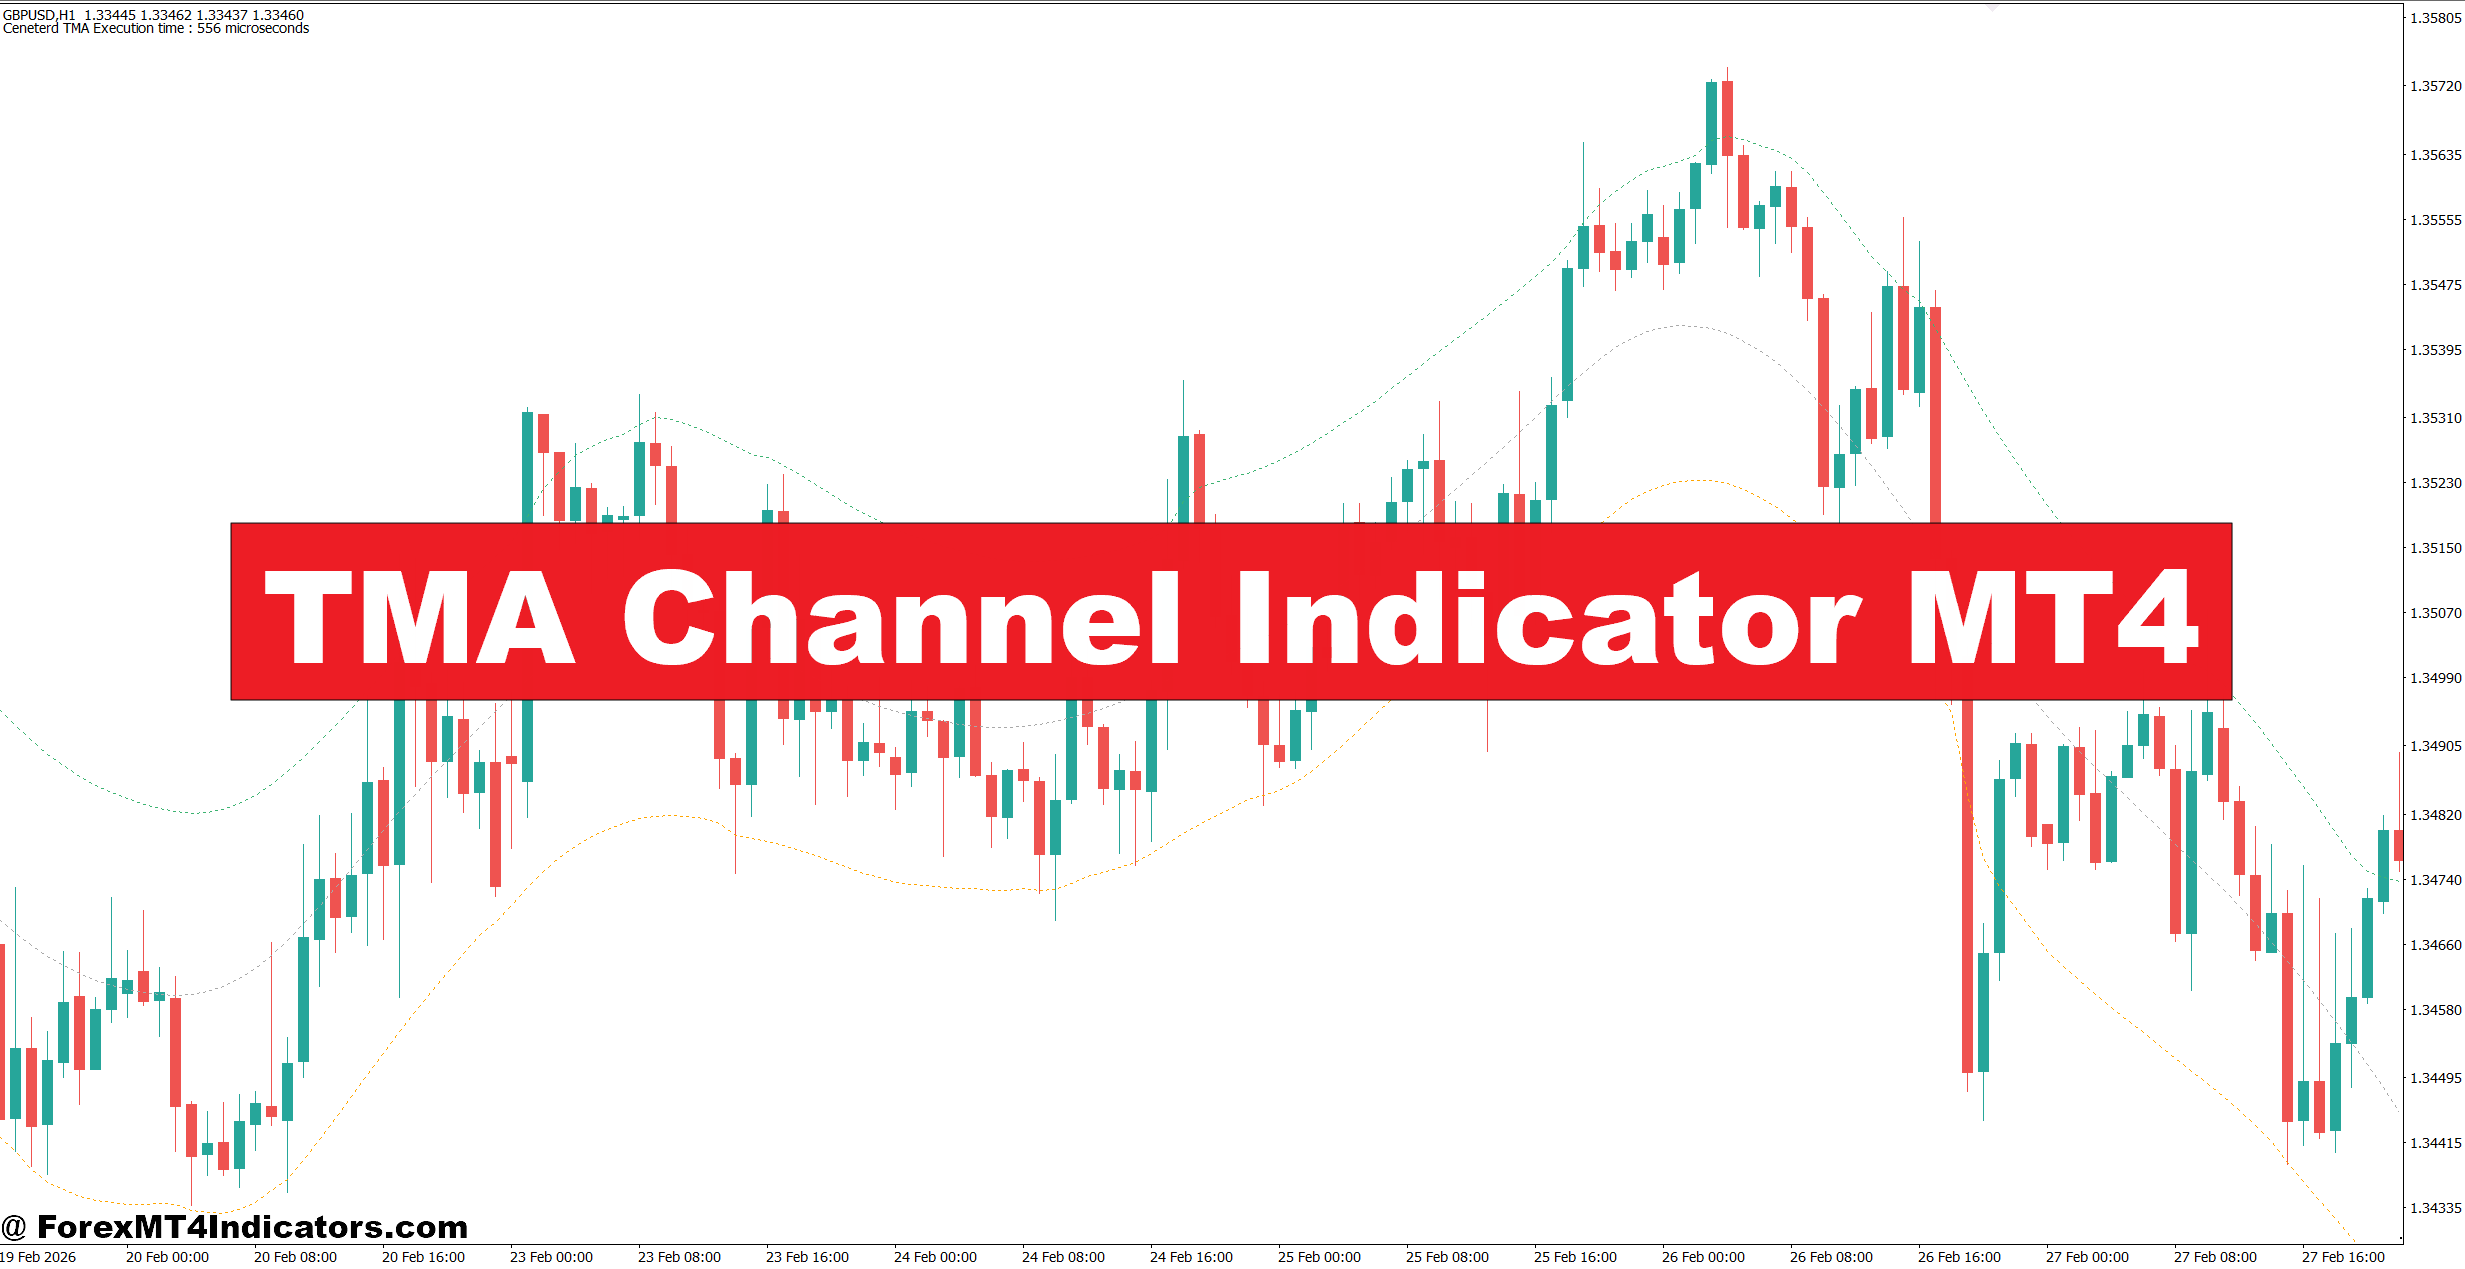
The TMA Channel Indicator MT4 is designed to give traders a clearer view of price movement by plotting a dynamic channel around a smoothed moving-average line. Instead of looking at candles alone, traders can use the channel to judge trend direction, pullbacks, volatility, and possible reversal areas. That can make trade planning more structured, especially on intraday charts.
But a channel is not a magic entry system. Its value depends on how traders combine it with price action, support and resistance, and sensible risk control. Here’s how the indicator works and where it fits into a practical forex strategy.
What Is the TMA Channel Indicator MT4?
The TMA Channel Indicator MT4 is a technical analysis tool that builds an upper and lower channel around a Triangular Moving Average (TMA). The middle line represents smoothed price, while the outer bands show a typical range around that central value.
A basic TMA calculation applies smoothing twice to price data. One way to describe it is through two moving-average operations:
TMA = SMA(SMA(Price, Period), Period)
The exact formula can vary between MT4 versions because some indicators use centered calculations, ATR-based channel widths, or other volatility adjustments. Traders should therefore check the specific indicator’s settings rather than assume every TMA Channel uses identical mathematics.
In practice, the middle line helps identify the broader price direction. The upper and lower boundaries then act as reference areas for pullbacks, extensions, and possible overextended moves.
For example, if EUR/USD trades above a rising middle TMA line on the 1-hour chart and repeatedly respects the lower channel during pullbacks, a trader may treat those reactions as evidence of bullish structure.
TMA Channel Settings for Different Markets
Settings matter because a channel that works well on EUR/USD during normal sessions may react differently on gold or GBP/JPY.
A common starting point is a 21-period TMA on an intraday chart. Traders testing the 15-minute timeframe might use 21 or 34 periods, while a 1-hour chart can often be tested with 34 or 50 periods for a smoother view.
Channel width also deserves attention. If the indicator uses an ATR multiplier, a setting around 1.5 to 2.0 ATR can provide a useful starting range. A smaller multiplier creates a tighter channel and more frequent touches. A larger multiplier produces fewer signals but may filter out some minor price swings.
Traders should avoid changing settings after every losing trade. That usually creates curve fitting rather than a better strategy. A more reliable approach is to test one configuration across at least 50–100 historical setups and then review how it behaves during trends, ranges, and high-volatility sessions.
NFP days deserve separate attention. When testing the indicator on volatile NFP releases, price can jump through both channel boundaries within minutes. Those moves can make a simple channel-touch strategy particularly vulnerable to fake-outs.
Advantages and Limitations of the TMA Channel
One useful feature is visual clarity. A trader can quickly see whether price is above, below, or moving around the central TMA line. The channel also provides natural reference points for pullback entries and potential profit targets.
Another advantage is flexibility. The indicator can support scalping on lower timeframes or broader trend analysis on the 1-hour and 4-hour charts. It can also work alongside market structure rather than replacing it.
But there is a major limitation: some TMA indicators can repaint or shift their historical channel values, especially versions based on centered calculations. This happens because centered smoothing may use information from bars on both sides of a historical point. A channel that looks perfect in hindsight may not have appeared that way in real time.
That issue should never be ignored. Traders should determine whether their particular TMA version repaints before using it with real money. A simple forward test on a demo account can reveal how signals behave as new candles form.
The indicator can also perform poorly during sideways markets. If EUR/USD spends several hours moving inside a 25-pip range, price may cross the middle line repeatedly. Those signals can create a string of small losses.
Risk management remains essential. A trader might risk 0.5%–1% of account equity per trade, use a stop beyond a meaningful swing point, and avoid increasing position size after a loss.
TMA Channel vs Bollinger Bands and Moving Averages
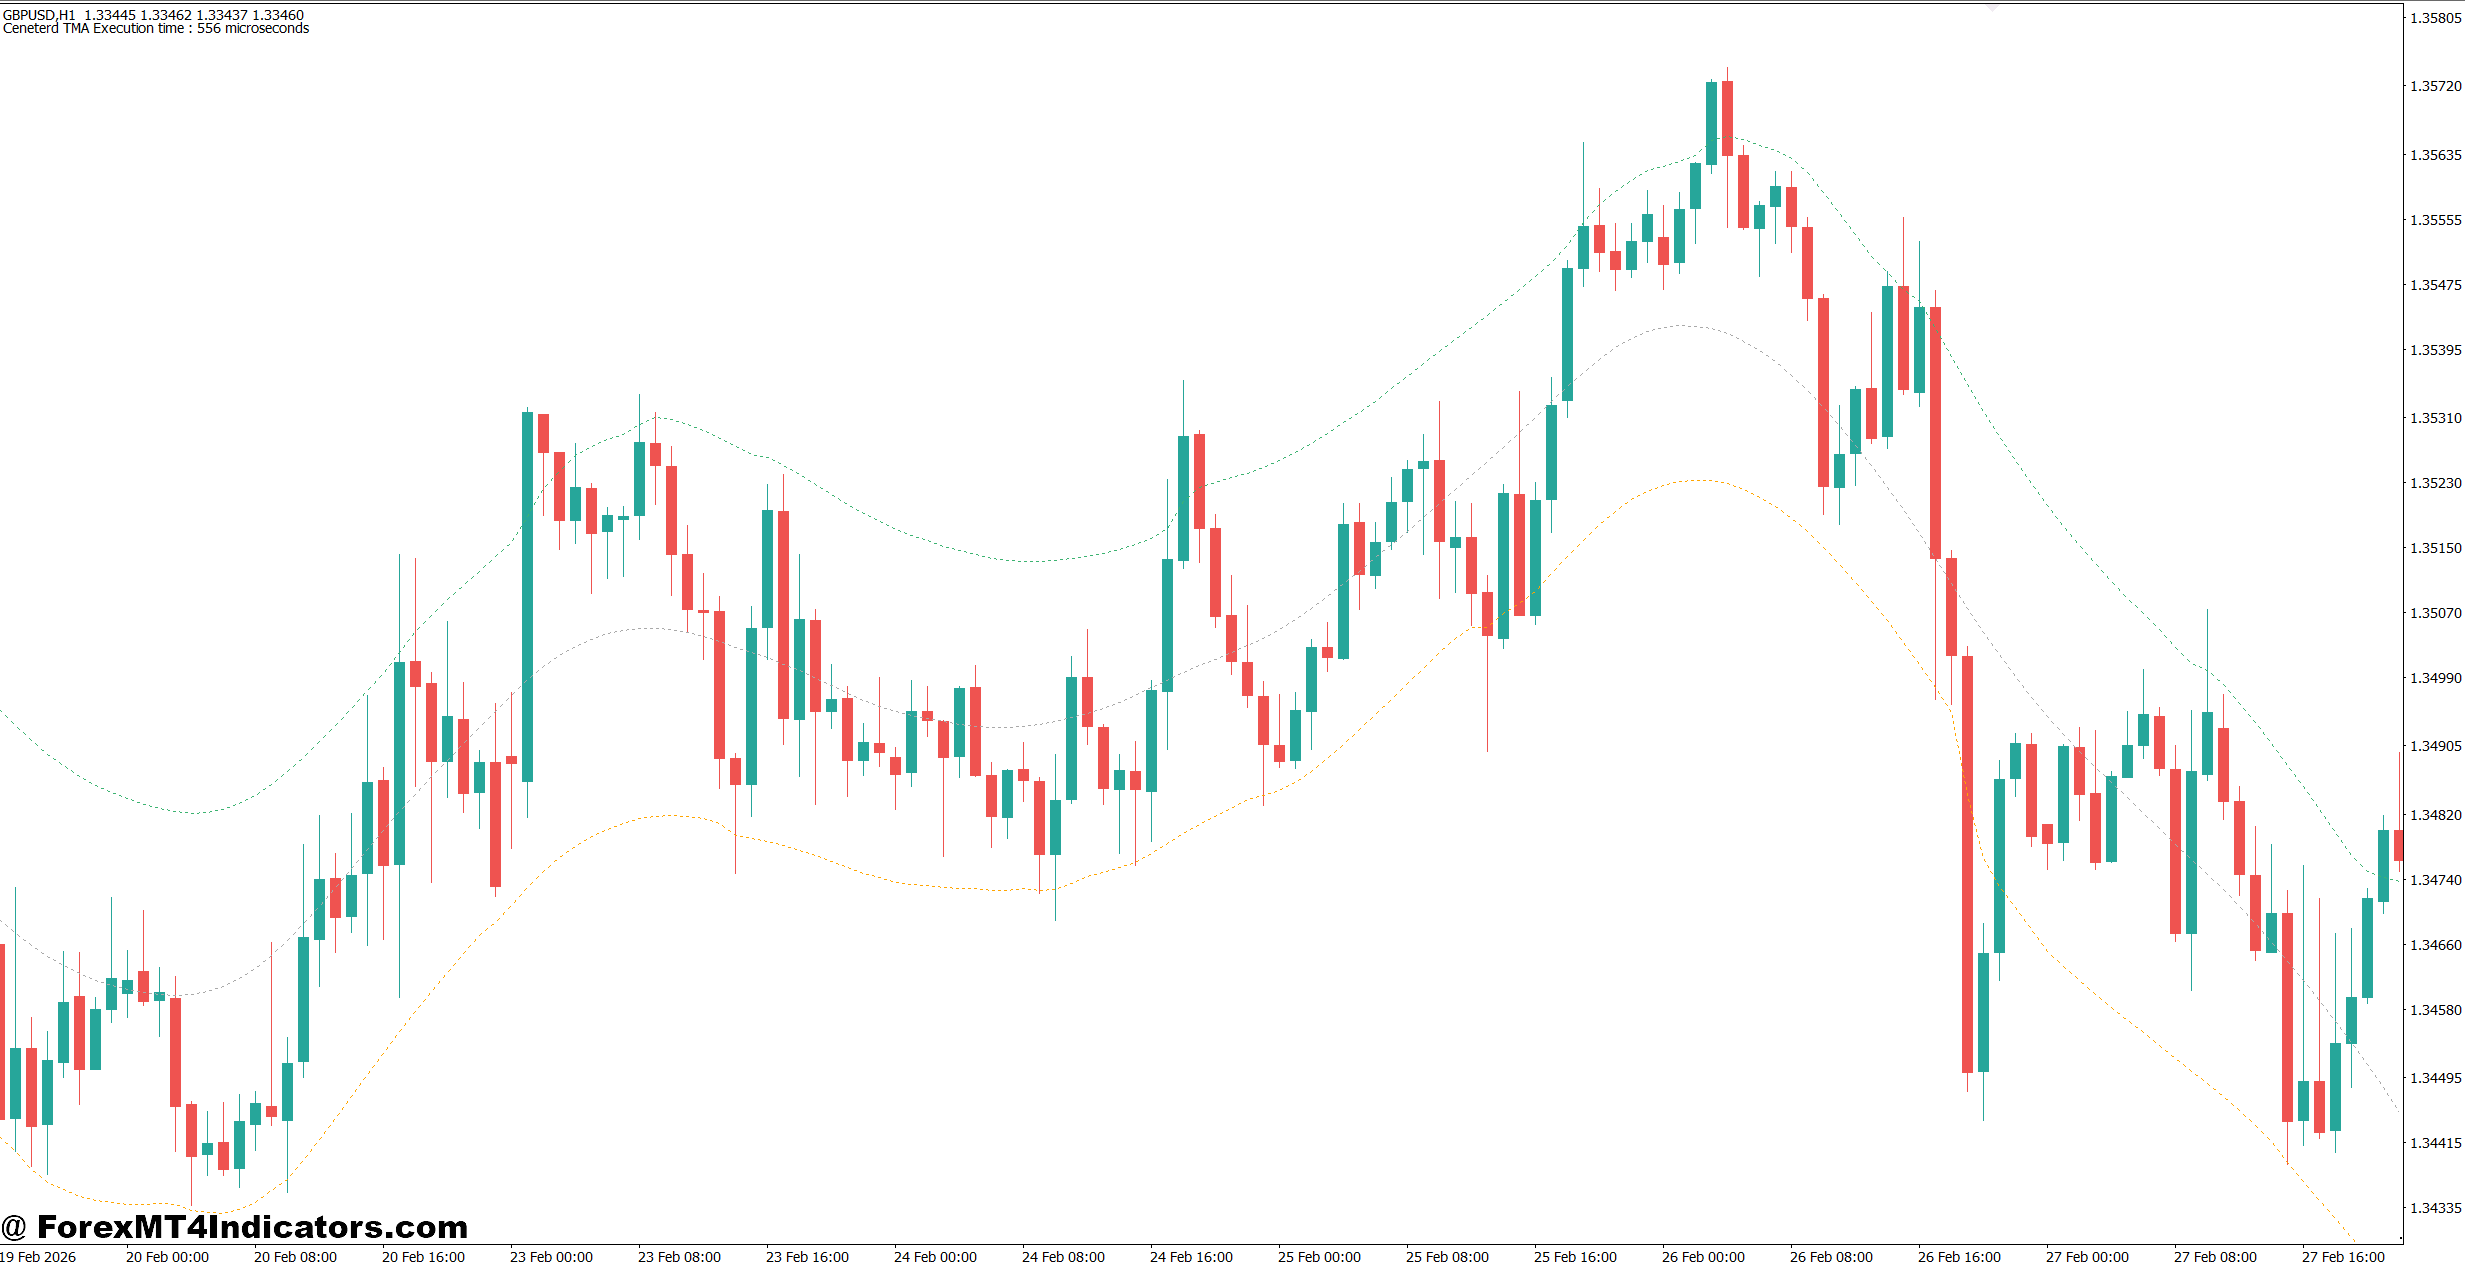
TMA Channels and Bollinger Bands look similar because both place upper and lower boundaries around a central average. The calculation and behavior are different, though.
Bollinger Bands typically use a simple moving average and standard deviation to measure dispersion. TMA-based channels focus more heavily on smoothing, depending on the specific implementation. As a result, a TMA channel may appear smoother and can help traders identify broader directional movement.
A standard moving average is simpler. It gives trend information but does not automatically provide an upper and lower trading range. The TMA Channel adds those reference zones.
That said, Bollinger Bands can be useful when traders want to study volatility expansion and contraction, while a basic moving average may be easier for trend confirmation. There is no requirement to choose only one.
For example, a trader could use a 50-period EMA to confirm the larger trend, the TMA Channel for pullback location, and horizontal support or resistance for the actual entry. On EUR/USD 1-hour, that combination may help avoid buying every lower-channel touch when the broader market is bearish.
What makes the TMA approach useful is not the channel alone. It is the way the channel interacts with price structure.
Practical TMA Trading Rules
A simple rules-based approach can keep the indicator from becoming a collection of random signals.
For a bullish setup, traders can look for a rising middle TMA line, price above a higher-timeframe support level, and a pullback toward the lower or middle section of the channel. Confirmation could come from a bullish rejection candle or a break of a minor swing high.
For bearish setups, the opposite conditions apply: a falling TMA line, price below resistance, and a rally toward the middle or upper portion of the channel. A bearish rejection or break of a minor swing low can provide confirmation.
Traders should also check the spread before entering. A setup targeting 15 pips is less attractive when the spread and expected slippage consume several pips.
And if the channel is completely flat while price repeatedly crosses the center line, waiting is often better than forcing a trade. Sometimes the best decision is simply to stay out of the chop.
Trading forex carries substantial risk. No indicator guarantees profits.
How to Trade with TMA Channel Indicator MT4
Buy Entry
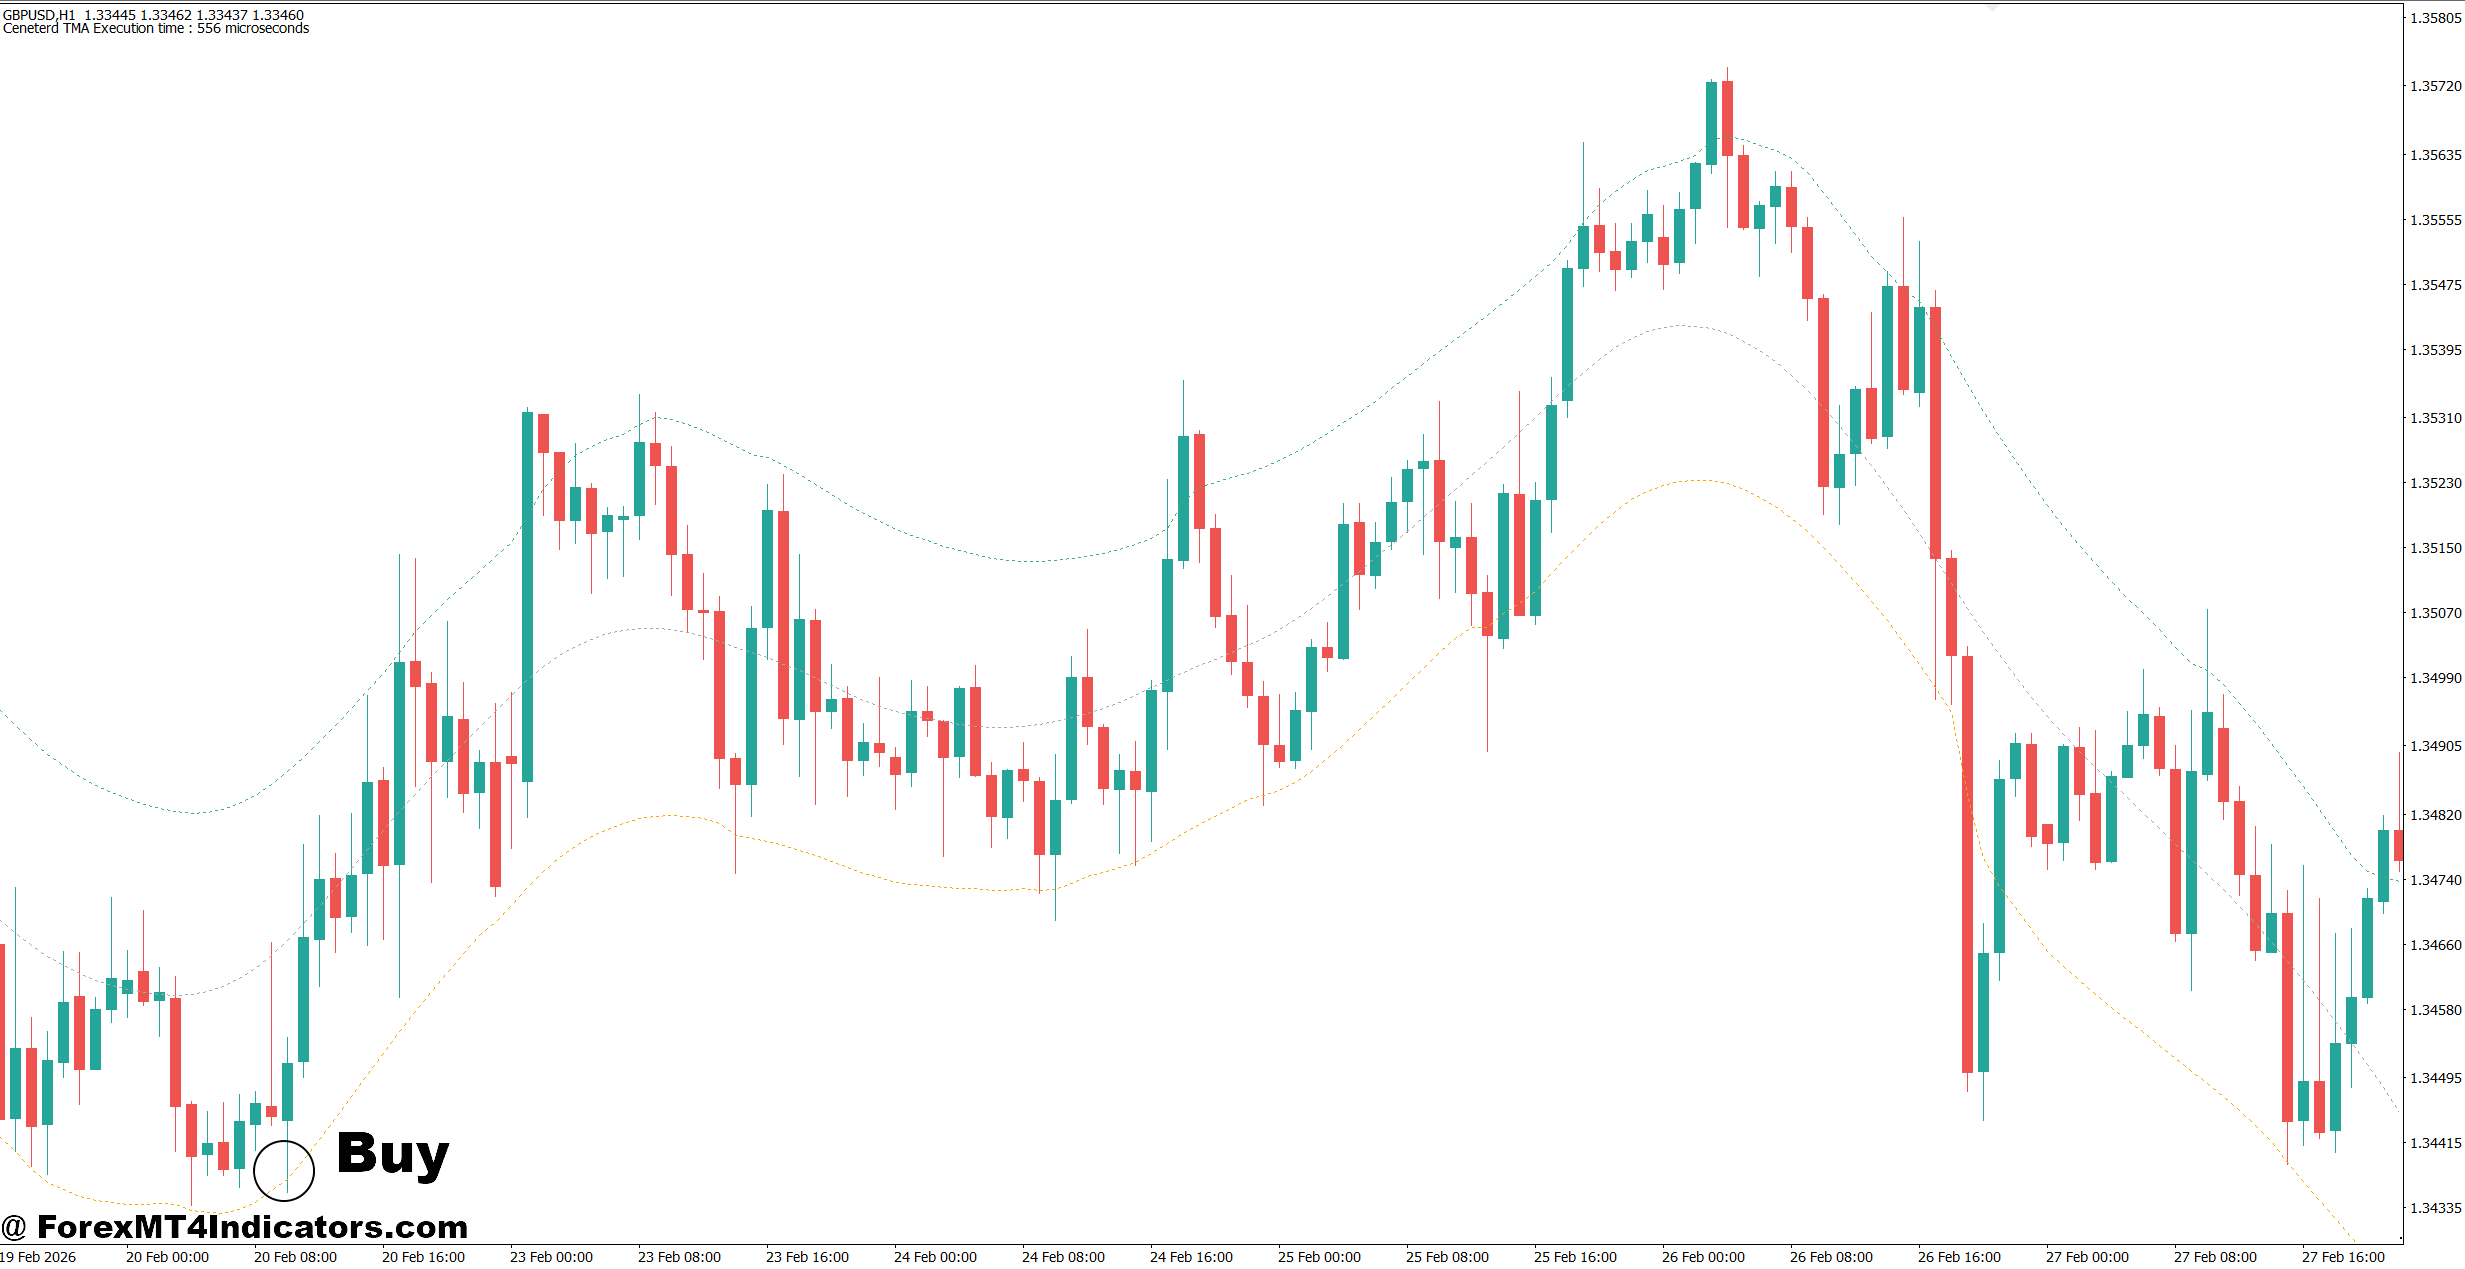
- Wait for an Upward TMA Slope – Buy when the middle TMA line rises clearly on the 1-hour chart, confirming bullish momentum.
- Buy at the Lower Channel – On EUR/USD 1-hour, look for a bullish rejection near the lower channel with a 10–20 pip stop-loss.
- Confirm a Support Level – Enter only when the lower TMA channel aligns with support that has held at least 2 times.
- Use Candle Confirmation – Wait for a bullish engulfing or strong rejection candle before entering; avoid buying on the first channel touch.
- Check the 4-Hour Trend – Prefer BUY signals when the 4-hour TMA direction is also bullish, reducing counter-trend trades.
- Target 1.5–2× Risk – If risking 20 pips, aim for at least 30–40 pips of profit before considering the trade complete.
- Limit Account Risk – Risk no more than 0.5%–1% of account equity on each TMA setup, especially during volatile sessions.
- Avoid Flat Channels – Don’t buy when the TMA channel is flat and EUR/USD has been moving sideways within a 20–30 pip range.
Sell Entry
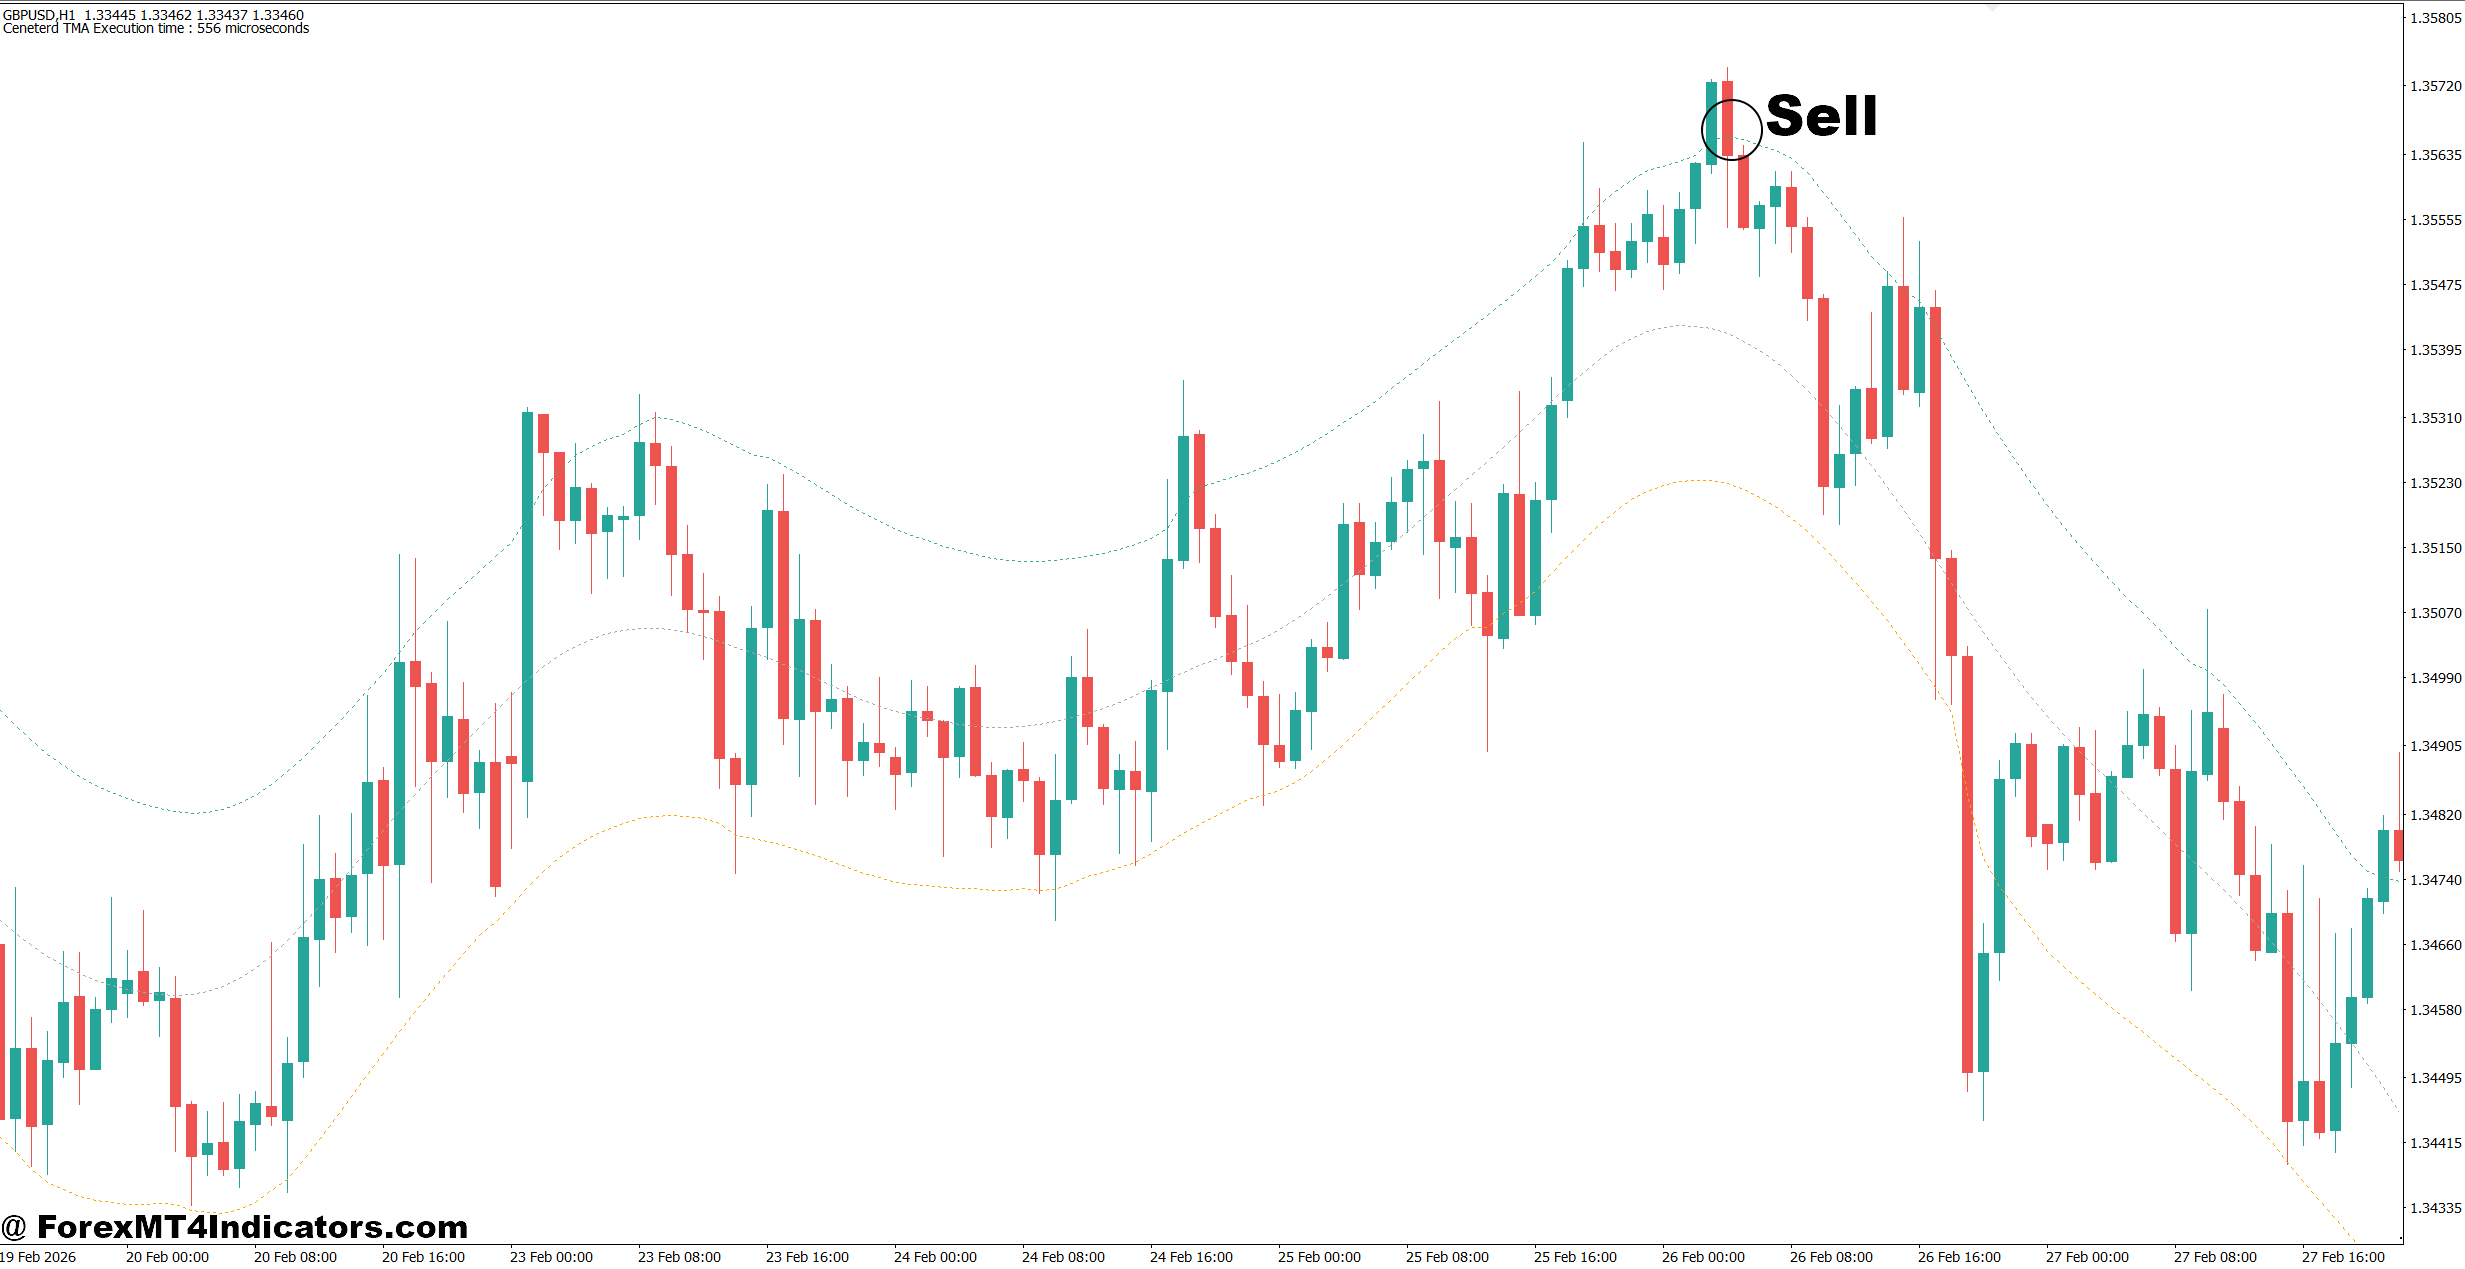
- Wait for a Downward TMA Slope – Sell when the middle TMA line points lower on the 1-hour or 4-hour chart.
- Sell Near the Upper Channel – On GBP/USD 1-hour, watch for bearish rejection near the upper channel before considering a short entry.
- Confirm Resistance – Look for the upper TMA channel to meet resistance tested at least 2 times before selling.
- Wait for Bearish Confirmation – Enter after a bearish engulfing candle or break of a minor swing low, rather than selling immediately.
- Check Daily Direction – Give more weight to SELL setups when the daily trend is bearish and price remains below major resistance.
- Place a Logical Stop – Keep the stop around 15–30 pips beyond the recent swing high, depending on pair volatility.
- Aim for 2:1 Reward-to-Risk – With a 25-pip stop, look for approximately 50 pips of potential profit.
- Avoid Major News Spikes – Don’t enter immediately before high-impact events such as NFP; wait 15–30 minutes for volatility to settle.
Final Thoughts on the TMA Channel Indicator MT4
The TMA Channel Indicator MT4 can give forex traders a practical framework for reading trend direction, pullbacks, and price extremes. Its strongest use comes when traders combine it with market structure rather than treating channel touches as automatic signals.
Three points deserve attention: first, test the indicator’s repainting behavior; second, adjust its settings to the pair and timeframe; and third, keep risk controlled around 0.5%–1% per trade.
A trader using EUR/USD on the 1-hour chart may find the channel helpful for identifying pullbacks, while someone trading GBP/JPY on a lower timeframe may need wider settings to handle volatility.
The next step is simple: test the indicator across at least 50–100 trades, record the market condition and result, and judge the numbers rather than relying on a few attractive historical signals.
Level up your trading
Learn to read the chart — not just the indicator
eBook · Instant PDF
Video Course · 12 modules
Recommended MT4/MT5 Brokers
- ✓ *FREE *$50 to start (withdrawable)
- ✓ Deposit bonus up to $5,000
- ✓ Negative balance protection
Trading forex and CFDs carries a significant risk of loss and is not suitable for everyone. Broker links are affiliate links — we may earn a commission at no cost to you.
Free MT4 Indicator Download

Enter Your Email Address below, download link will be sent to you.
