

Last updated:
To use forex indicators for analysis, combine two or three from different categories — one trend indicator, one momentum oscillator, and optionally one volatility measure — rather than stacking five that measure the same thing. Use trend indicators in trending markets and oscillators in ranges. More indicators do not mean more signal; they usually mean more noise.
Key takeaways
- The point of combining indicators is confirmation from independent angles — trend, momentum, and volatility each answer a different question, so they should not repeat each other.
- Cap the chart at two or three indicators. Five RSIs and three moving averages do not triple your edge; they triple the odds that two of them disagree and you freeze.
- Match the tool to the market. Trend indicators (moving averages, ADX) work in trends; oscillators (RSI, Stochastic) work in ranges. Using an oscillator’s overbought signal in a strong trend is the classic beginner trap.
- Leading vs lagging matters. Most indicators are lagging — they confirm what price already did. That is fine for confirmation; it is dangerous if you expect prediction.
- The strongest signal is agreement across categories. A trend indicator saying “up” plus a momentum indicator saying “pullback finished” is a real setup. Two trend indicators both saying “up” is one signal wearing two hats.
- Indicators do not predict price. They organise past price into something readable. The edge comes from combining them with structure and strict 1% risk, not from the indicators alone.
What forex indicators tell you (and what they can’t)
A forex indicator is a formula applied to price. It takes the open, high, low, and close you can already see on the candles and turns them into a line, a histogram, or a 0-100 reading that is easier to interpret at a glance. That is the whole job — organising price, not divining the future.
Most traders treat indicators as crystal balls — they are not. An indicator can tell you that momentum is fading or that volatility is expanding, but not what the next candle will do. Understand that limit and indicators become useful; forget it and they become a way to lose money with confidence.
Indicators sit inside the broader discipline of technical analysis. This page is not a definition of every indicator — it is about the specific skill of reading two or three of them together to build a clearer picture than any one gives alone.
Leading vs lagging indicators
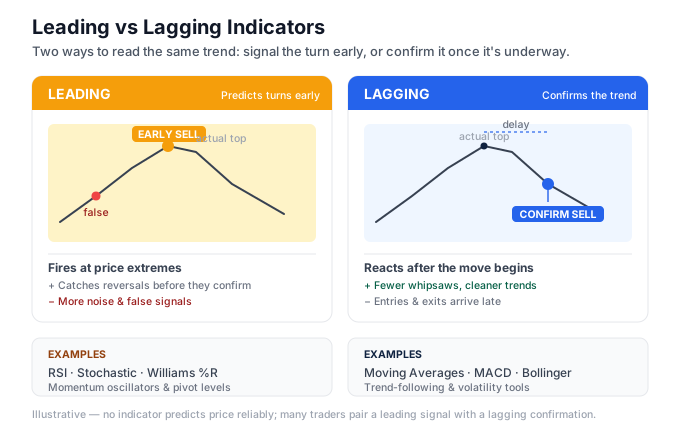
A lagging indicator confirms a move that has already started. Moving averages, MACD, and ADX are lagging — they smooth or average past prices, so they turn after price does. Their strength is reliability; their weakness is that they are always a step behind.
A leading indicator tries to signal a move before it happens. Oscillators like RSI and Stochastic are often called leading because they can flag an overextended market before it reverses. In practice, “leading” mostly means “earlier and less reliable” — they fire more false signals in exchange for earlier warnings.
The honest way to use them is together: let a leading oscillator flag a possible turn, then wait for a lagging indicator or price structure to confirm it. Neither type is better. They fail at opposite moments, which is exactly why combining them works.
The three categories that matter
Almost every useful indicator falls into one of three categories. Knowing the category tells you what question the indicator answers — and stops you from stacking three tools that all answer the same one.
| Category | What it answers | Common indicators | Best market |
|---|---|---|---|
| Trend | Which direction, and how strong? | Moving averages, ADX, MACD | Trending |
| Momentum | Is the move accelerating or fading? | RSI, Stochastic, CCI | Ranging / pullbacks |
| Volatility | How wide is price swinging? | Bollinger Bands, ATR | Both (context) |
A good combination pulls one from a different category each time. That way the second indicator confirms from an independent angle instead of echoing the first. That single idea — one per category — is the foundation of everything below.
The golden rule: don’t stack redundant indicators
Here is the mistake that quietly ruins most beginner charts: adding a second indicator that measures the same thing as the first. Two moving averages, an RSI, and a Stochastic all crowded on one screen feels rigorous. It is the opposite.
RSI and Stochastic are both momentum oscillators. When RSI is overbought, Stochastic almost always is too — they are reading the same price with slightly different math. Putting both on your chart does not give you two confirmations. It gives you one confirmation you have fooled yourself into counting twice.
The cost of redundancy is not only clutter — it is analysis paralysis. Stack five indicators and on any given candle at least one will disagree with the others. You end up waiting for all five to align, which almost never happens, so you either miss trades or override your own rules. A chart with two well-chosen indicators produces cleaner decisions than a chart with six.
The working cap is two or three indicators, each from a different category. One trend, one momentum, optionally one volatility for context. If you want to add a fourth, remove one first. The goal is a chart you can read in three seconds, not a dashboard you have to interpret.
Best forex indicator combinations for analysis
These three pairings cover the vast majority of what analysis actually requires: trade with the trend, time the entry, and read the volatility context. Each combines categories rather than doubling up within one.
Moving average + RSI
The workhorse combination, and the best one for beginners. A moving average (the 50 EMA — Exponential Moving Average — is a common choice) tells you the trend direction; the RSI tells you when momentum has pulled back far enough to enter with that trend.
The rule is simple. In an uptrend — price above the 50 EMA — you ignore RSI overbought readings and instead wait for RSI to dip toward 40-50 and turn back up. That is a pullback finishing inside a trend, not a reversal. The moving average keeps you on the right side; RSI times the entry.
Why it works: the two indicators answer different questions. The EMA answers “which way?” and RSI answers “is now a good moment?” Using RSI’s standard 14-period with 70/30 thresholds is fine on H1 and H4; the moving average does the heavy lifting on direction, so you are not relying on the oscillator to call the trend.
MACD + Bollinger Bands
A combination for spotting momentum shifts as volatility expands. MACD (default 12, 26, 9) is a trend-momentum indicator; the MACD line crossing its signal line flags a shift in momentum. Bollinger Bands measure volatility — the bands widen when price is moving and squeeze when it is quiet.
The pairing reads like this. When the Bollinger Bands squeeze (low volatility), the market is coiling. When price breaks out of the squeeze and MACD confirms with a crossover in the same direction, you have volatility and momentum agreeing — a stronger case than either alone.
The trap to avoid: Bollinger Bands are often taught as a mean-reversion tool (sell the upper band, buy the lower). In a strong trend that gets you run over, because price rides the upper band for a long time. MACD keeps you honest — if MACD confirms upward momentum, you do not fade the upper band. Volatility tells you when; momentum tells you whether.
EMA + ADX + Stochastic
A three-indicator system for traders who want a stricter filter. The ADX (Average Directional Index) measures trend strength on a 0-100 scale — above 25 means a real trend is present, below 20 means the market is ranging. The EMA gives direction; the Stochastic times the pullback entry.
This is the one case where three indicators earn their place, because each does a genuinely different job. ADX is the gatekeeper: it tells you which mode the market is in. When ADX reads above 25, you trust the EMA direction and use Stochastic to enter pullbacks. When ADX reads below 20, you stand aside — the trend tools will fail because there is no trend.
That mode-switch is the real value. Most beginners apply trend tools in ranges and range tools in trends. ADX stops that by telling you which environment you are in before you pick your entry tool. It is one category (trend strength) added on purpose, not a redundant fourth line.
How to read a combination: confirmation vs conflicting signals
Combining indicators only helps if you know what to do when they agree — and what to do when they don’t. Most of the value is in the second case.
Confirmation is when your indicators point the same way from different angles. Price is above the 50 EMA (uptrend) and RSI has bounced off 45 and turned up (momentum resuming). Two independent tools agree, so the setup is stronger than either signal alone. This is a trade.
Conflict is when they disagree — and this is where beginners lose money. The EMA says uptrend, but MACD is rolling over and momentum is fading. That disagreement is information: it usually means “wait.” The correct response to conflicting indicators is almost always no trade, not “pick the one I like.”
The mistake is treating conflict as a democracy where the majority wins. Two indicators saying buy and one saying sell is not a two-to-one buy — especially if the two are redundant (RSI and Stochastic will nearly always vote together). Weight by category, not by count. One trend signal and one momentum signal agreeing beats three momentum tools agreeing with each other.
When indicators conflict repeatedly on a pair, that pair is often ranging or choppy. That is your cue to drop to a range approach or move on — not to force a trend setup that the market is refusing to give you.
Indicator combinations by trading style
The right combination depends on how long you hold trades. A scalper and a swing trader need different tools even on the same pair, because they are reading different timeframes.
| Style | Timeframe | Suggested combination | Why |
|---|---|---|---|
| Scalping | M1-M5 | Fast EMA + Stochastic | Needs speed; fast tools, tight entries |
| Day trading | M15-H1 | 50 EMA + RSI | Balance of direction and timing |
| Swing trading | H4-D1 | EMA + ADX + MACD | Filters weak trends, holds for the bigger move |
For day trading, the 50 EMA + RSI pairing on H1/M15 is hard to beat — enough structure to trade with the trend without overcomplicating a fast session. Our guide to day trading strategies shows this combination inside a full intraday routine.
For swing trading, add ADX as a trend-strength filter. Swing traders hold for days, so a false signal costs more; ADX above 25 confirms the trend is worth holding through the noise. Our swing trading strategies guide builds on this. Scalpers should keep it to two fast tools — on M1-M5 there is no time to consult three indicators before a move is gone.
On XAU/USD (gold), the same combinations apply but the settings need loosening. Gold’s volatility keeps RSI overbought or oversold for longer stretches than EUR/USD, so RSI 14 fires more false signals — many gold traders use RSI 21 instead, and give ADX more room before trusting a trend. Gold’s wider daily range means an oscillator screaming “overbought” can stay that way through an entire trending session.
How to read the market with indicators: a worked example
Rules stay abstract until you apply them. Here is one clean analysis using the moving average + RSI combination, start to finish.
- Set the direction with the trend tool. On the H1 EUR/USD chart, price is trading above the 50 EMA and the EMA is sloping up. Bias: long only. You will not look for sells while this holds.
- Wait for momentum to reset. RSI (14) has climbed to 72 during the push up — overbought. In a downtrend that would tempt a short. Here, in an uptrend, you ignore it. Overbought in a trend is not a sell signal; it is a strong trend.
- Wait for the pullback signal. Price pulls back toward the 50 EMA and RSI falls to 44, then ticks back up above 50. That is momentum resetting inside the trend — the two tools now agree: trend up, momentum resuming up.
- Confirm there is no conflict. Nothing on the chart contradicts the setup — price held the EMA, RSI turned from a healthy level, not from oversold panic. Category agreement (trend + momentum) is clean.
- Define risk before entry. Enter on the candle that closes back above the recent minor high, stop below the pullback low, target the prior swing high for at least a 1:2 risk-reward. Size the position so a stop-out costs no more than 1% of the account.
Notice what the indicators did and did not do. They did not predict the reversal — they organised the trend and the pullback so you could read them. The decision, the stop, and the position size were still yours. That is the correct relationship between a trader and their tools.
Common mistakes when using indicators
These are the errors that turn a useful two-indicator chart into a losing one. Each has a specific fix.
- Stacking redundant indicators. RSI + Stochastic + CCI are all momentum tools that mostly agree. Fix: one indicator per category — trend, momentum, volatility.
- Using oscillators in a strong trend. Shorting because RSI hit 70 during an uptrend. Fix: in a trend, ignore overbought/oversold; use the oscillator only to time pullbacks with the trend.
- Treating indicators as predictors. Expecting an RSI reading to forecast the next candle. Fix: use indicators to confirm price and structure, not to predict them.
- Counting votes instead of weighting categories. “Three of my four indicators say buy.” Fix: if three of the four are the same category, that is one vote, not three.
- Optimising settings endlessly. Tweaking RSI from 14 to 13 to 15 chasing a perfect backtest. Fix: use standard settings (RSI 14, MACD 12/26/9), and put your energy into risk management instead.
- Adding indicators to fix a losing system. A sixth indicator will not save a plan with no risk control. Fix: fewer indicators, strict 1% risk, one clear entry rule.
Frequently asked questions
How do you use indicators in forex analysis?
Pick two or three indicators from different categories — one for trend (a moving average or ADX), one for momentum (RSI or Stochastic), and optionally one for volatility (Bollinger Bands). Use the trend tool to set direction and the momentum tool to time entries with that trend. Look for agreement across categories, and treat conflicting signals as a reason to wait.
What’s the best forex indicator combination?
For most traders, a moving average plus RSI is the best combination — one sets the trend direction, the other times pullback entries within it. It is simple, uses standard settings, and pairs a trend tool with a momentum tool so they confirm from independent angles. Add ADX as a trend-strength filter if you want a stricter setup for swing trading.
How many indicators should I use at once?
Two or three, no more — each from a different category (trend, momentum, or volatility) so they confirm rather than repeat each other. Beyond three, indicators start contradicting one another and cause analysis paralysis. If you want to add one, remove one first. A clean two-indicator chart produces better decisions than a crowded six-indicator one.
Can you combine two trend indicators?
You can, but it usually adds little. Two moving averages, or a moving average and MACD, largely tell you the same thing — direction — so the second one rarely gives independent confirmation. It is more useful to combine one trend indicator with one momentum indicator, so each answers a different question. The exception is a moving average for direction plus ADX for trend strength, which measure genuinely different things.
What’s the difference between a trend indicator and an oscillator?
A trend indicator (moving average, ADX, MACD) shows direction and strength and works best in trending markets. An oscillator (RSI, Stochastic) moves within a fixed range, usually 0-100, and flags overbought or oversold conditions — it works best in ranging markets or for timing pullbacks. The classic mistake is using an oscillator’s reversal signals during a strong trend, where price stays overbought for a long time.
Do forex indicators predict price?
No. Every indicator is a formula applied to past price, so it describes what has already happened, not what will happen next. Lagging indicators confirm moves after they start; “leading” oscillators flag overextension but produce many false signals. The edge comes from combining indicators with market structure and strict risk control — never from expecting an indicator to forecast the next candle.
What’s the best indicator combination for beginners?
The 50 EMA plus RSI (14, 70/30) on the H1 chart. It uses standard settings, pairs a trend tool with a momentum tool, and enforces the most important beginner habit: trade with the trend and use the oscillator only to time pullbacks. Master this two-indicator combination before adding anything else. Simpler charts produce clearer, more consistent decisions early on.
Are lagging indicators useless?
No — lagging indicators are the most reliable ones. Because they confirm moves that have already started, they filter out much of the noise that catches traders using “leading” signals. Their weakness is that they enter a little late, which is a fair trade for higher reliability. The strongest approach pairs a lagging trend indicator with a faster momentum tool, so you get both confirmation and timing.