


The QM Indicator MT4 was created to help traders recognize one of the most respected reversal patterns in price action before the next major move develops.
The challenge is that Quasimodo patterns can be difficult to identify in real time. During active sessions, price creates dozens of highs and lows, making it easy to confuse a genuine setup with a fake-out. Poor timing can quickly increase drawdown, especially when trading volatile pairs like GBP/USD or XAU/USD.
The QM Indicator MT4 simplifies this process by highlighting potential Quasimodo formations automatically. Instead of searching every swing manually, traders can focus on confirmation and risk management. The following sections explain how the indicator works, where it performs best, and how it fits into a disciplined trading strategy.
Understanding the QM Indicator MT4
The QM Indicator MT4 is a technical analysis tool designed to detect Quasimodo (QM) reversal patterns on MetaTrader 4 charts. A Quasimodo pattern forms after the market creates a sequence of higher highs and higher lows in an uptrend, then suddenly breaks structure by producing a lower low before retesting a key level. The opposite happens during bearish trends.
Unlike moving averages or oscillators, this indicator focuses on market structure instead of mathematical smoothing. It searches for swing highs, swing lows, break-of-structure events, and the expected retracement area where traders often look for entries.
Many price action traders combine Quasimodo levels with support and resistance zones because both methods identify areas where institutional orders may still exist. That combination often improves trade quality.
How the Indicator Detects Trading Opportunities
The indicator constantly scans historical price swings. Once a valid sequence of market structure develops, it marks the Quasimodo level directly on the chart.
Here’s a common bullish example.
EUR/USD on the 1-hour chart rallies from 1.1080 to 1.1165 before pulling back to 1.1135. Price then pushes to a new high at 1.1188 but suddenly drops below the previous swing low to 1.1115. That break changes the market structure. When price later retraces toward the Quasimodo level around 1.1135, the indicator highlights it as a potential buying zone.
The logic behind this setup is simple. After liquidity is collected below previous lows, buyers often step back into the market if the overall higher-timeframe trend remains supportive.
When testing this during London sessions, many traders notice cleaner reactions compared with late New York trading, where liquidity usually declines and price action becomes less reliable.
Still, confirmation matters. A bullish engulfing candle or rejection wick at the QM level can improve entry confidence instead of placing blind limit orders.
Using the QM Indicator MT4 in Live Trading
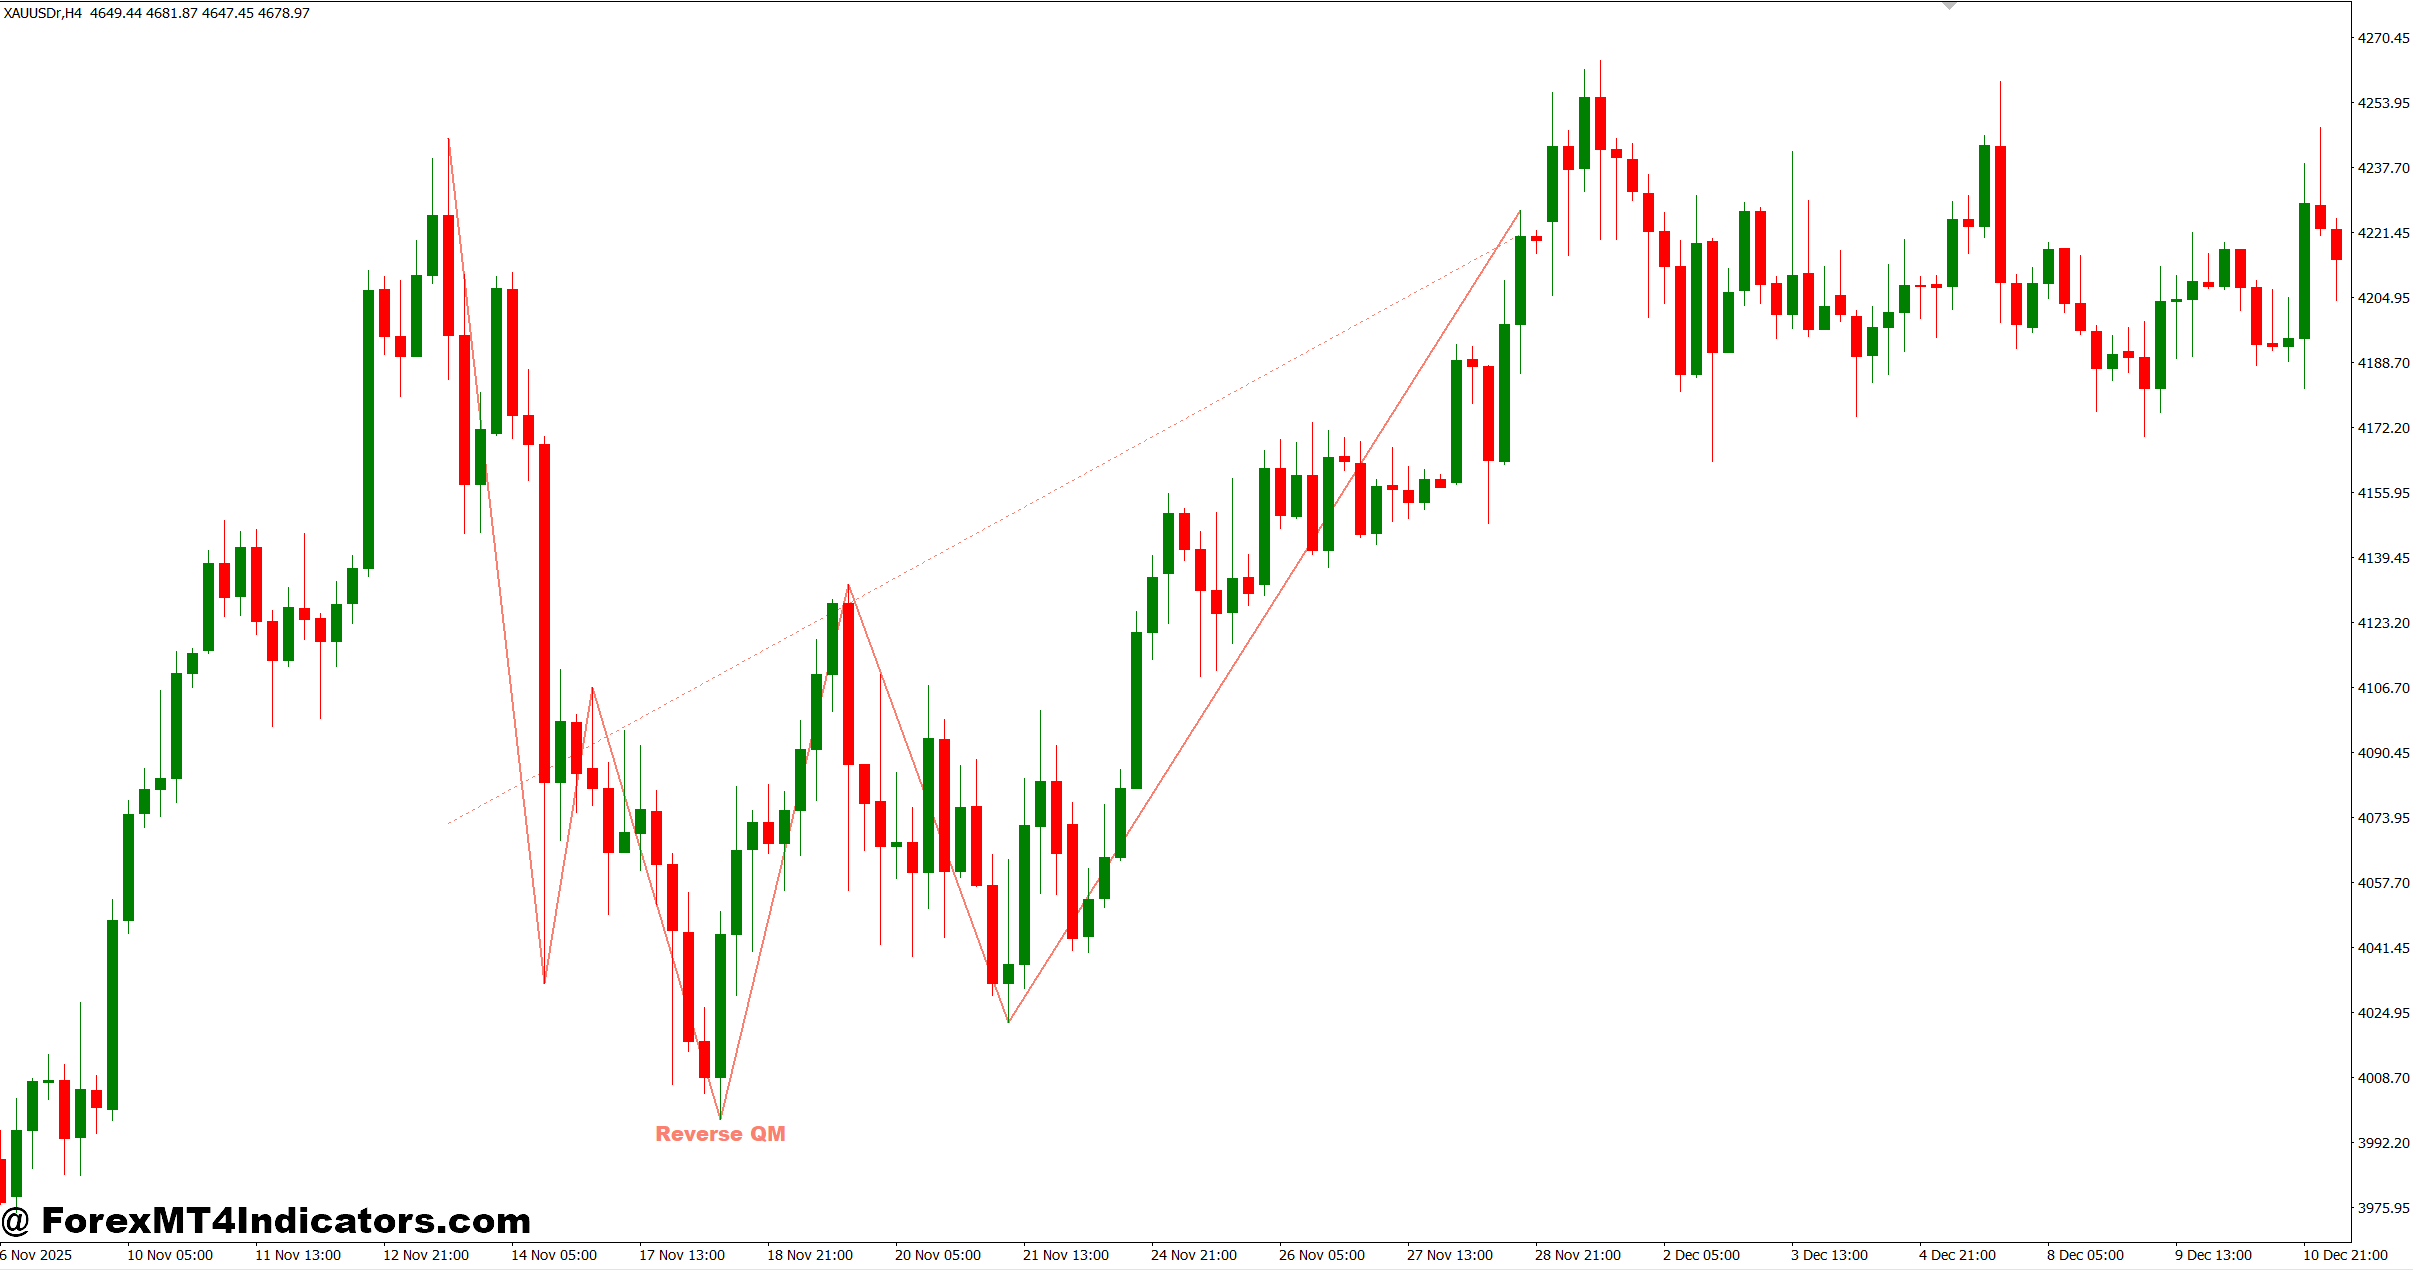
The indicator performs best when combined with trend analysis rather than traded on every signal.
For example, imagine GBP/USD is trending downward on the 4-hour chart. Price retraces into a bearish Quasimodo level identified by the indicator while also reaching a previous resistance zone. A bearish engulfing candle appears, and volume increases during the London open. Some traders may consider entering a short position with a 30-40 pip stop-loss above the recent swing high while targeting the next support level 80-100 pips away.
That creates a reward-to-risk ratio close to 2.5:1, which many experienced traders prefer.
Lower timeframes such as M15 can produce more signals, but they also generate extra market noise. During major news releases like Non-Farm Payrolls, sudden volatility can invalidate even well-formed Quasimodo patterns within seconds.
Trading forex carries substantial risk. No indicator guarantees profits. Every setup should include proper position sizing and a predefined exit plan.
Suggested Settings for Different Markets
The default settings work well for many traders, but small adjustments can improve performance depending on the trading style.
Scalpers often monitor M5 and M15 charts with slightly lower swing sensitivity to capture more opportunities. Swing traders generally leave the default settings unchanged while focusing on H1, H4, and Daily charts where market structure tends to be cleaner.
Pairs such as EUR/USD, GBP/USD, USD/JPY, and AUD/USD usually provide consistent price movement for this strategy. Gold and NASDAQ can also generate strong Quasimodo setups, although wider stop-loss levels are normally required because of higher volatility.
One practical tip is to avoid taking every highlighted level. Waiting until price reacts with a clear rejection candle often filters out weaker trades.
Strengths, Weaknesses, and Comparison with Similar Indicators
The biggest strength of the QM Indicator MT4 is its ability to automate pattern recognition. Traders save time because they don’t need to analyze every swing manually. It also encourages structure-based trading rather than emotional decisions.
Another advantage is flexibility. The indicator works across multiple timeframes and currency pairs without requiring complicated calculations from the trader.
But it isn’t perfect.
Strong trending markets sometimes continue without respecting the Quasimodo level. During ranging conditions, false signals may appear as price repeatedly breaks short-term highs and lows without creating meaningful reversals.
Compared with ZigZag indicators, the QM Indicator focuses more on reversal structure than simply connecting swing points. ZigZag helps visualize trends but doesn’t always identify entry locations. Compared with supply and demand indicators, the QM Indicator offers more precise structural reversal zones, while supply and demand tools usually highlight broader trading areas.
Many experienced traders combine all three approaches. A Quasimodo level inside a higher-timeframe supply or demand zone often carries greater weight than either method alone.
Another useful filter is the Relative Strength Index (RSI). If the RSI shows bearish divergence while the indicator marks a bearish Quasimodo level, the probability of a meaningful pullback may improve. Even then, traders should remember that probabilities never become certainties.
How to Trade with QM Indicator MT4
Buy Entry
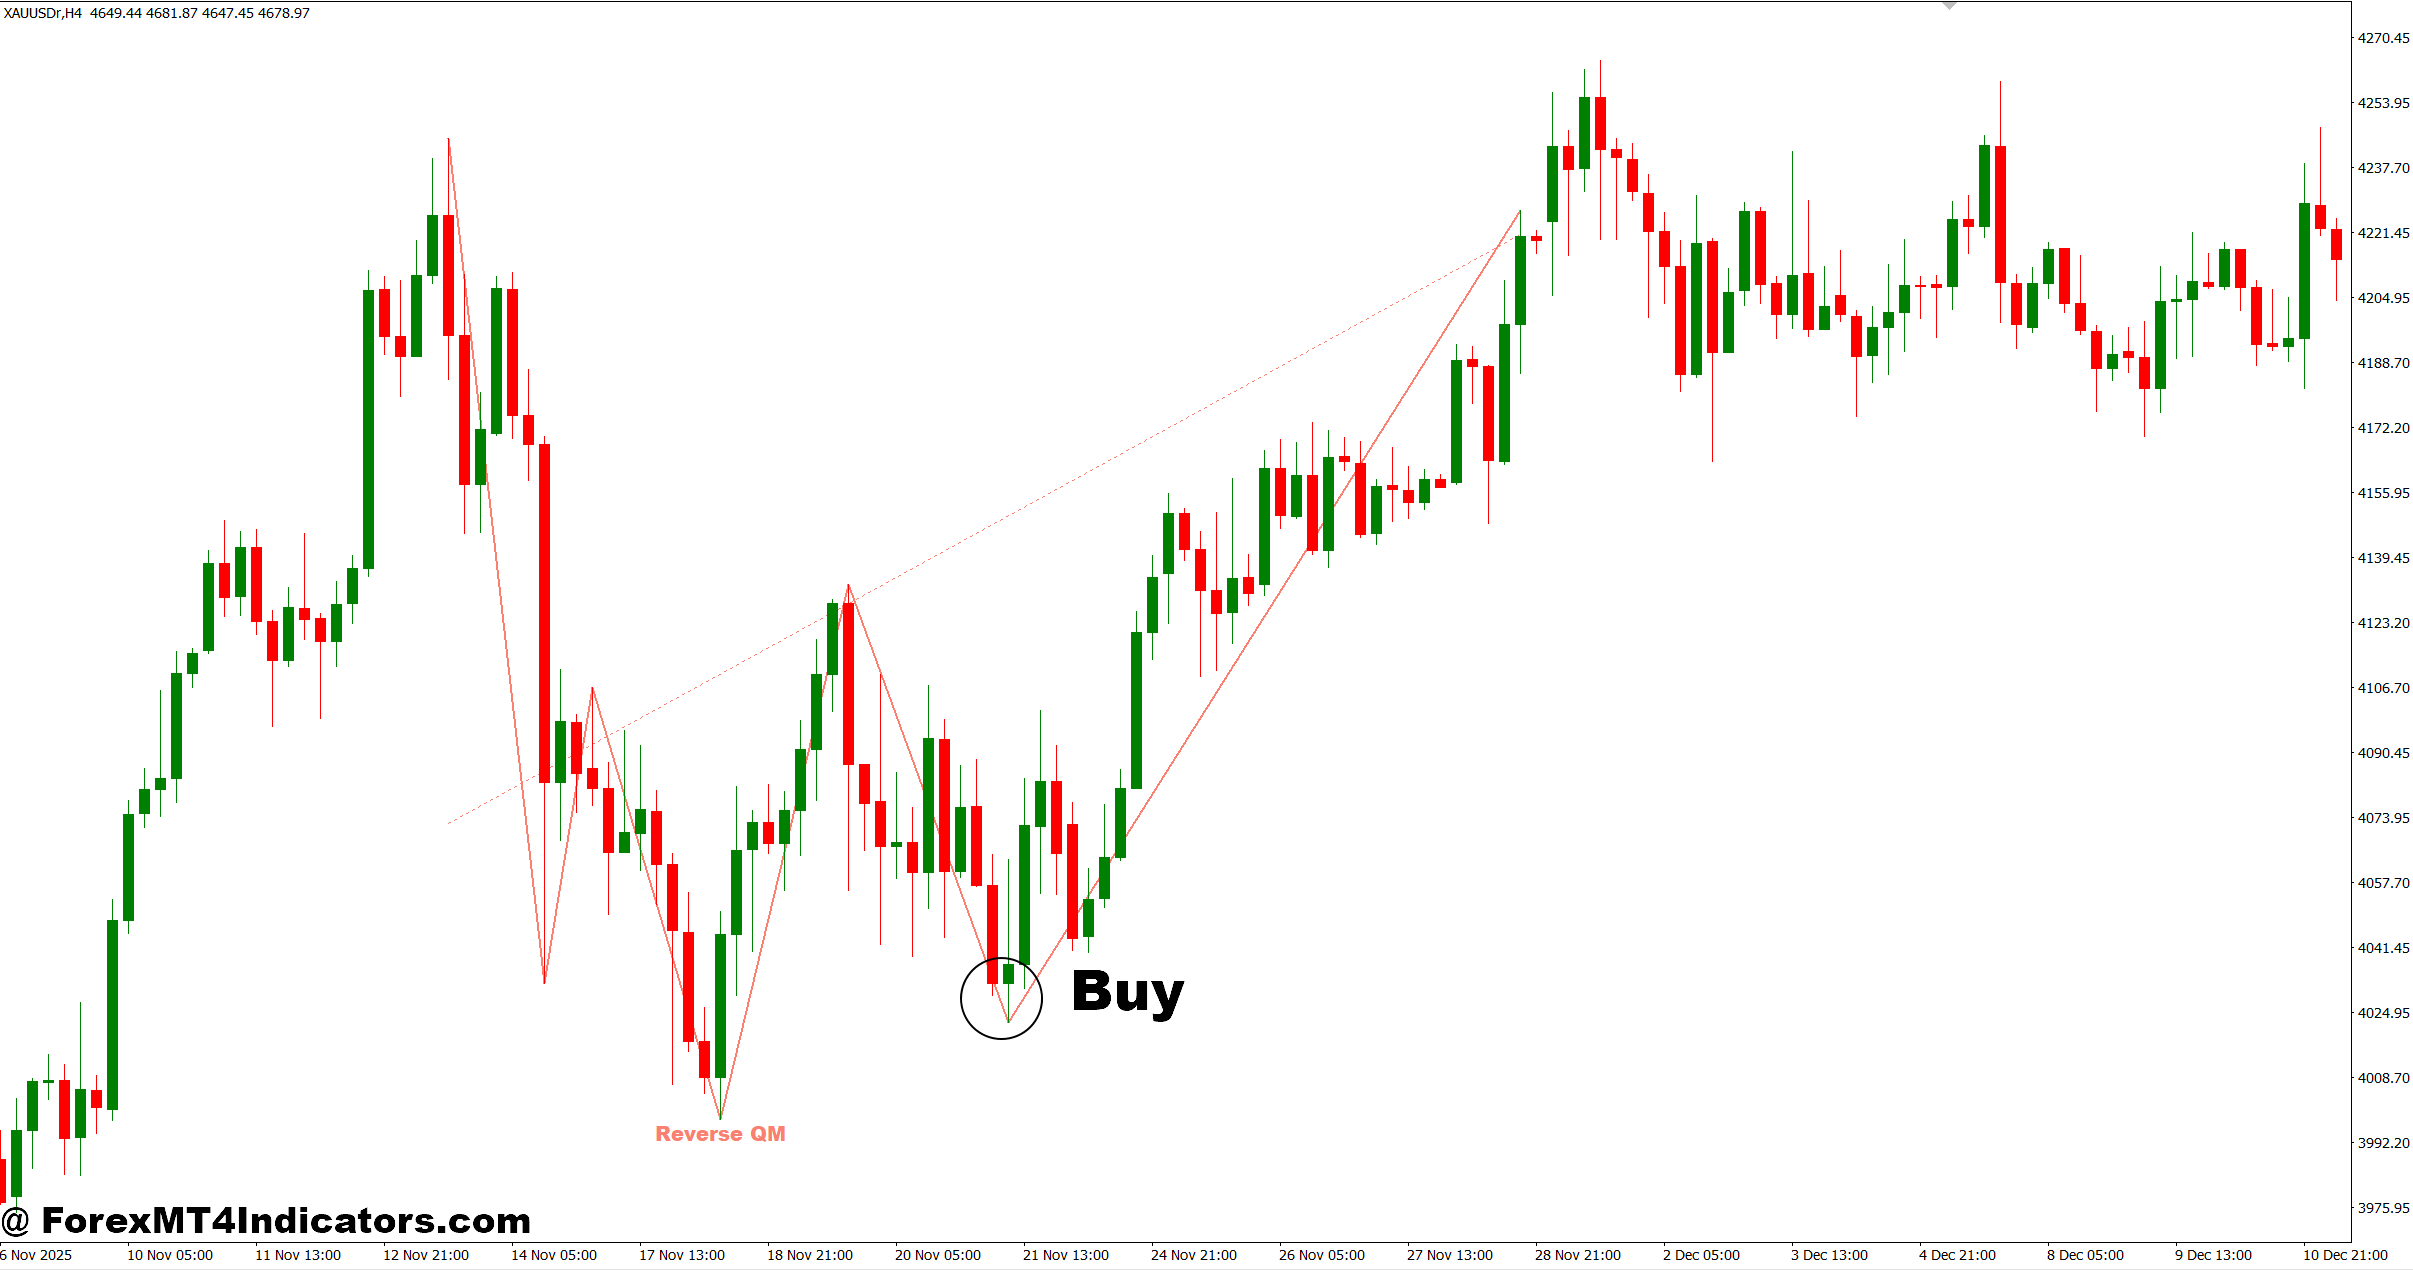
- Wait for a Bullish QM Pattern – Enter after the indicator marks a bullish QM zone on the 1-hour or 4-hour chart.
- Confirm with a Bullish Candle – Buy only after a bullish engulfing or pin bar forms at the QM level on EUR/USD.
- Trade with the Higher Trend – Take buy signals only when the daily trend is bullish to improve accuracy.
- Place Stop-Loss Below Structure – Keep the stop-loss 15-30 pips below the QM low for better protection.
- Target a 1:2 Risk-Reward – Aim for at least 40-60 pips if risking 20-30 pips.
- Use Confluence Zones – Buy when the QM level aligns with support or a 50 EMA for stronger confirmation.
- Avoid High-Impact News – Skip entries during NFP, CPI, or major central bank announcements due to volatility.
- Risk Only 1-2% Per Trade – Keep position size small to protect your trading account.
Sell Entry
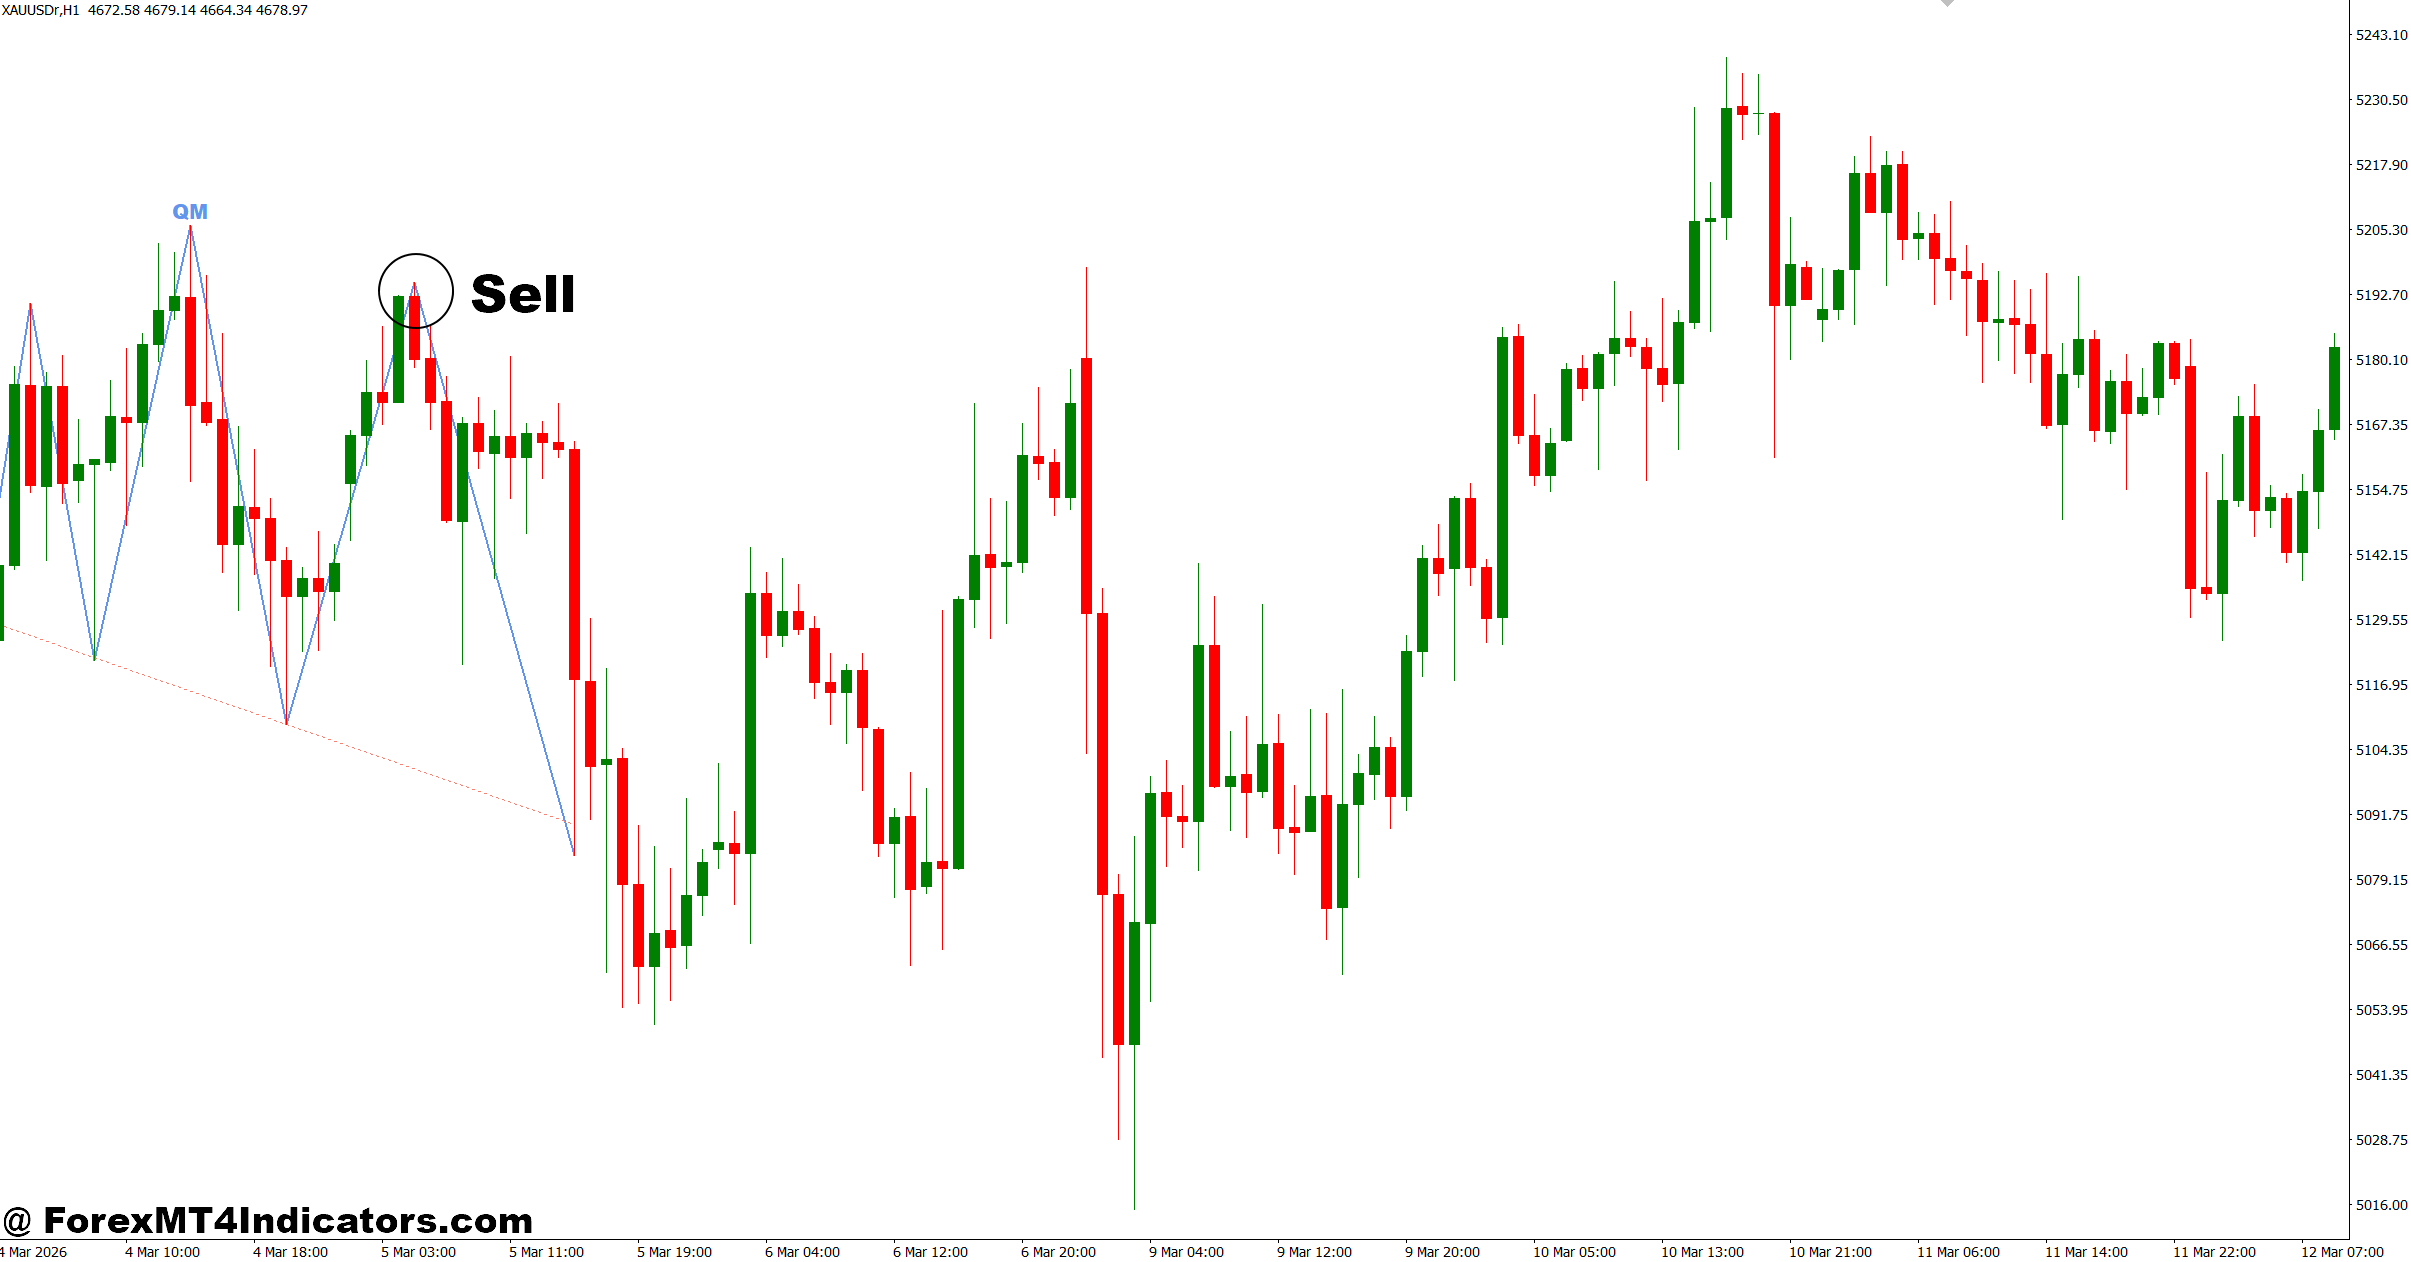
- Wait for a Bearish QM Pattern – Sell after the indicator identifies a bearish QM setup on GBP/USD or EUR/USD.
- Confirm with a Bearish Rejection – Enter after a bearish engulfing or shooting star appears at the QM level.
- Follow the Main Trend – Take sell trades only when the 4-hour or daily trend remains bearish.
- Place Stop-Loss Above Structure – Set the stop-loss 15-30 pips above the recent swing high.
- Aim for Strong Risk-Reward – Target 50-80 pips while risking around 25-30 pips.
- Check Resistance Confluence – Sell when the QM level matches a resistance zone or trendline.
- Avoid Choppy Markets – Don’t trade QM signals during sideways price action or low-volume sessions.
- Limit Risk to 1-2% – Never increase lot size after a losing trade; stay disciplined.
Final Thoughts
The QM Indicator MT4 gives traders a structured way to identify Quasimodo reversal patterns without manually searching every chart. Its greatest value comes from recognizing shifts in market structure, highlighting possible entry zones, supporting price action analysis, and helping traders maintain consistent decision-making. It performs best when paired with trend confirmation, disciplined risk management, and patience instead of aggressive entries. No technical tool predicts the market with complete accuracy, but this indicator can become a valuable part of a trading plan when used responsibly. Before risking real capital, traders should test the QM Indicator MT4 on a demo account across different currency pairs and market conditions to understand both its strengths and its limitations.
Level up your trading
Learn to read the chart — not just the indicator
eBook · Instant PDF
Video Course · 12 modules
Recommended MT4/MT5 Brokers
- ✓ *FREE *$50 to start (withdrawable)
- ✓ Deposit bonus up to $5,000
- ✓ Negative balance protection
Trading forex and CFDs carries a significant risk of loss and is not suitable for everyone. Broker links are affiliate links — we may earn a commission at no cost to you.
Free MT4 Indicator Download

Enter Your Email Address below, download link will be sent to you.
