

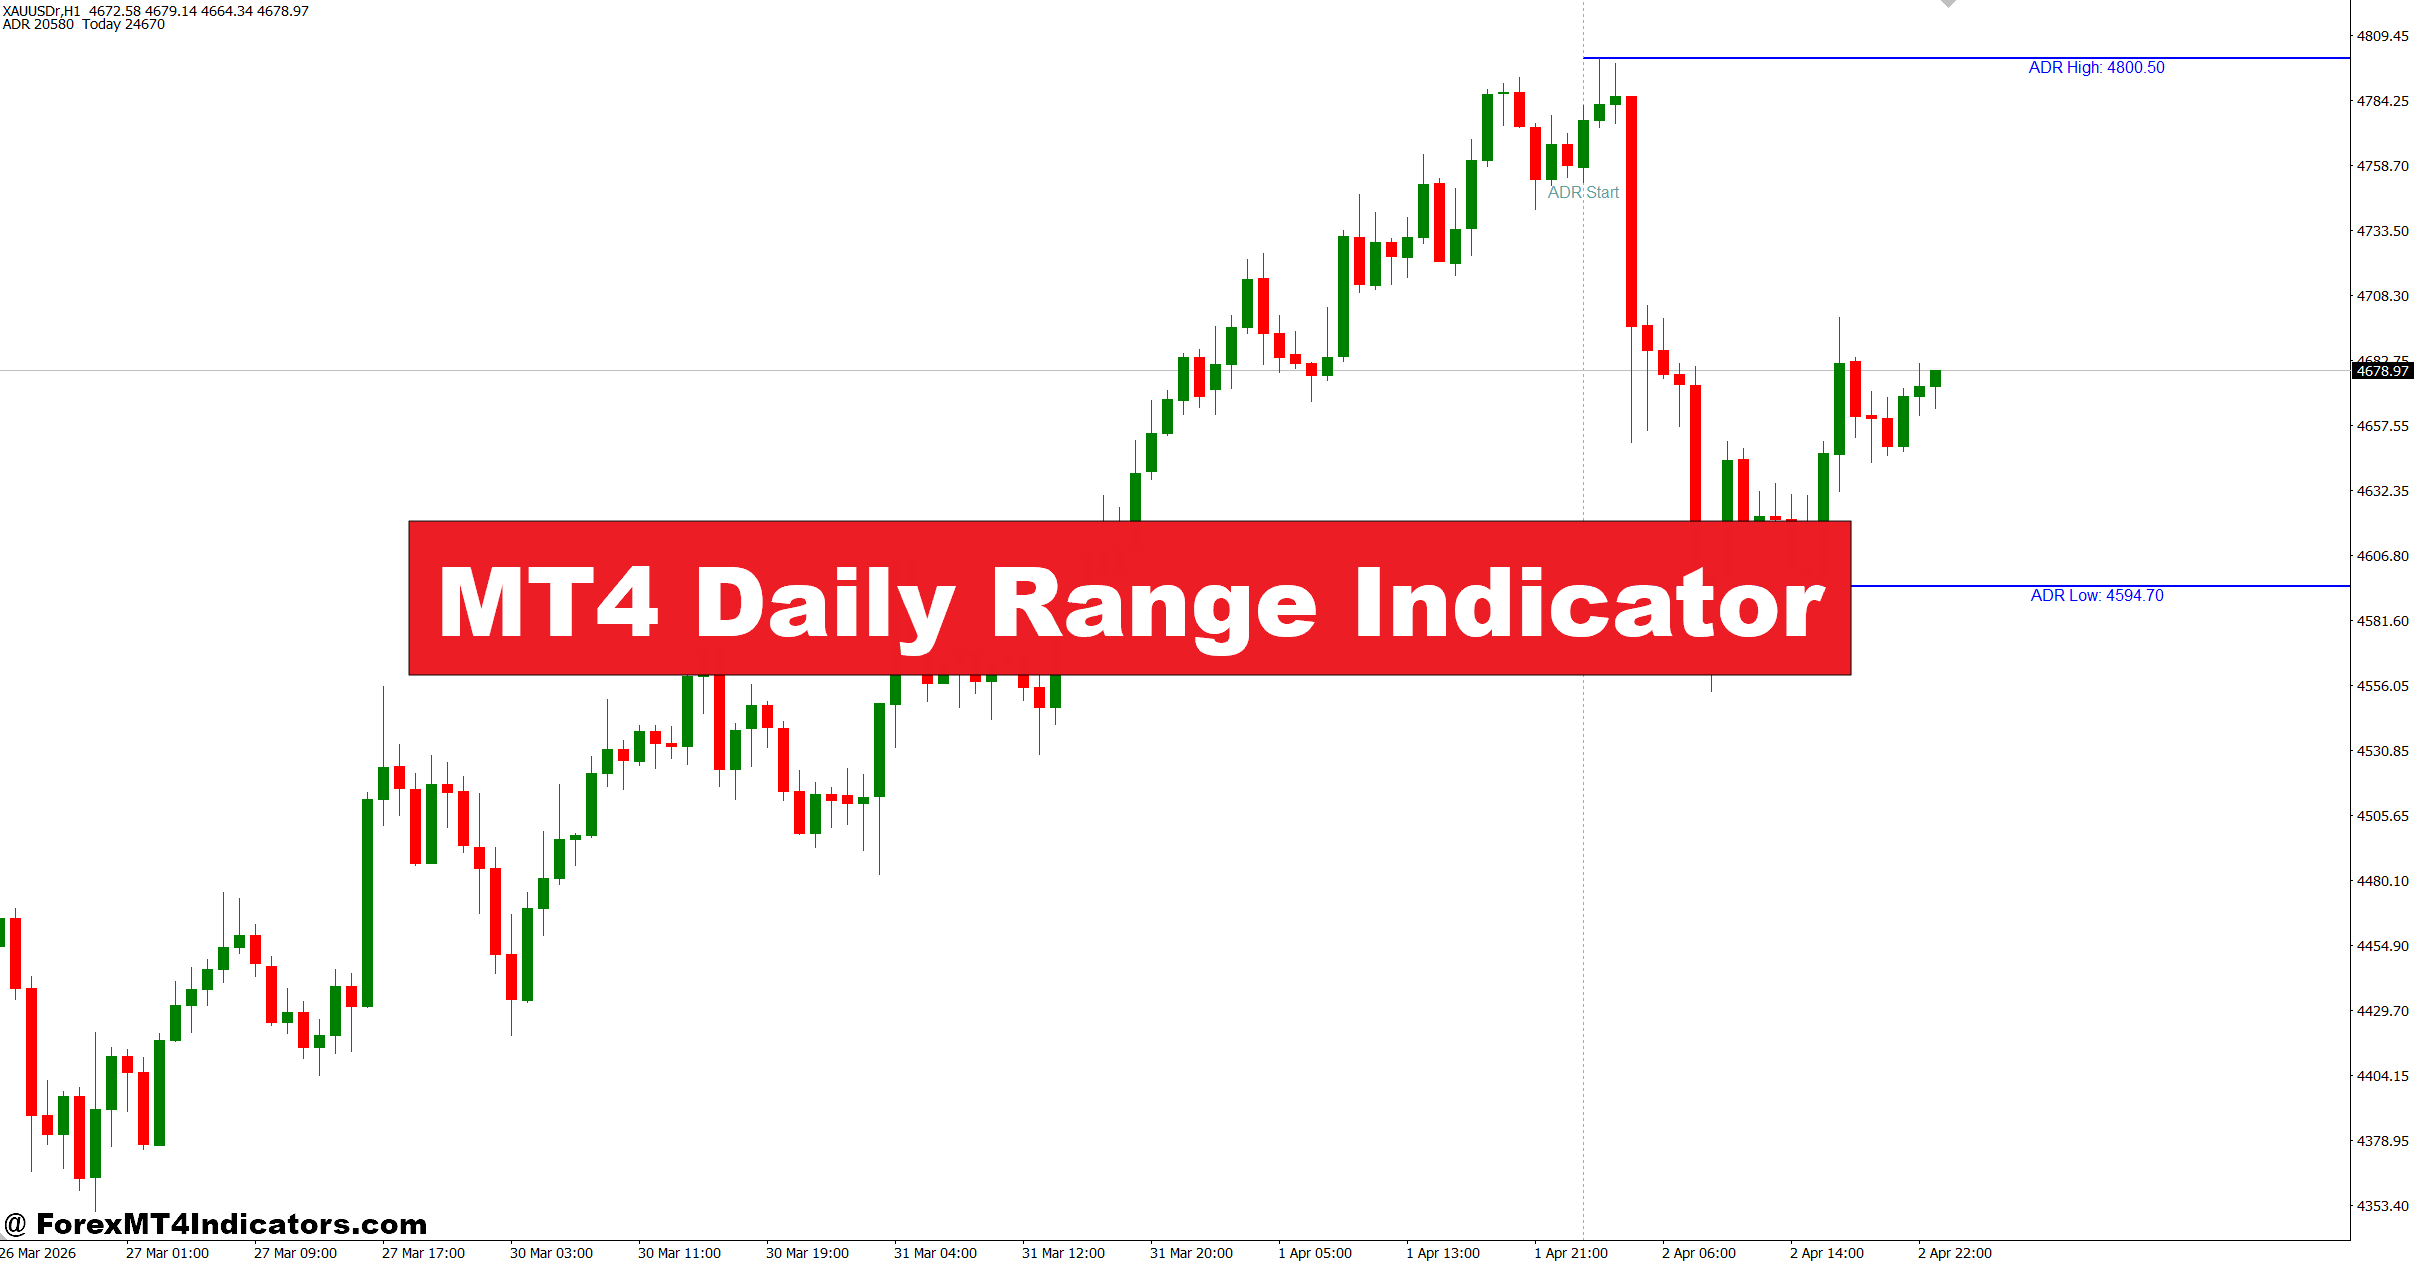
The MT4 Daily Range Indicator helps solve that problem by showing how much a currency pair has already moved during the current trading day. Instead of guessing whether the market still has room to run, traders can compare the current movement with the average daily range and make better decisions. This simple information often keeps traders from chasing price after an extended move or entering during exhausted conditions.
Many traders combine this indicator with trend analysis, support and resistance, and candlestick confirmation. The following sections explain how the indicator works, where it performs best, and how it can fit into a disciplined trading plan.
What Is the MT4 Daily Range Indicator?
The MT4 Daily Range Indicator is a technical analysis tool that measures the distance between the daily high and daily low. Some versions also calculate the Average Daily Range (ADR), which shows the average number of pips a currency pair moves over a selected number of previous trading days.
Instead of predicting future direction, the indicator measures market activity. Traders use it to estimate whether price has already completed most of its expected movement or still has room to continue.
For example, if EUR/USD normally moves around 80 pips per day over the last 20 sessions but has already traveled 75 pips before the New York session opens, many traders become cautious about entering new breakout trades. The remaining potential may be limited compared to the risk involved.
The indicator is popular among day traders, breakout traders, and scalpers because it provides useful context that ordinary trend indicators cannot offer.
How the Indicator Calculates the Daily Range
The basic calculation is simple:
Daily Range = Daily High − Daily Low
An ADR version averages those daily ranges over a chosen period, commonly 5, 10, 14, or 20 trading days.
Suppose GBP/USD produced these daily ranges:
- Monday: 118 pips
- Tuesday: 105 pips
- Wednesday: 110 pips
- Thursday: 98 pips
- Friday: 119 pips
The five-day ADR equals 110 pips. If today’s movement reaches only 55 pips during the London morning, traders know only half of the average range has been covered. That doesn’t guarantee another 55 pips will occur, but it offers useful market context.
Using the MT4 Daily Range Indicator in Real Trading
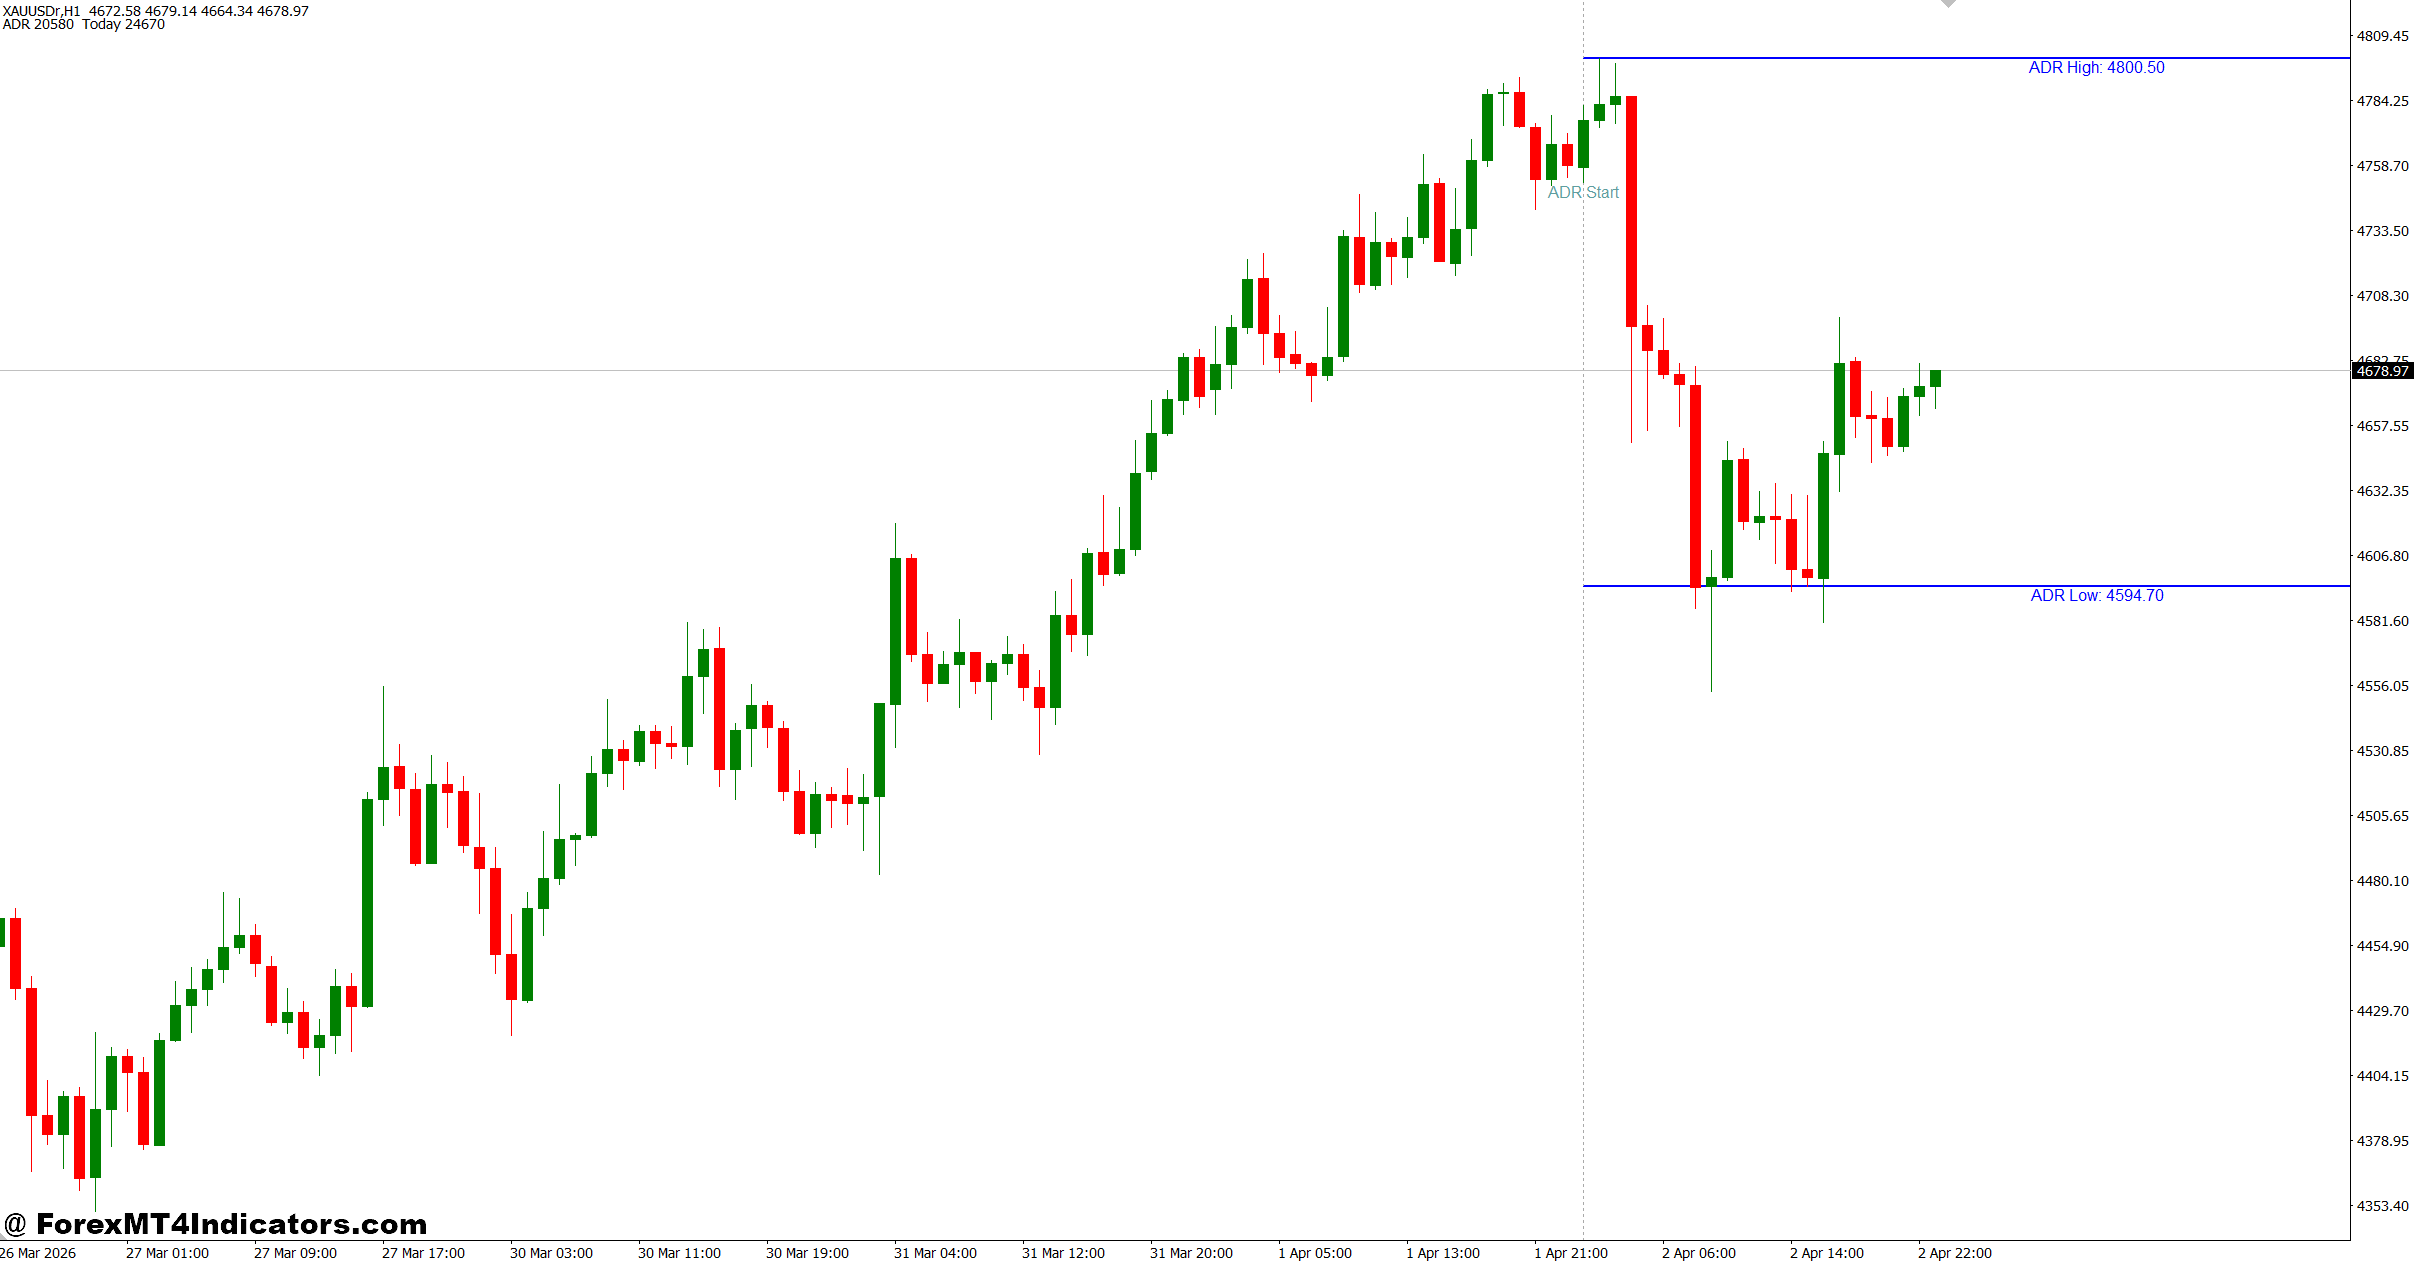
The indicator becomes much more valuable when combined with price action instead of being treated as a standalone signal generator.
Consider EUR/USD on the H1 chart during the London session. The pair breaks above resistance after moving only 30 pips while the 20-day ADR stands at 85 pips. Since price has used only a small portion of its normal daily movement, some traders may look for buying opportunities if volume and momentum support the breakout.
Now imagine another situation.
USD/JPY rallies 95 pips during the Asian and early London sessions while its average daily range is only 100 pips. Price then reaches a major resistance level from the previous week. Many experienced traders avoid buying that breakout because the pair has already completed almost all of its typical daily movement.
When testing this indicator on volatile NFP days, traders often notice that daily ranges expand well beyond historical averages. During those sessions, ADR becomes less reliable because major news can create unusually large moves. That’s why many traders reduce position size or wait until volatility settles before relying on range analysis.
One practical tip is to use the daily range alongside higher-timeframe structure. A breakout above resistance has better odds if price hasn’t already exhausted its normal daily movement.
Best Settings and Customization
Different trading styles require different indicator settings. There isn’t a single perfect configuration.
Scalpers often monitor the current day’s range without relying heavily on long ADR calculations. They mainly want to know whether price has already covered a significant portion of its movement before entering quick trades.
Intraday traders frequently choose a 10-day or 14-day ADR because it reflects recent market conditions without reacting too quickly to temporary spikes.
Swing traders sometimes prefer a 20-day ADR since it smooths out unusual volatility and provides a broader market perspective.
Popular settings include:
Short-Term Trading
- ADR Period: 5-10 days
- Timeframe: M15 to H1
- Best for active London and New York sessions
Intraday Trading
- ADR Period: 14 days
- Timeframe: H1
- Suitable for EUR/USD, GBP/USD, USD/JPY, and AUD/USD
Longer-Term Analysis
- ADR Period: 20 days
- Timeframe: H4
- Useful for identifying changing market volatility
But traders shouldn’t treat these numbers as fixed rules. Currency pairs behave differently. GBP/JPY usually moves much more than EUR/CHF, so expectations should always match the pair being traded.
Strengths, Weaknesses, and Comparison With Other Indicators
The biggest strength of the MT4 Daily Range Indicator is its simplicity. It gives traders a quick view of market potential without adding unnecessary complexity to the chart.
Another advantage is trade management. If price has already covered nearly 100% of its average daily movement, traders may tighten stop-loss levels, reduce profit expectations, or simply wait for the next trading session.
Still, the indicator has clear limitations.
It doesn’t predict direction. A pair may reach its average daily range and continue another 70 pips if strong news enters the market. Likewise, price may move only half of its usual range during quiet sessions.
Trading forex carries substantial risk. No indicator guarantees profits. Daily range analysis should always be combined with price action, market structure, and sound risk management.
Compared with the Average True Range (ATR), the Daily Range Indicator focuses specifically on daily movement between highs and lows. ATR measures overall volatility over any selected timeframe, making it useful for stop-loss placement. The Daily Range Indicator is more useful when traders want to estimate how much of today’s movement has already occurred.
Compared with Bollinger Bands, the Daily Range Indicator doesn’t attempt to identify overbought or oversold conditions. Instead, it measures distance traveled. Many traders actually use both tools together to gain a better understanding of volatility and market behavior.
How to Trade with MT4 Daily Range Indicator
Buy Entry
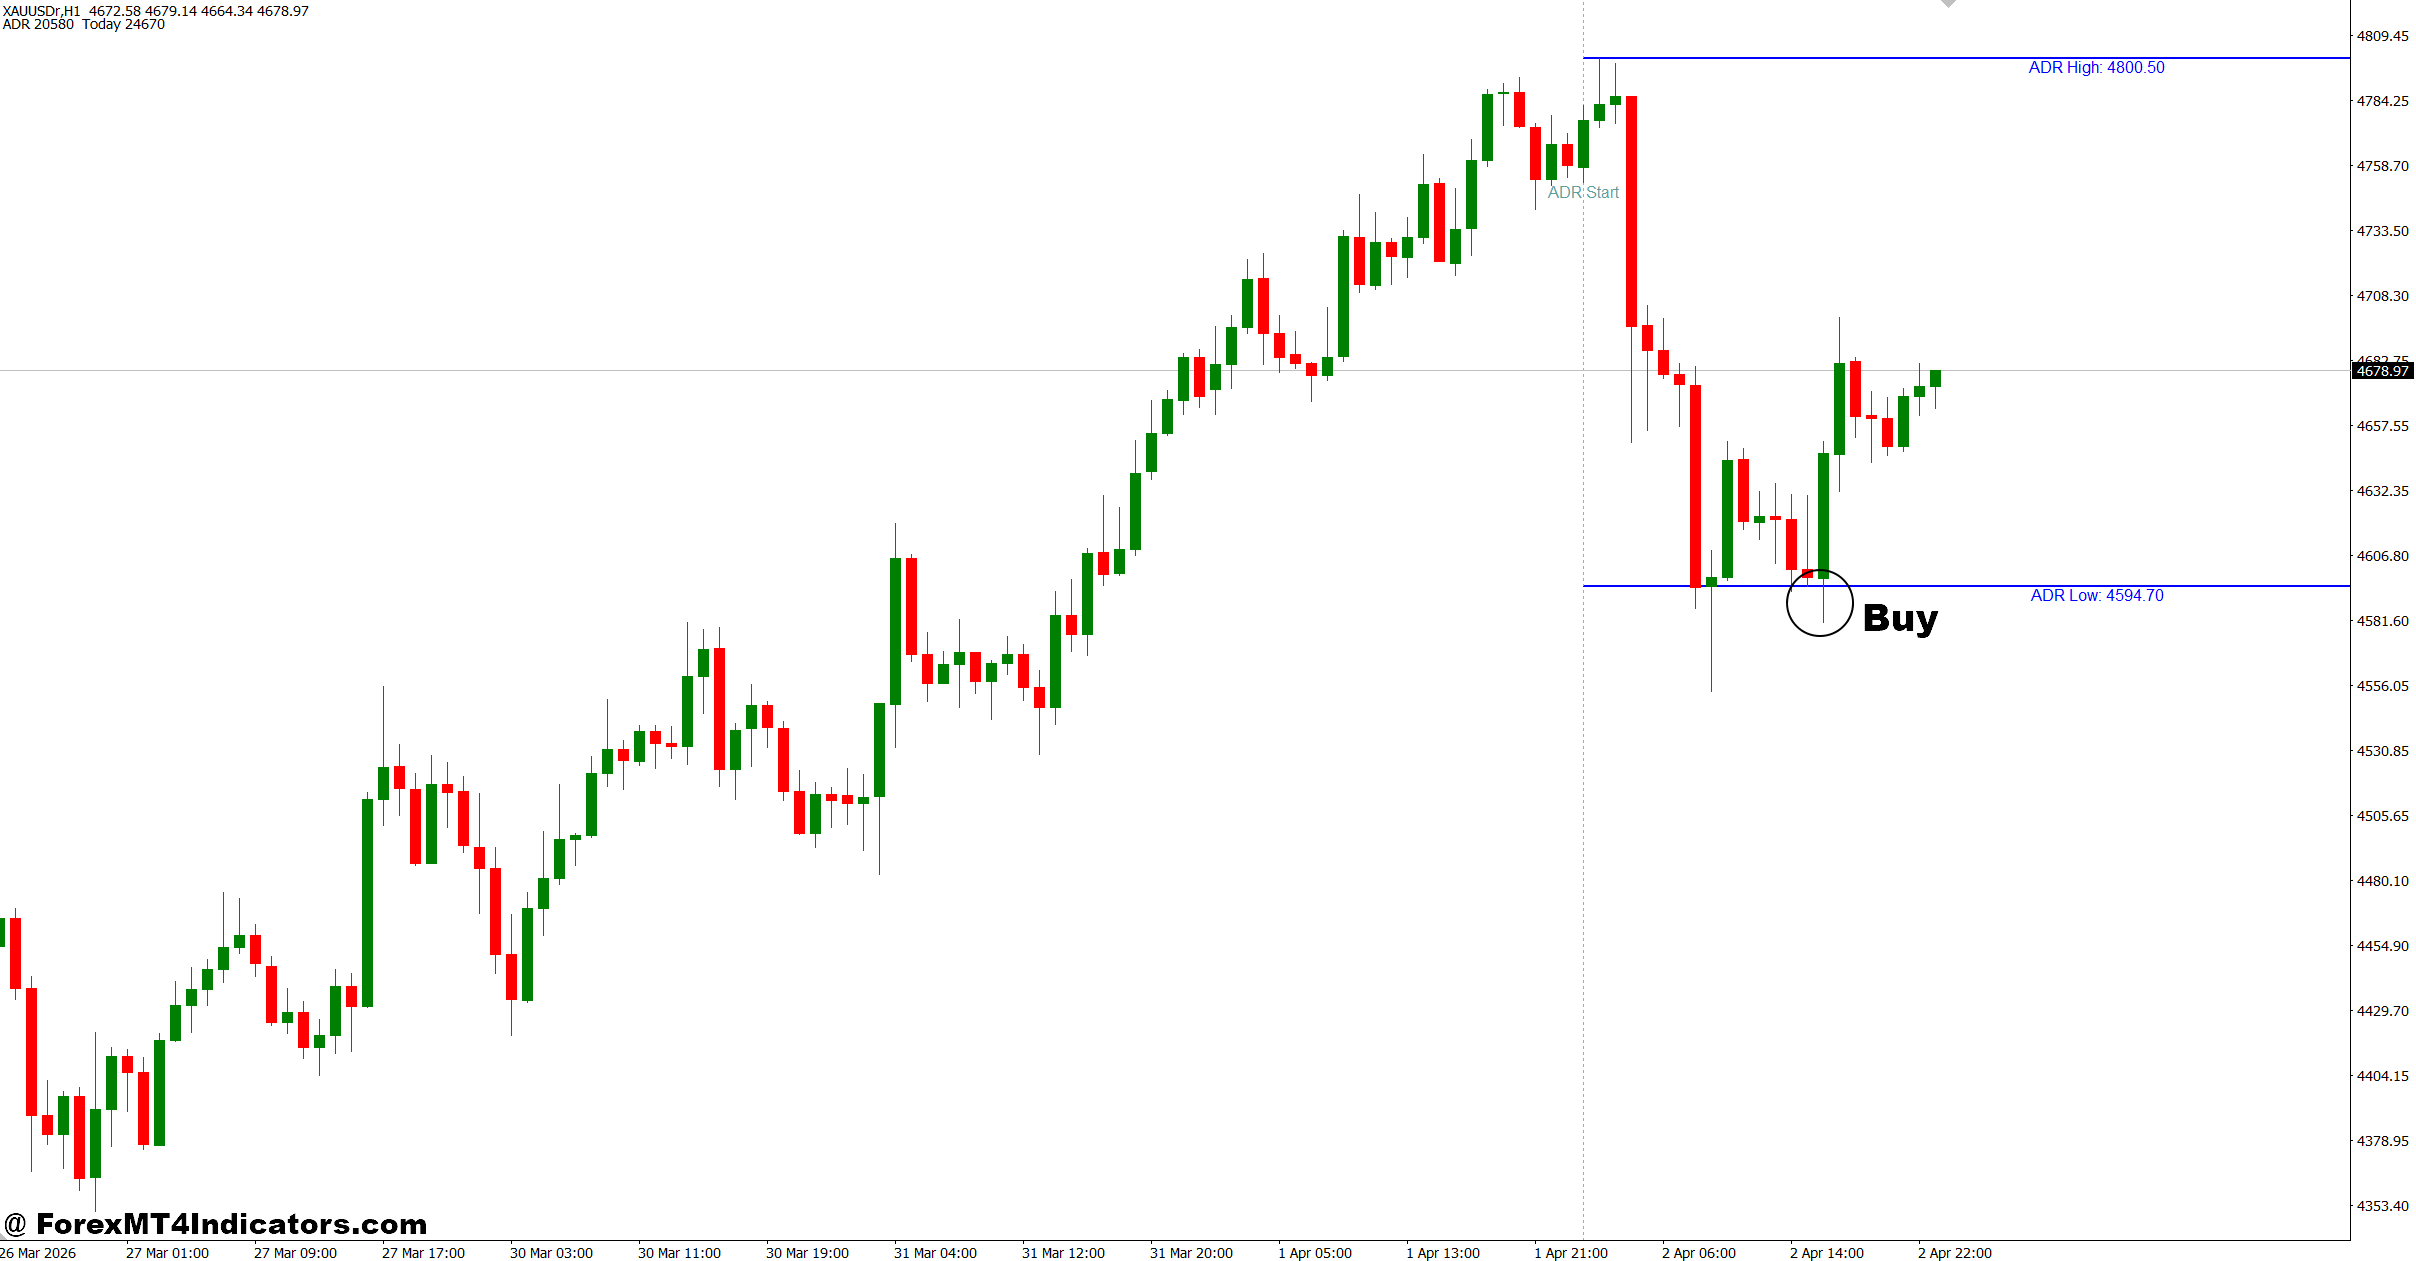
- Buy below 60% ADR – Enter on EUR/USD H1 if price has covered less than 60% of its Average Daily Range and breaks resistance.
- Confirm with bullish candle – Wait for a strong bullish close on the 1-hour chart before opening a buy trade.
- Trade after pullback – Buy when price retests support with 20-40 pips of daily range still available.
- Place stop-loss wisely – Keep the stop-loss 15-25 pips below the recent swing low.
- Target remaining range – Aim for 20-50 pips if the pair has not reached its normal daily range.
- Trade active sessions – Focus on the London or New York session for stronger momentum.
- Skip overextended moves – Avoid buying if 90-100% ADR has already been completed.
- Manage risk – Risk only 1-2% of your account on each trade.
Sell Entry
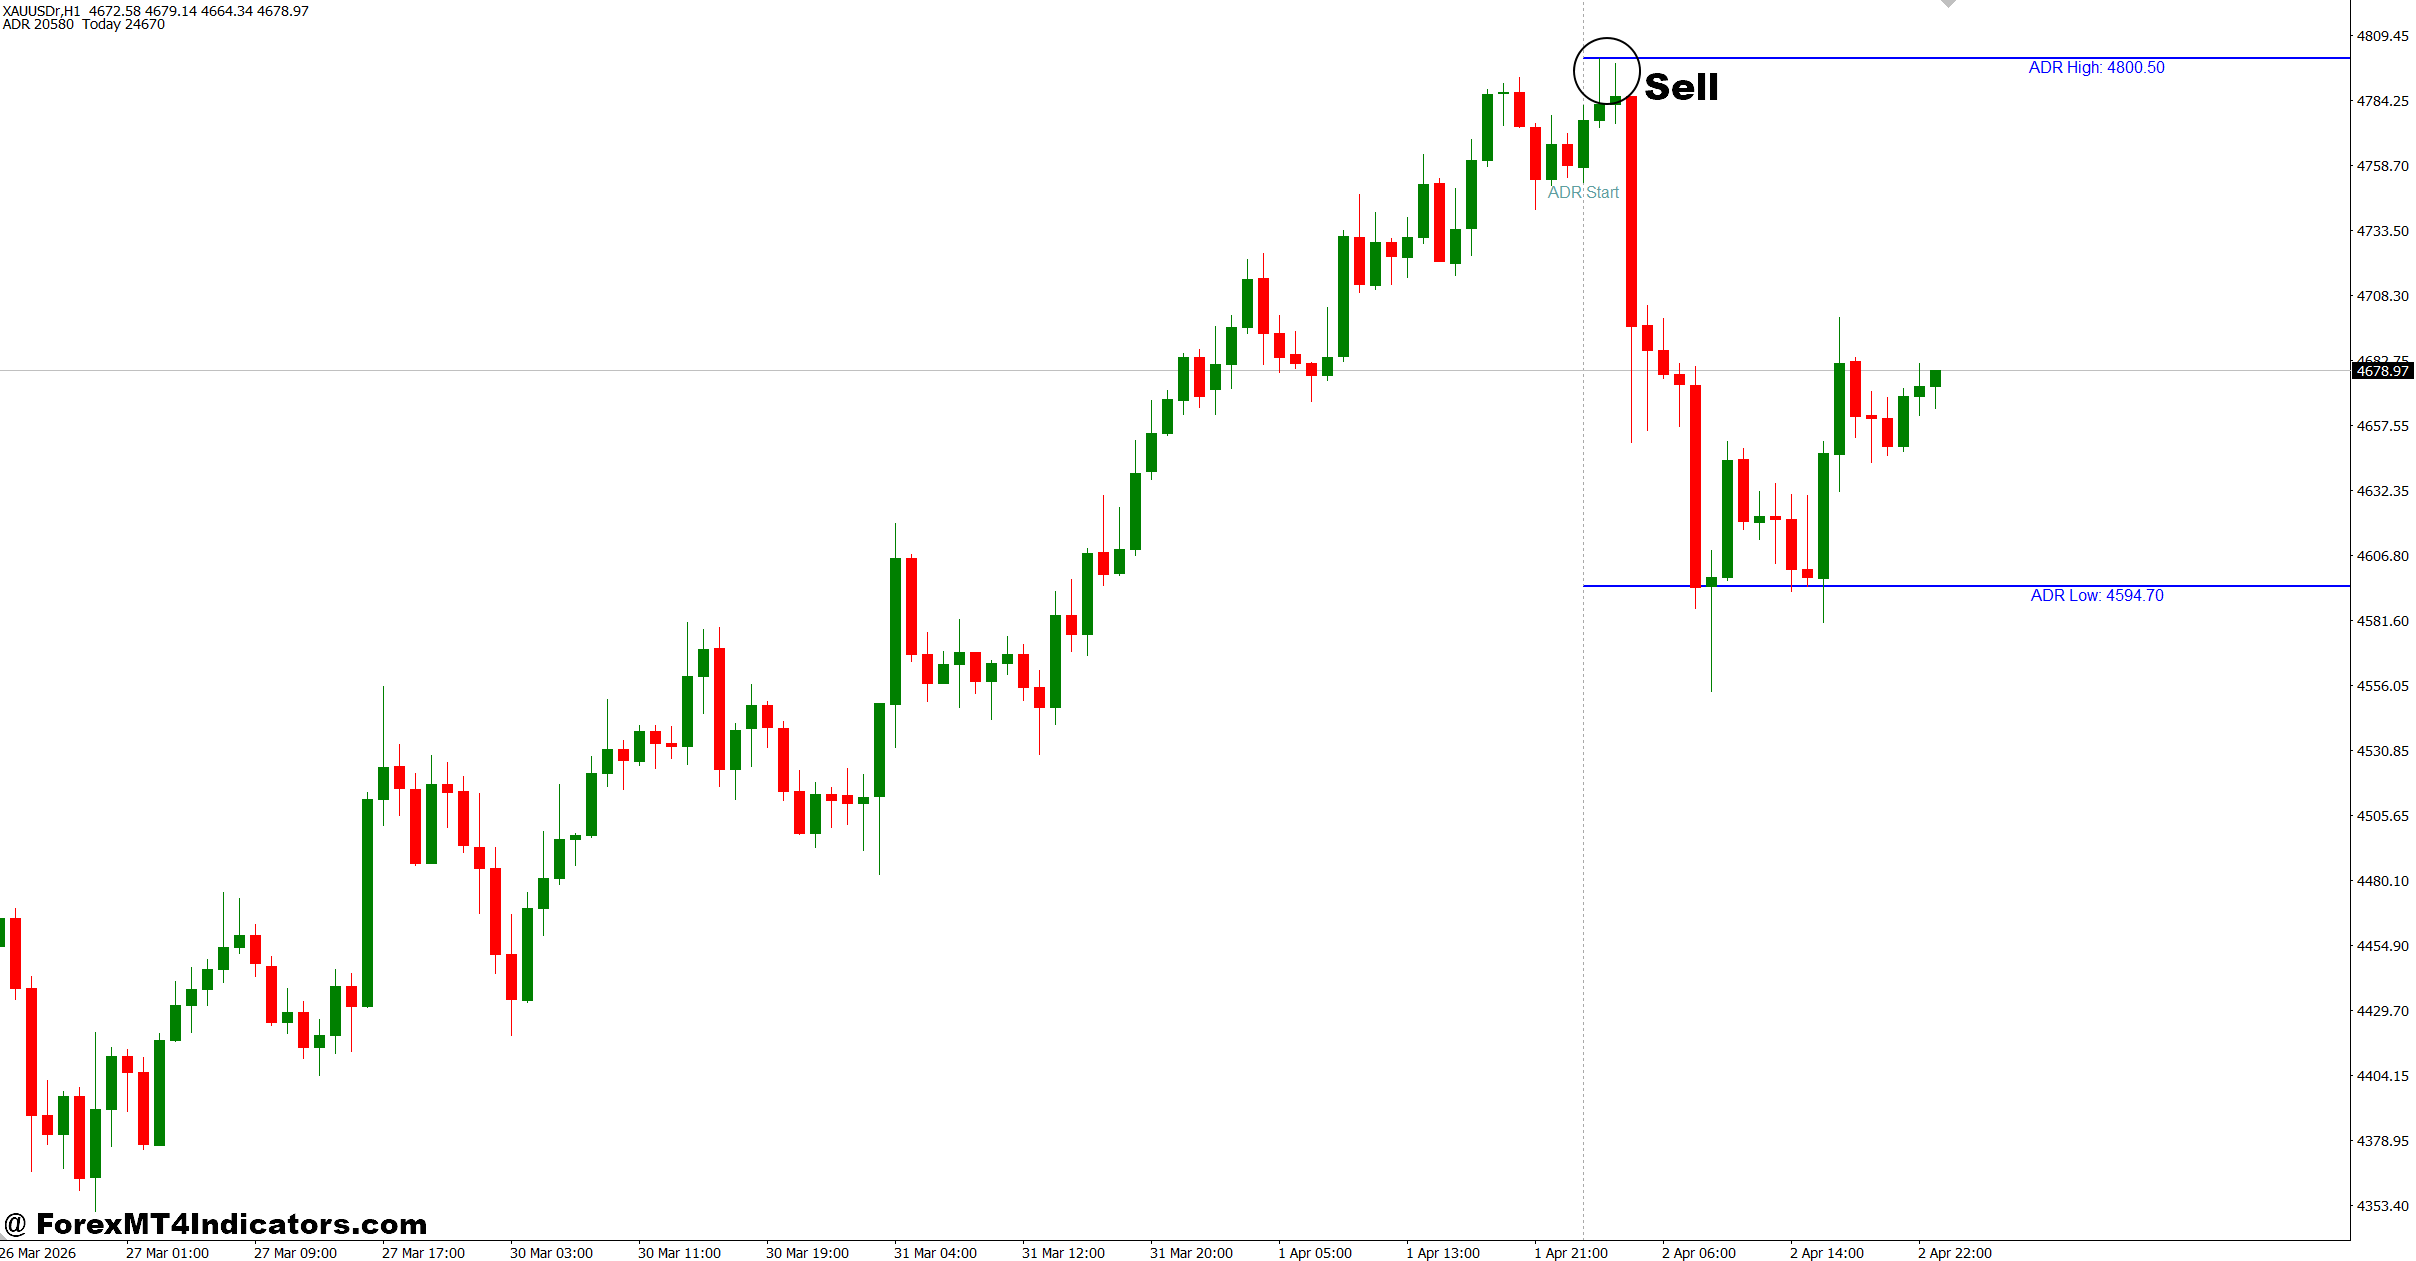
- Sell below resistance – Enter on GBP/USD H1 after a bearish rejection near resistance with room left in the daily range.
- Confirm bearish momentum – Wait for a bearish candle close on the 1-hour or 4-hour chart.
- Sell after pullback – Look for lower highs before entering a short position.
- Set stop-loss above swing – Place the stop-loss 15-30 pips above the latest swing high.
- Target unused range – Aim for 25-50 pips if less than 80% ADR has been completed.
- Avoid news volatility – Skip signals during high-impact events like NFP or central bank announcements.
- Don’t chase late trades – Avoid selling after price has already reached 90-100% of its average daily range.
- Protect your capital – Use a minimum 1:2 risk-to-reward ratio before entering.
Final Thoughts
The MT4 Daily Range Indicator offers valuable context that many traders overlook. It helps answer a simple but important question: how much has the market already moved today? That information can improve trade timing, reduce emotional entries, and support better risk management. Key points include: traders can compare today’s movement with the average daily range before entering; combining the indicator with support, resistance, and price action produces stronger analysis; unusual news events can push price beyond normal ranges, so flexibility remains essential; and no indicator should replace proper money management. Used with realistic expectations and a well-tested strategy, the MT4 Daily Range Indicator can become a useful part of a consistent trading routine.
Level up your trading
Learn to read the chart — not just the indicator
eBook · Instant PDF
Video Course · 12 modules
Recommended MT4/MT5 Brokers
- ✓ *FREE *$50 to start (withdrawable)
- ✓ Deposit bonus up to $5,000
- ✓ Negative balance protection
Trading forex and CFDs carries a significant risk of loss and is not suitable for everyone. Broker links are affiliate links — we may earn a commission at no cost to you.
Free MT4 Indicator Download

Enter Your Email Address below, download link will be sent to you.