


The Luxalgo SMC Indicator MT5 was designed to help traders visualize market structure, liquidity zones, and institutional activity directly on the chart. Instead of guessing where the market might turn, traders can identify areas where larger participants are likely entering or exiting positions.
Used correctly, the indicator can help traders align with market structure rather than fight against it. The sections below explain how the tool works, how traders apply it in real trading situations, and where it fits within a disciplined trading strategy.
What Is the Luxalgo SMC Indicator MT5?
The Luxalgo SMC Indicator MT5 is a technical analysis tool built around Smart Money Concepts (SMC). These concepts focus on how institutional traders influence price movement through liquidity, order blocks, and structural shifts.
Rather than relying on simple moving averages or oscillators, the indicator analyzes price structure. It highlights key elements such as:
- Order blocks
- Break of structure (BOS)
- Change of character (CHoCH)
- Liquidity zones
- Fair value gaps
These components help traders understand where large orders may be sitting in the market.
For example, when testing the indicator on GBP/USD on the 4-hour chart, a clear bullish break of structure appeared after price formed a higher low. Shortly after, the indicator marked a bullish order block. When price later returned to that zone, it bounced nearly 60 pips during the London session.
This type of insight helps traders plan entries around institutional activity instead of random chart patterns.
How the Luxalgo SMC Indicator Works
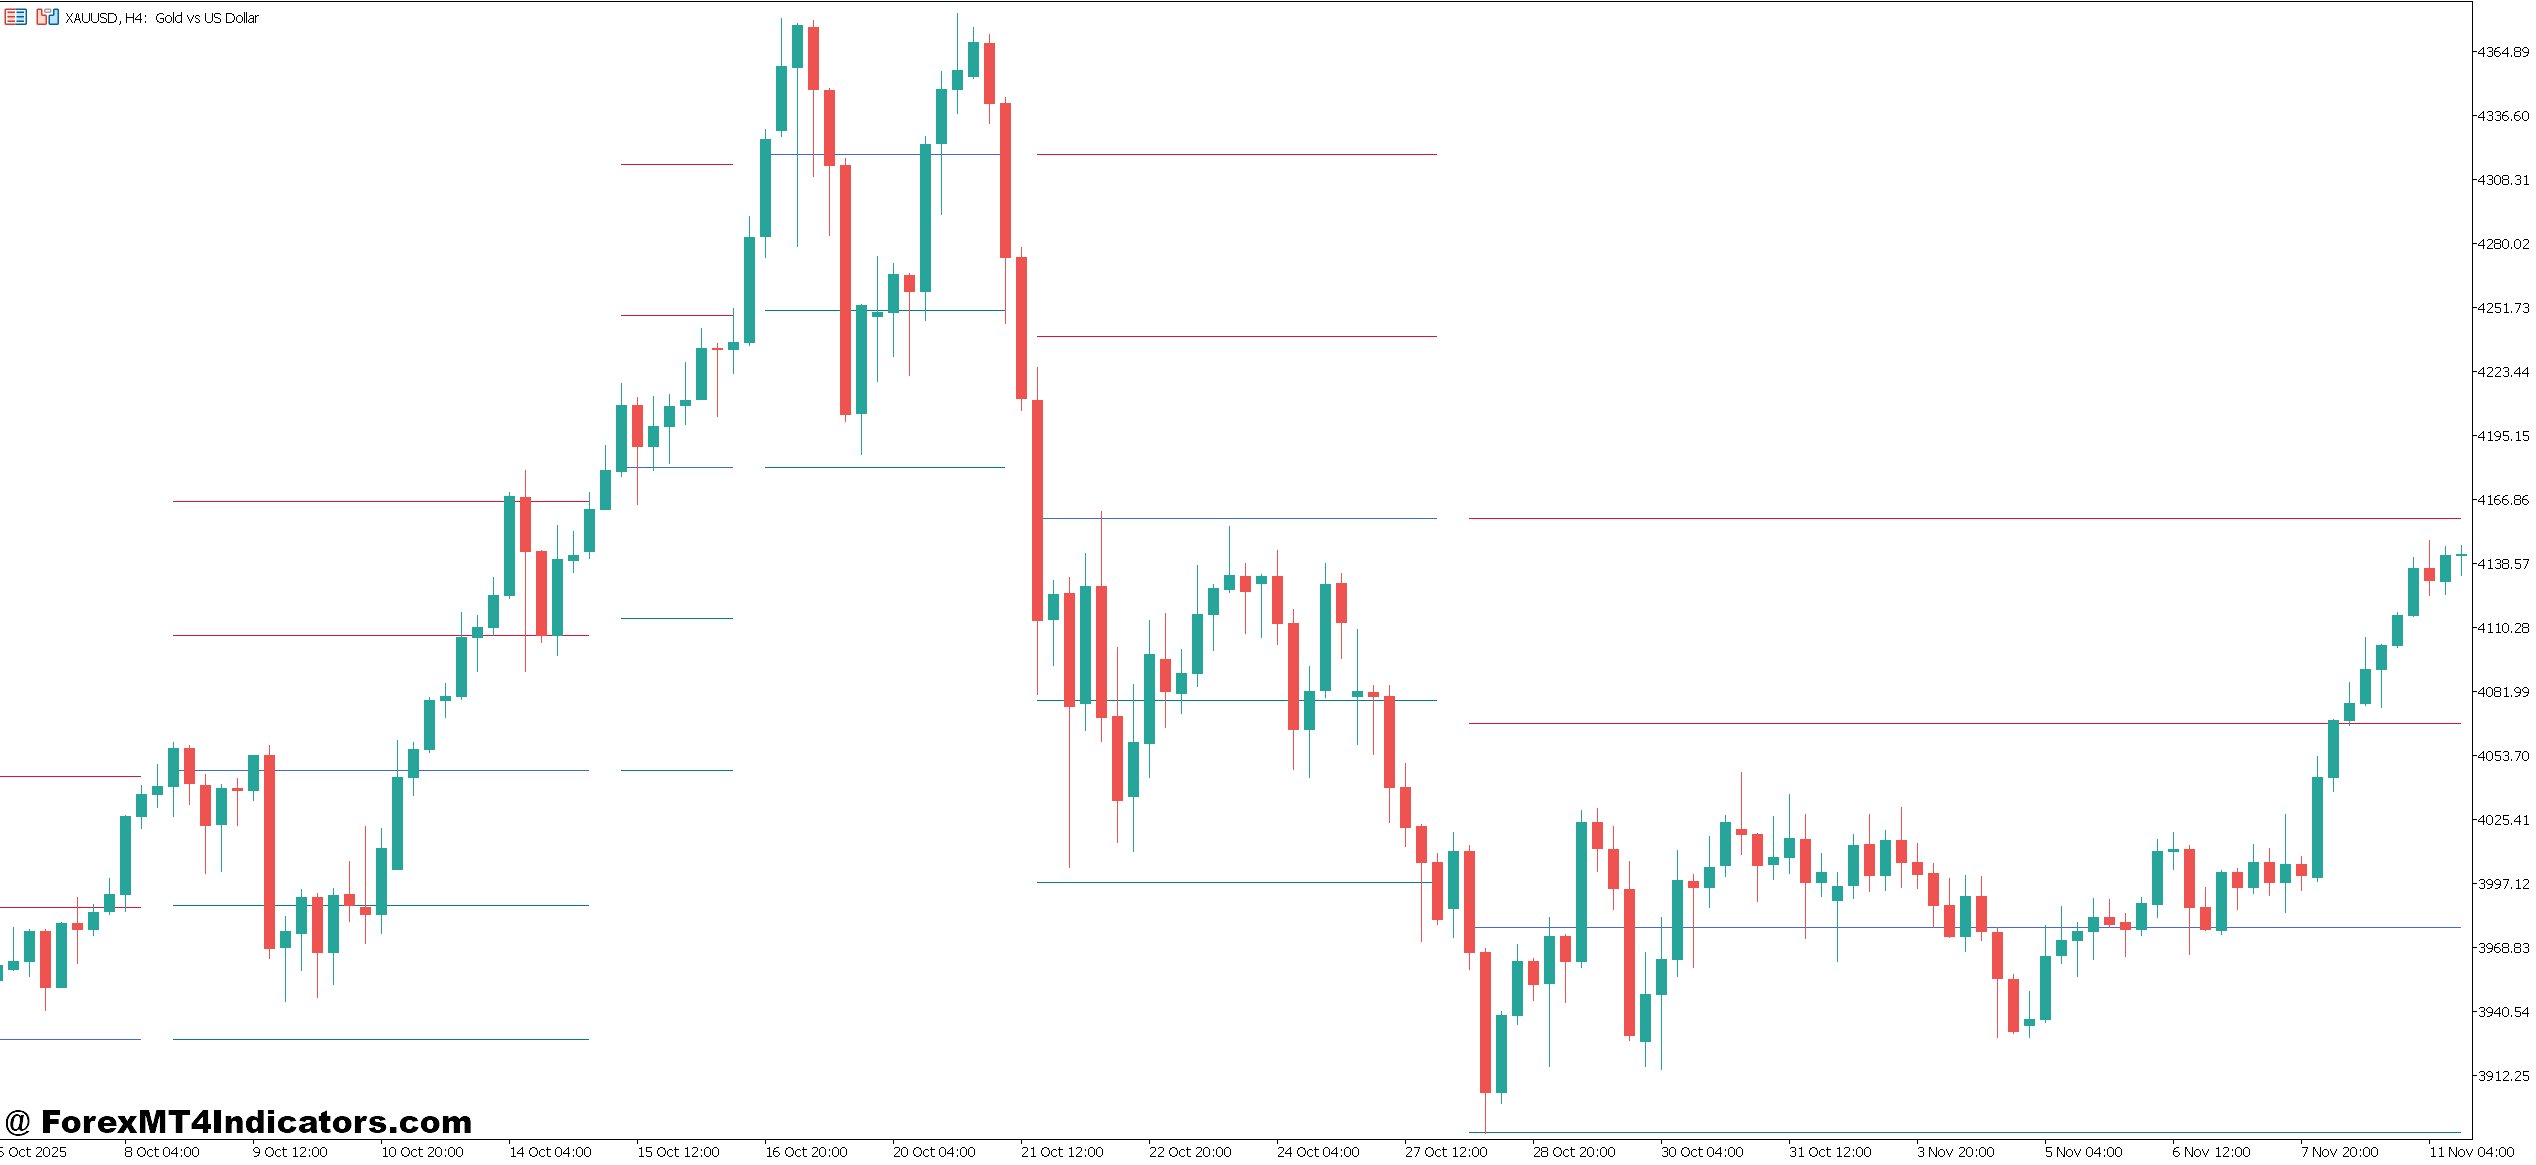
The logic behind the indicator focuses on identifying market structure shifts and areas of liquidity.
Market Structure Detection
The indicator scans historical price swings to identify higher highs, higher lows, lower highs, and lower lows.
When price breaks a previous swing level, the indicator marks a Break of Structure (BOS). This usually confirms that the trend is continuing.
A Change of Character (CHoCH) appears when the market shifts direction. For instance, during a downtrend the indicator might detect the first higher high, signaling that buyers are gaining control.
Order Block Identification
Order blocks represent areas where institutions previously placed large orders. The indicator highlights these zones based on the last bullish or bearish candle before a strong move.
Example from testing:
- USD/JPY on the 1-hour chart
- A bearish order block formed near 151.20
- Price later retested the zone
- The pair dropped around 35 pips within two candles
This type of setup often attracts traders who follow price action strategies.
Liquidity and Imbalance Zones
Markets often move toward areas where stop losses or pending orders exist. The indicator attempts to detect these liquidity pools and fair value gaps.
When price fills an imbalance zone, it frequently slows down or reverses. Experienced traders watch these zones closely during major sessions like London or New York.
Practical Trading Applications
Understanding the indicator is one thing. Applying it correctly is where most traders improve their results.
Trend Continuation Example
A common setup occurs after a break of structure.
Imagine EUR/USD on the 1-hour chart during an uptrend.
- Price breaks a previous high (BOS signal).
- The indicator marks a bullish order block below the breakout.
- Price retraces back into that zone.
- A bullish rejection candle forms.
Many traders place a buy trade with:
- Stop loss: 10–20 pips below the order block
- Target: previous swing high or 40–60 pips
During backtesting, these setups tend to perform better when they occur during London session volatility.
Liquidity Grab Reversal
Another situation appears when price sweeps liquidity.
Example:
- Gold (XAU/USD) on the 15-minute chart
- Price spikes above a previous high
- The indicator marks a liquidity sweep
- Market structure shifts bearish
This often signals a potential reversal. Some traders wait for a bearish order block before entering.
Combining with Other Indicators
The Luxalgo SMC Indicator works best when paired with confirmation tools such as:
- RSI divergence
- Volume indicators
- Moving averages
For instance, when RSI divergence appears near an order block, the probability of a reversal may increase.
Luxalgo SMC Indicator MT5 Settings and Customization
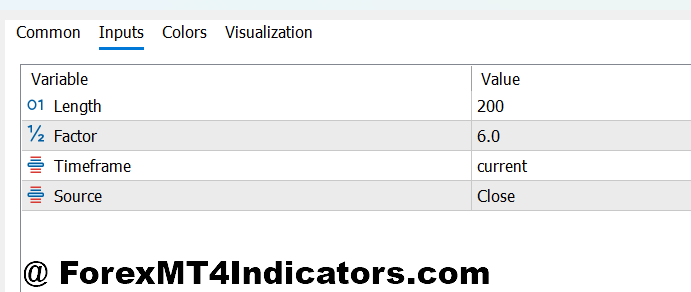
The indicator includes several adjustable settings that traders often modify depending on their strategy.
Market Structure Sensitivity
This parameter controls how frequently the indicator identifies structure changes.
- Lower sensitivity: fewer signals, stronger trends
- Higher sensitivity: more signals, useful for scalping
Day traders using 5-minute or 15-minute charts often increase sensitivity slightly.
Order Block Detection Range
Some traders prefer highlighting only major order blocks. Adjusting this setting reduces chart clutter and focuses on stronger zones.
Swing traders on 4-hour or daily charts usually keep this filter stricter.
Liquidity Zone Display
The indicator can display liquidity levels from recent highs and lows. These zones help traders anticipate where stop losses might be clustered.
But too many levels can create confusion. Many traders limit the display to recent 20–50 candles.
Advantages and Limitations
No indicator is perfect, and the Luxalgo SMC Indicator MT5 is no exception.
Advantages
- Clear market structure visualization: The indicator simplifies complex price action concepts. Traders can quickly see where the market trend changes.
- Institutional-style analysis: Order blocks and liquidity zones provide insight into areas where larger players may participate.
- Useful across timeframes: It works on scalping charts like M5 as well as swing trading charts like H4 or Daily.
Limitations
- Signals require confirmation: Order blocks alone don’t guarantee a reversal. Price can move straight through them during strong trends.
- Not ideal during extremely choppy markets: When price ranges tightly, the indicator may generate multiple structure signals that lead to whipsaw trades.
- Learning curve for beginners: Smart Money Concepts involve several ideas that take time to understand.
Traders often spend weeks studying how liquidity and structure interact before using the tool confidently.
Comparison With Similar Indicators
Several market structure indicators exist in the MetaTrader ecosystem.
- Traditional Support and Resistance Indicators: These tools draw horizontal levels based on previous highs and lows. While helpful, they lack the structural context that SMC indicators provide.
- ZigZag Indicators: ZigZag focuses on swing highs and lows. However, it doesn’t highlight order blocks or liquidity zones.
- ICT-Based Indicators: Some traders use indicators based on Inner Circle Trader concepts. The Luxalgo SMC version often provides cleaner visuals and automated structure detection.
In practice, traders sometimes combine these tools. For example, a ZigZag swing level aligning with an order block can strengthen a trade setup.
How to Trade with Luxalgo SMC Indicator MT5
Buy Entry
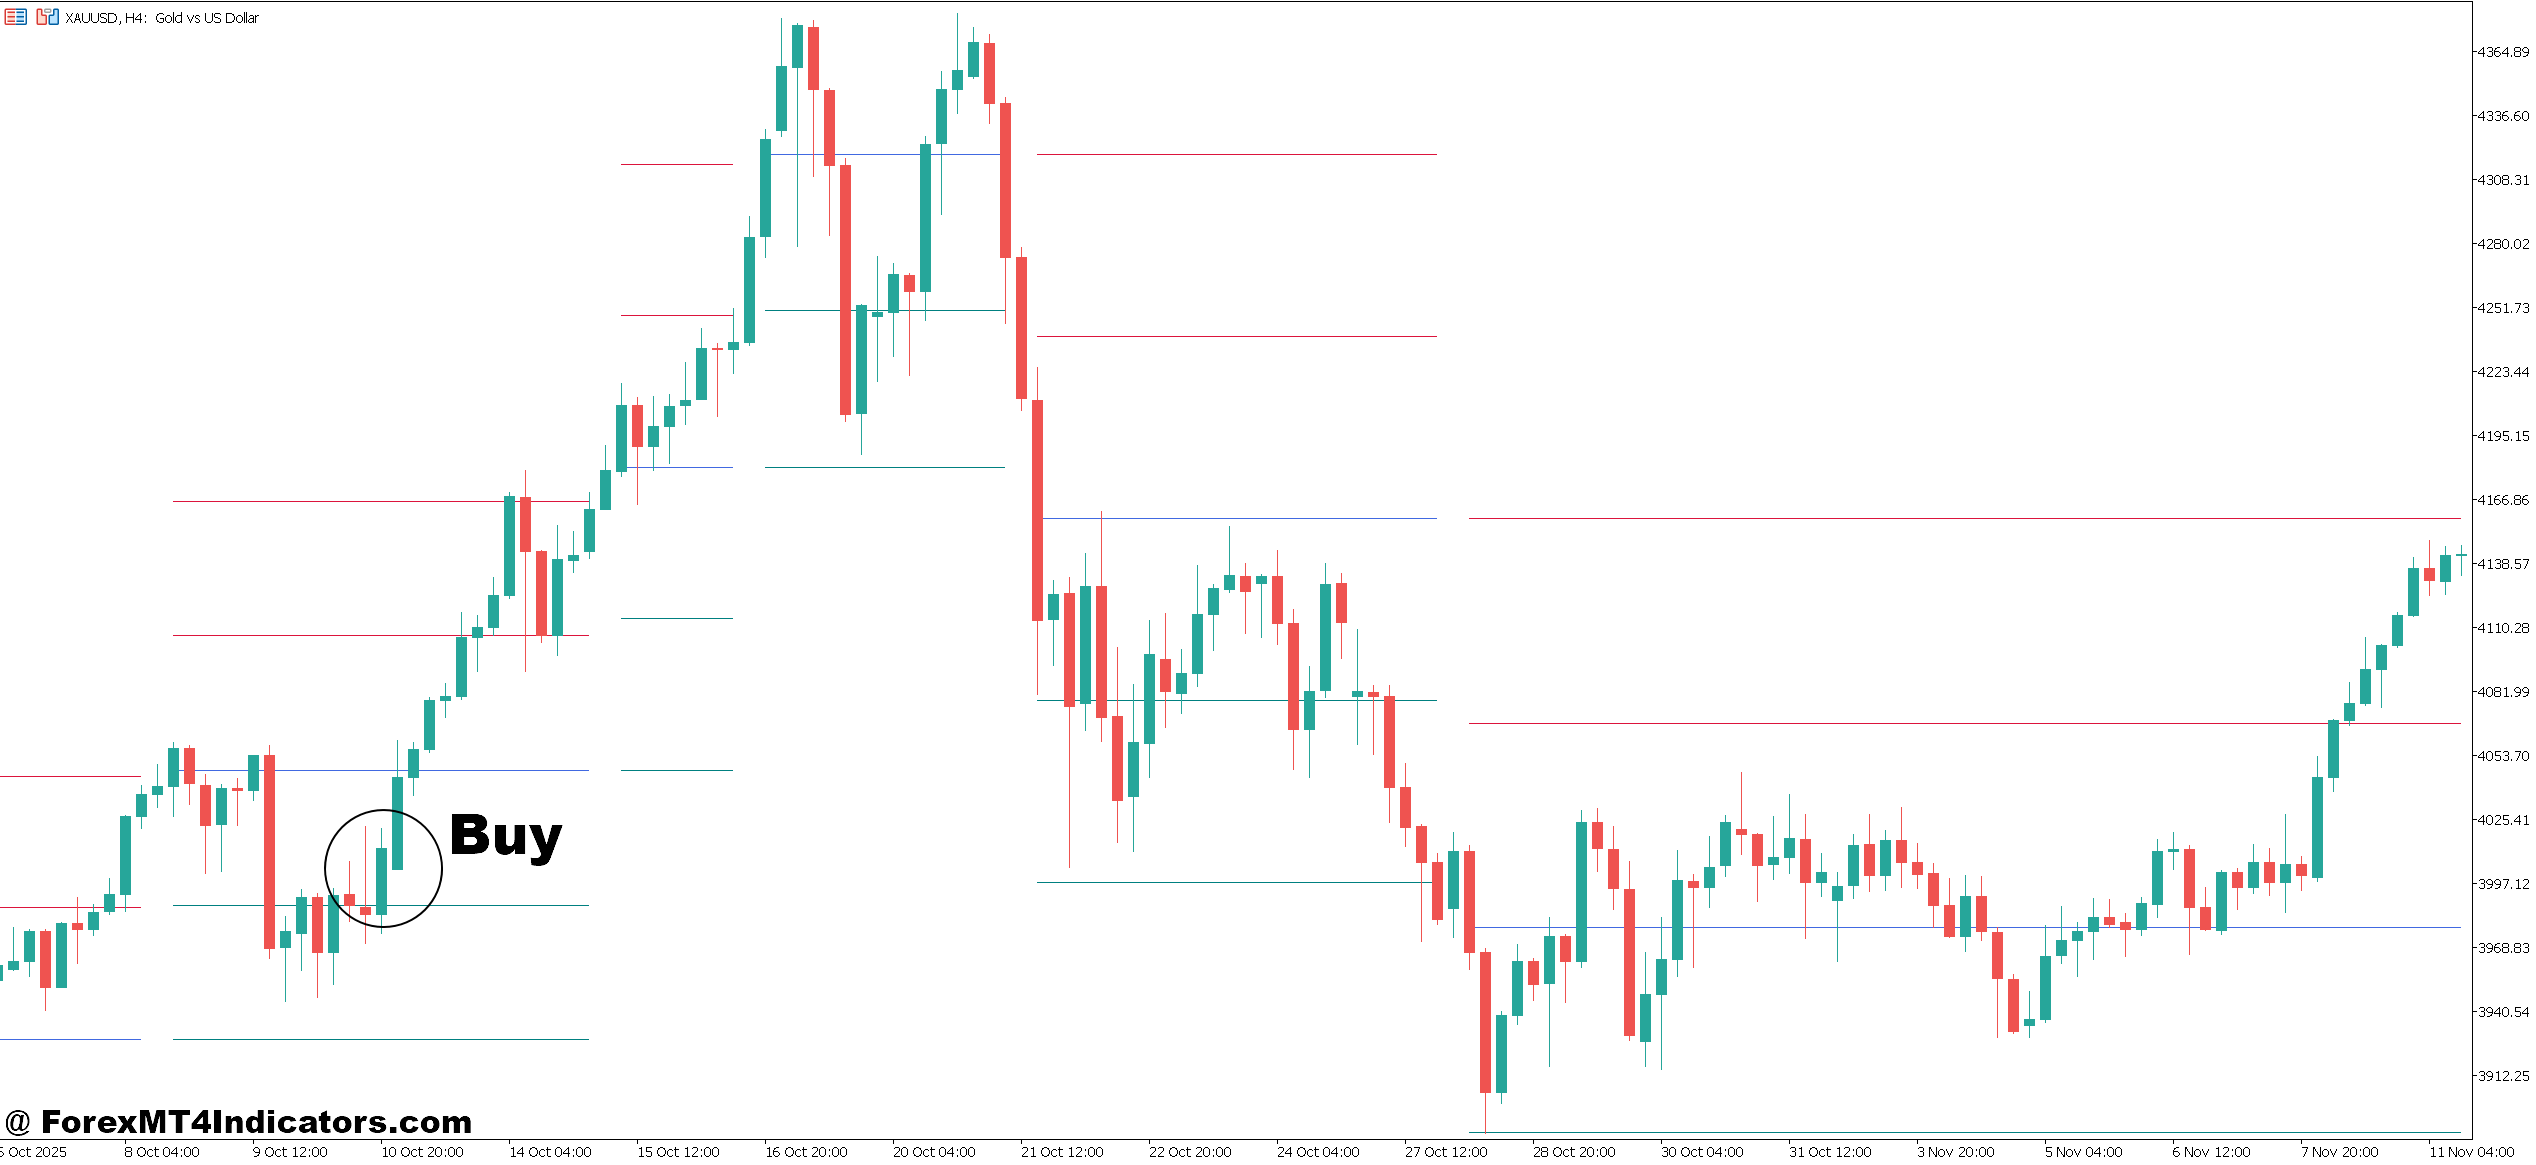
- Buy after bullish Break of Structure (BOS) – When the indicator shows a bullish BOS on the EUR/USD 1-hour chart, wait for price to pull back into the highlighted bullish order block and enter buy. Place a stop loss 15–25 pips below the zone and aim for 40–60 pips or the next resistance level.
- Enter buy on order block retest – If GBP/USD on the 4-hour timeframe returns to a bullish order block after a strong impulse move, watch for a rejection candle. Enter buy once the candle closes and keep risk below 2% of account balance.
- Buy after liquidity sweep below support – When price briefly drops 10–20 pips below a previous low and the Luxalgo SMC indicator marks liquidity taken, it often signals smart money accumulation. Look for buy confirmation on M15 or H1 charts.
- Buy when Change of Character (CHoCH) appears – If a downtrend shifts and the indicator prints a CHoCH on EUR/USD 1-hour, it may signal a new bullish phase. Traders often target 30–50 pips while protecting the trade with a 20-pip stop loss.
- Buy inside a fair value gap support zone – When price retraces into a fair value gap detected by the indicator during a bullish trend, it often fills the imbalance before moving higher. This setup works well on GBP/USD 1-hour charts.
- Use higher timeframe confirmation – If the daily chart shows a bullish order block and the 1-hour chart confirms BOS, it strengthens the buy signal. Multi-timeframe alignment can improve trade accuracy.
- Buy during strong market sessions – Many traders only take Luxalgo SMC buy signals during London or New York sessions, when volatility can deliver 40+ pip moves.
- Avoid buys in choppy ranges – If price is moving sideways within a 15–20 pip range, ignore buy signals. Market structure tools perform better in trending conditions.
Sell Entry
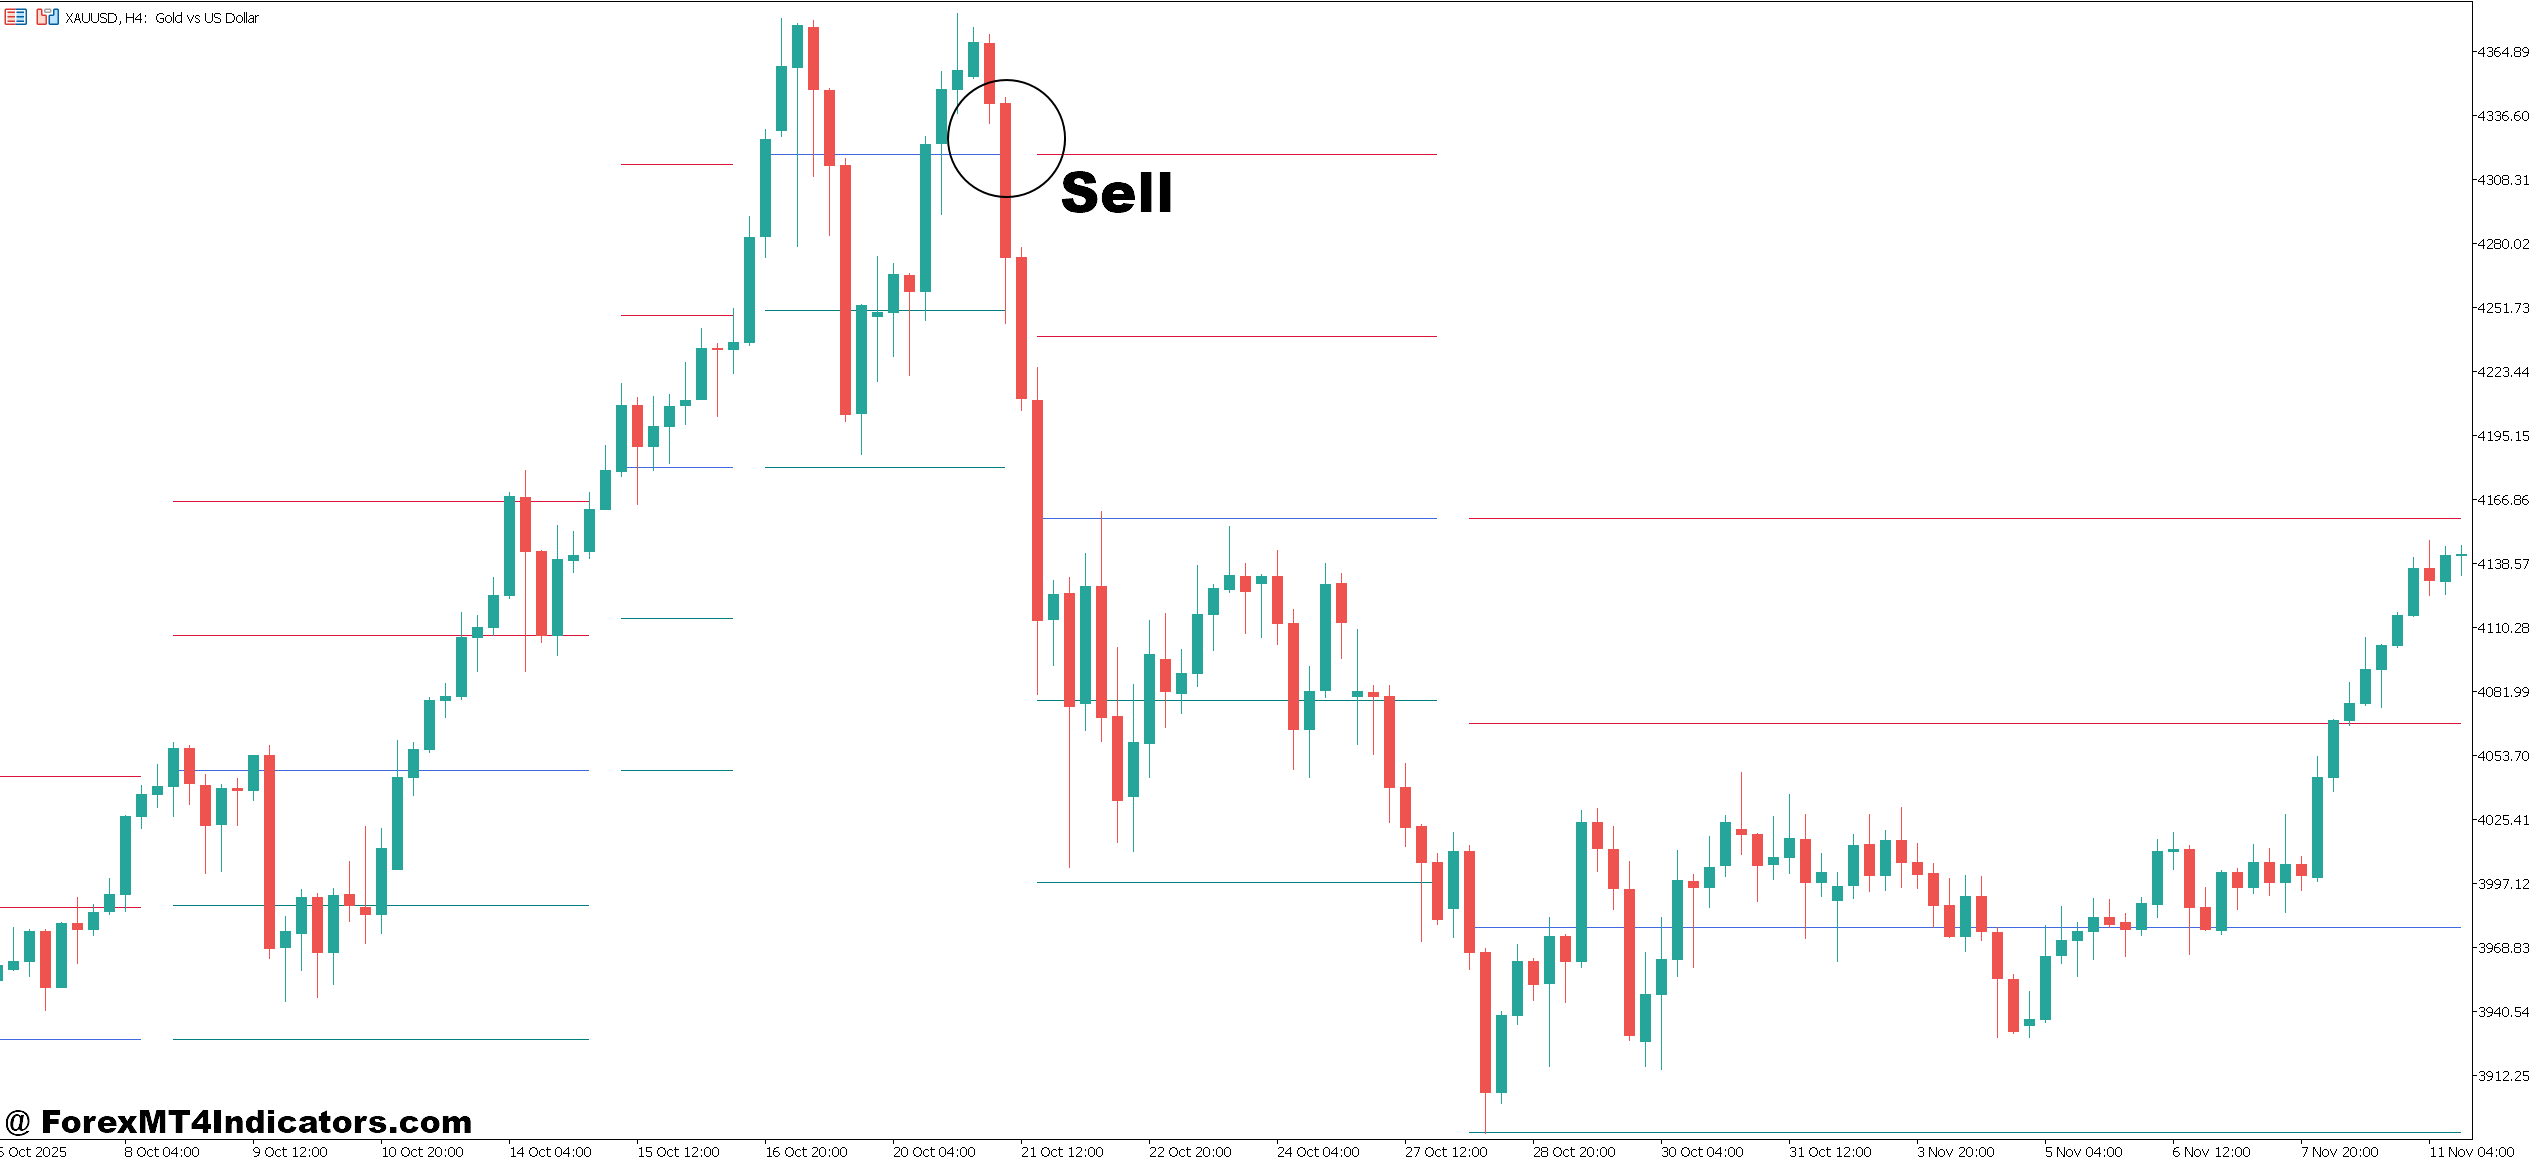
- Sell after bearish Break of Structure (BOS) – When the indicator marks a bearish BOS on EUR/USD 1-hour, wait for price to retrace into a bearish order block. Enter sell with a 15–25 pip stop loss above the block and target 40–70 pips.
- Sell on bearish order block rejection – If GBP/USD on the 4-hour chart returns to a bearish order block and forms a strong bearish candle, traders often enter sell aiming for the next support level.
- Sell after liquidity grab above resistance – When price spikes 10–30 pips above a previous high and the indicator marks a liquidity sweep, it may indicate institutional selling. A bearish entry on M15 or H1 can capture the reversal.
- Sell after bearish Change of Character (CHoCH) – If an uptrend breaks structure and forms a CHoCH on EUR/USD 1-hour, traders may open a short position targeting 30–60 pips depending on volatility.
- Sell inside bearish fair value gap – When price retraces upward into a bearish fair value gap highlighted by the indicator, it often resumes the downtrend. This setup appears frequently on 1-hour and 4-hour charts.
- Confirm with higher timeframe trend – If the daily timeframe shows a bearish structure, and the 1-hour chart prints a bearish BOS, the sell signal becomes stronger.
- Manage risk during news events – Avoid opening sell trades right before major events like NFP or CPI, since price spikes of 50–100 pips can invalidate technical signals.
- Avoid selling in strong bullish momentum – If candles are closing with large bullish bodies and volume is rising, ignore sell signals even if a bearish zone appears. Waiting for confirmation can prevent unnecessary losses.
Conclusion
The Luxalgo SMC Indicator MT5 offers traders a structured way to analyze price action through the lens of institutional activity. Instead of relying solely on lagging indicators, it highlights market structure and liquidity zones that often influence price movement.
Traders using the tool often focus on three core ideas: breaks of structure reveal trend direction, order blocks provide potential entry zones, and liquidity sweeps signal possible reversals. When these elements align with session momentum and proper risk management, they can form high-quality setups.
Still, this indicator works best as part of a broader trading plan. It won’t replace discipline, patience, or risk control.
Trading forex carries substantial risk. No indicator guarantees profits. Traders should always test new tools on demo accounts, analyze different market conditions, and build a strategy that fits their own trading style.
Level up your trading Learn to read the chart — not just the indicator eBook · Instant PDF Video Course · 12 modules Trading forex and CFDs carries a significant risk of loss and is not suitable for everyone. Broker links are affiliate links — we may earn a commission at no cost to you.Recommended MT4/MT5 Brokers
Free MT4 Indicator Download

Enter Your Email Address below, download link will be sent to you.
