


Last updated:
The Bollinger Bands strategy uses the 20-period, 2-standard-deviation bands to trade three setups: the squeeze breakout, the Bollinger bounce (fading the outer band in a range), and the band walk (riding one band in a strong trend). Match the setup to the market, and always confirm the signal with structure or a second tool.
Key takeaways
- Bollinger Bands are three lines. A 20-period simple moving average in the middle, with an upper and lower band set 2 standard deviations away. The default is 20, 2 — that is the setting almost every strategy below assumes.
- The bands measure volatility, not direction. They widen when volatility rises and narrow when it falls. The middle band is the trend reference; the outer bands are dynamic support and resistance that stretch and contract.
- Three playbooks cover most setups. The Bollinger bounce for ranges, the band walk for trends, and the squeeze breakout for the transition between them. The single biggest mistake is running the wrong playbook for the market you are in.
- Never buy the lower band in a strong downtrend. In a trend, price can walk the band for many candles. Fading it because it “looks oversold” is how the strategy loses money — the band is not an overbought/oversold signal on its own.
- Bollinger Bands need a partner. They tell you where price is relative to its recent volatility, but not whether momentum agrees. Pair them with RSI or volume to separate a real breakout from a false one.
- Every entry needs a stop beyond structure and a defined target. Size each trade so a stop-out costs no more than 1% of your account, and aim for at least 1:2 risk-to-reward.
What is the Bollinger Bands strategy?
Bollinger Bands are a volatility indicator built by John Bollinger in the 1980s. The middle line is a 20-period simple moving average; the upper and lower bands sit 2 standard deviations above and below it. When volatility rises the bands widen, and when it falls they contract.
That is all the theory you need to trade the setups below. If you want the full mechanics — how standard deviation shapes the bands, why they expand and contract, and how to read them candle by candle — read our companion explainer on what Bollinger Bands are and how to trade them. This page assumes you already know that and focuses on the strategy: the three specific setups, and how to enter, exit, and manage each one.
The key idea that ties the playbooks together: the bands do not predict direction. They describe where price sits inside its own recent volatility. A touch of the upper band means price is stretched relative to the last 20 candles — nothing more. Whether that is a reason to sell, to buy, or to do nothing depends entirely on which of the three market conditions you are in.
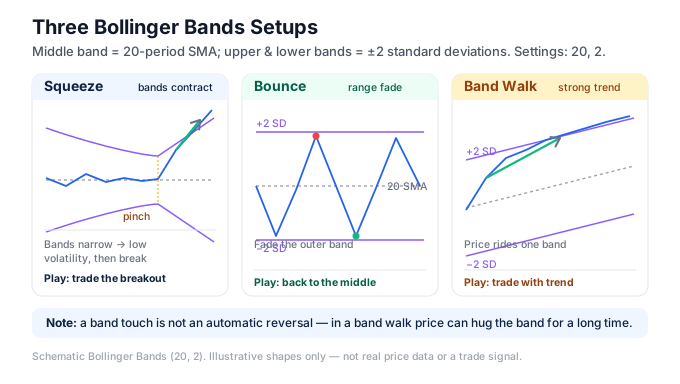
Playbook 1 — The Bollinger bounce (range / mean reversion)
The Bollinger bounce is the mean-reversion setup: in a sideways market, price tends to fade away from an outer band back toward the middle. It is the setup most beginners picture, and it works — but only in a genuine range, never in a trend.
[SCREENSHOT: bollinger-bounce-eurusd-h1.svg]
The logic is straightforward. In a ranging market the 20-period middle band is roughly flat, and price oscillates between the outer bands. A tag of the upper band marks a stretched, overextended price that tends to snap back toward the mean; a tag of the lower band marks the opposite.
The rules that keep a bounce trade clean:
- Confirm the range first. The middle band should be flat or gently sloping, not steeply angled. A steep middle band means a trend — the wrong market for this setup.
- Wait for the reaction, not only the touch. Do not sell the instant price tags the upper band. Wait for a rejection candle — a wick off the band, a bearish engulfing, a close back inside the band. The touch is the alert; the rejection is the trigger.
- Enter on the close back inside the band, in the direction of the middle band (sell the upper-band rejection, buy the lower-band rejection).
- Target the middle band first. The 20-period SMA is the natural first target — that is where mean reversion is heading. In a wide, clean range you can hold for the opposite band, but bank part of the position at the middle.
- Stop a few pips beyond the band tag. Place the stop a few pips outside the extreme of the candle that tagged the band. If price closes firmly outside the band and keeps going, the range is breaking and the bounce is invalidated — that is exactly what the stop is protecting against.
The bounce fails the moment the market stops ranging. If the middle band turns and starts sloping hard, stop trading bounces and switch to the band walk below.
Playbook 2 — The band walk (riding a trend)
The band walk is the trend setup, and it is the direct opposite of the bounce. In a strong trend, price does not reverse off the outer band — it rides it. Candle after candle closes near or on the upper band in an uptrend, or the lower band in a downtrend. This is the “walking the bands” behaviour, and it is where most bounce traders get run over.
[SCREENSHOT: bollinger-band-walk-xauusd-h1.svg]
The insight that makes the band walk tradable: a touch of the outer band in a trend is a sign of strength, not exhaustion. Price hugging the upper band means buyers are in firm control. Fading that touch is fighting the trend.
The rules:
- Confirm the trend. The middle band should be clearly sloping, and price should be holding on the trend side of it — above the middle band in an uptrend, below it in a downtrend.
- Trade with the walk, not against it. In an uptrend, look to buy pullbacks toward the middle band, not to sell the upper-band touch. In a downtrend, sell pullbacks to the middle band.
- Use the middle band as your entry zone. During a band walk, shallow pullbacks to the 20-period SMA are the lower-risk entries. Price tags the middle band, finds support, and resumes the walk.
- Stop on the far side of the middle band. If price closes decisively through the middle band and holds there, the walk is over — that is your exit and your stop level.
- Exit when the walk ends. A close back inside the bands after a run, a flattening middle band, or price crossing the middle band all signal the trend is losing steam. Take profit into that, rather than waiting for a full reversal.
The band walk and the bounce use the same indicator to do opposite things. Reading the middle band’s slope — flat versus sloping — is what tells you which one you are looking at. Confirming the trend with how to spot trends in forex market price movements keeps you from running a bounce into a freight-train trend.
Playbook 3 — The squeeze breakout (low volatility to breakout)
The squeeze is the transition setup, and it is the one the SERP most under-serves. When the bands contract to an unusually narrow width, volatility has dried up and the market is coiling. That compression rarely lasts — it typically resolves into a sharp expansion, and the squeeze breakout aims to catch that move as it fires.
[SCREENSHOT: bollinger-squeeze-breakout-eurusd-h1.svg]
A squeeze is the bands pinching close together. Low volatility means the standard deviation is small, so the upper and lower bands sit near the middle band. Traders often watch a companion tool, the Bollinger Band Width indicator, which plots band width as a single line — when it drops to a multi-week low, the squeeze is on.
The rules:
- Identify the squeeze, then wait. A squeeze tells you a move is coming; it does not tell you the direction. Do not guess which way it breaks — let price show you.
- Enter on the breakout candle. When a strong candle closes decisively outside the bands and the bands begin to widen, take the trade in the breakout direction. The band expansion is the confirmation — a breakout on still-narrow bands is more likely to fail.
- Confirm with momentum or volume. A genuine breakout should come with a momentum surge. This is where a second tool earns its place — RSI pushing out of the mid-range, or a volume spike, separates the real break from the fake-out (see the pairing section below).
- Stop on the opposite side of the squeeze range. Place the stop a few pips beyond the far side of the tight range that formed during the squeeze. If price whips back through the range, the breakout has failed.
- Target a multiple of the squeeze range. A common approach is to project the height of the pre-breakout range as the first target. Because a squeeze releases stored volatility, the expansion move is often several times the width of the coil.
The most common squeeze failure is the fake-out: price pokes outside the band, triggers breakout traders, then snaps back into the range. Waiting for the candle to close outside the bands and for the bands to widen filters most of these.
Best Bollinger Band settings for forex
The default Bollinger Band setting is 20 periods with 2 standard deviations — John Bollinger’s original values, and the right starting point for every setup above. There is little reason to change the core setting; almost all published Bollinger strategies assume 20, 2.
| Use case | Period | Std Dev | Why |
|---|---|---|---|
| H1 / H4 forex (default) | 20 | 2.0 | Bollinger’s original; ~95% of price action sits inside the bands |
| M5 scalping | 20 | 2.0 | Keep the default; drop timeframe, not the setting |
| Tighter mean reversion | 20 | 2.5 | Wider bands = fewer, higher-quality band tags |
| XAU/USD (gold) | 20 | 2.0–2.5 | Gold’s volatility tags the 2.0 bands constantly; 2.5 filters noise |
Two rules of thumb behind the table. The period sets how much history the middle band reflects — 20 is the standard because it captures roughly a month of daily bars or a session of intraday bars; shortening it makes the bands twitchy. The standard-deviation multiplier sets how often price touches the bands — at 2.0 standard deviations, about 95% of price action stays inside the bands statistically (the normal-distribution property; real markets have fatter tails, so band tags happen a little more often than the maths implies), so touches are meaningful; widen to 2.5 and you get fewer but cleaner signals.
On XAU/USD specifically, gold’s volatility tags the default 2.0 bands far more often than EUR/USD does, which produces more false bounce signals. Many gold traders keep the 20-period middle band but widen the deviation to 2.5, and always give gold trades wider stops — its wicks routinely spike beyond a band and reverse, sweeping a stop placed as tight as you would on a forex pair.
What combines well with Bollinger Bands
Bollinger Bands tell you where price sits inside its recent volatility, but not whether momentum agrees. That gap is why the bands work best with a partner from a different indicator family — a momentum oscillator or a volume tool, not a second volatility indicator that repeats the same information.
Bollinger Bands + RSI is the classic pairing, and it directly fixes the two biggest weaknesses of each setup:
- For the bounce: only take an upper-band rejection when RSI is also stretched high, and a lower-band bounce when RSI is stretched low. The band says price is extended; RSI confirms momentum is extended too. If price tags the upper band but RSI sits mid-range, skip the trade — that is often a band walk, not a bounce.
- For the squeeze breakout: a real breakout should push RSI firmly out of the 40–60 mid-zone in the breakout direction. If the bands expand but RSI stays flat and central, the move lacks conviction and is a fake-out candidate.
RSI is the momentum half of this system. If you want the full rule set for the oscillator — settings, divergence, and the 50-line trend filter — our forex RSI strategy guide covers it, and it slots directly onto the band setups above.
Bollinger Bands + volume is the alternative confirmation, especially for breakouts. A squeeze that breaks on a clear volume surge is far more likely to hold than one that breaks on thin flow. Forex has no centralised volume, so most traders use tick volume as a proxy — imperfect, but a spike still flags genuine participation behind the move.
If you are assembling a broader toolkit, our roundup of the top 10 MT4 indicators shows which momentum, trend, and volume tools combine cleanly with the bands — and which only echo what the bands already tell you. And if you are new to reading indicators together, start with using indicators for forex trading analysis for the confluence basics.
Common Bollinger Bands mistakes to avoid
- Buying the lower band in a strong downtrend. In a trend, price walks the band — the “oversold” tag keeps extending against you. Fix: check the middle band’s slope first. Steep slope = trend = trade the band walk, not the bounce.
- Treating a band touch as a buy or sell signal. A touch means price is stretched, not that it will reverse. Fix: wait for a rejection candle (bounce) or a decisive close outside with widening bands (breakout) before entering.
- Running the wrong playbook for the market. Trading bounces in a trend, or fading a squeeze breakout, are the same error in different clothes. Fix: read the middle band and band width first, then pick the playbook.
- Chasing the squeeze fake-out. Price pokes outside the band, breakout traders pile in, price snaps back. Fix: require a close outside the bands plus band expansion, and confirm with RSI or volume.
- Changing the settings to force signals. Optimising to 18, 2.1 or 22, 1.9 is curve-fitting to noise. Fix: keep 20, 2.0 (or 2.5 on gold) and put your energy into reading the market condition instead.
- No stop, or a stop too tight. “The band will hold.” Gold wicks and news candles disagree. Fix: stop beyond the structure that invalidates the setup, position sized to 1% risk.
Frequently asked questions
What is the best Bollinger Bands strategy for forex?
There is no single best strategy — there are three, and the best one depends on the market. Use the Bollinger bounce in a range (fade the outer band back to the middle), the band walk in a trend (ride the band, buy pullbacks to the middle), and the squeeze breakout in low volatility (trade the expansion when the bands widen). Read the middle band’s slope to know which one you are in.
What are the best Bollinger Band settings?
The default 20-period, 2-standard-deviation setting is the best starting point and what almost every Bollinger strategy assumes. The 20-period middle band captures enough history to be stable, and at 2 standard deviations roughly 95% of price action stays inside the bands, so a touch is meaningful. On volatile instruments like gold, widening the deviation to 2.5 filters false signals. Avoid tweaking the period — it usually curve-fits to noise.
How do you trade a Bollinger Band squeeze?
Wait for the bands to contract to an unusually narrow width — that is the squeeze, signalling a coming volatility expansion. Do not guess direction. Enter when a candle closes decisively outside the bands and the bands begin to widen, in the breakout direction. Confirm with a momentum push (RSI leaving the mid-range) or a volume spike, place the stop on the opposite side of the squeeze range, and target a multiple of that range.
What is the Bollinger bounce?
The Bollinger bounce is a mean-reversion setup for ranging markets: price tends to fade away from an outer band back toward the 20-period middle band. You sell a rejection off the upper band and buy a rejection off the lower band, targeting the middle band. It only works when the middle band is flat — in a trend, price walks the band instead of bouncing, and the setup fails.
Do Bollinger Bands work in trending markets?
Yes, but you trade them differently: in a trend you do not fade the outer band — you ride it. Price “walks” the upper band in an uptrend or the lower band in a downtrend, so you buy pullbacks to the middle band and stay with the trend. The mistake is applying the mean-reversion bounce in a trend; that fights the move and loses. Read the middle band’s slope to tell trend from range.
Should you buy when price touches the lower Bollinger Band?
Only in a range, and only after a rejection. A lower-band touch in a flat-middle-band range is a bounce opportunity — but wait for a rejection candle and confirm with RSI before buying. In a downtrend, a lower-band touch is a sign of strength on the sell side, not a buy signal; buying it means fighting the trend while price walks the band lower. Always check the middle band’s slope first.
What is the best timeframe for Bollinger Bands?
H1 and H4 are the most reliable for the setups here, because the band signals are cleaner and the spread cost is small relative to the move. Bollinger Bands work on all timeframes, but on M5 and below the bands tag constantly and fire more false bounces, while the spread erodes the edge on breakouts. Keep the default 20, 2 setting and change the timeframe, not the setting.
What indicator combines best with Bollinger Bands?
RSI is the most useful partner: the bands show where price sits in its recent volatility, and RSI confirms whether momentum agrees. Only take a bounce when RSI is also stretched, and only trust a squeeze breakout when RSI pushes firmly out of the mid-range. Volume (tick volume in forex) is the other strong confirmation, especially for breakouts. Avoid pairing the bands with a second volatility indicator — it repeats the same information.
The Bollinger Bands strategy is not one setup but three — the bounce for ranges, the band walk for trends, and the squeeze breakout for the transition between them — all built on the same 20-period, 2-standard-deviation bands. The skill is not the indicator; it is reading the middle band’s slope and the band width to know which playbook fits, then confirming the signal with RSI or volume and protecting every trade with a stop beyond structure. Start on H1 with the default 20, 2, respect the difference between a trend and a range, and treat the bands as a map of volatility, not a buy-and-sell signal on their own.
Forex and CFD trading carries a high level of risk and may not be suitable for all traders. The strategies and indicators described in this article are educational. Past performance does not guarantee future results. Always test on a demo account before risking real capital.
Ready to put this into practice?
Open an account with a regulated broker and apply what you have learned. These are the three brokers we recommend:
Trading forex and CFDs carries a significant risk of loss and is not suitable for everyone. Broker links are affiliate links — we may earn a commission at no cost to you.
excellent sharing & good strategy 🙂
I like it and all the sharing in this site
Thanks! I’m glad that you like it. I will do my best to share more forex trading tips and strategies.
Heel overzichtelijk!
Top site voor beginner en gevorderde forex handelaar
dank je! deel deze forex strategie website met je vrienden 🙂
Awesome strategy.
Hi
I enjoyed it very much.
thank you .
I’m Mehdi from Iran