

Last updated:
To start forex trading, learn how currency pairs, pips and lots work, open an account with a regulated broker, practise on a demo for four to eight weeks, then trade a small live account using a written plan that risks no more than 1% of your balance per trade. Most beginners lose money at first, so size small.
Forex is the largest financial market in the world — around $9.6 trillion changes hands every day (BIS Triennial Central Bank Survey, April 2025). It is open 24 hours a day, five days a week, and you can open an account with a few hundred dollars. That accessibility is exactly why so many beginners lose money quickly: the barrier to entry is low, and the barrier to competence is not.
This guide is the whole path in one page. Seven numbered steps, in order, plus three sections that sit alongside them — what actually moves currency prices, how to place and manage the order itself, and what to do after the trade closes. The arithmetic is written out rather than asserted. By the end you will be able to read a quote, work out what one pip is worth on your position, calculate the correct lot size for your account and stop-loss, place the order with a stop and target attached, and know what to do when the trade goes against you.
Be clear-eyed before you start. The majority of retail traders lose money — CFD brokers regulated in the UK and EU are required to publish the percentage of their own retail clients who do, and you should read that number on your broker’s site before you deposit. Nothing here is a promise of profit, and nothing here is personal financial advice. Treat your first six months as tuition, keep your position sizes small enough that a bad month is survivable, and never trade money you need for rent, bills or savings.
Last updated: 20 July 2026. Written by Tim Morris.
Key takeaways
- Forex trading means buying one currency while simultaneously selling another. Around $9.6 trillion trades daily (BIS Triennial Survey, April 2025), 24 hours a day, five days a week.
- A pip is the fourth decimal place (0.0001) on most pairs and the second decimal (0.01) on JPY pairs. One standard lot is 100,000 units of the base currency; a mini lot is 10,000; a micro lot is 1,000.
- On USD-quoted pairs, one pip is worth about $10 on a standard lot, $1 on a mini lot and $0.10 on a micro lot. Gold is different: 1 XAU/USD pip = $0.01 = $1 per 100-ounce standard lot.
- Risk no more than 1% of your account on any single trade. Position size (lots) = (Account x Risk %) / (Stop in pips x Pip value per lot).
- Leverage is a ceiling; effective leverage is your actual risk. Retail leverage is capped near 30:1 on majors under UK, EU and Australian rules and around 50:1 in the US — verify the cap that applies to you.
- Your total cost per trade is spread + commission + swap + slippage, not just the advertised spread. A ‘commission-free’ 1.4-pip account can cost more than a 0.2-pip raw account paying $7 per lot round turn.
- Demo trade for at least four to eight weeks with the demo balance set to the amount you will actually deposit, and go live only after 50+ trades taken to a written plan.
- Drawdown recovery is asymmetric: a 50% loss requires a 100% gain to get back to breakeven. This is why the 1% rule exists.
- Most retail beginners lose money. UK- and EU-regulated CFD brokers must publish their own client loss rates — read yours before depositing if it is available.
Step 1: Learn what you are actually buying and selling
Before you place a single order you need the vocabulary. Forex trading has its own units and arithmetic, and most expensive beginner mistakes trace back to misreading a number on the screen.
A trade is always two currencies at once
You never simply buy “forex”. You buy one currency and sell another in the same instant. That is why prices are quoted in currency pairs such as EUR/USD, GBP/JPY or USD/CAD.
The first currency is the base. The second is the quote currency. The price tells you how many units of the quote currency one unit of the base is worth.
So EUR/USD at 1.0850 means one euro buys 1.0850 US dollars. At 1.0900 the euro has strengthened against the dollar; at 1.0800 the dollar has strengthened. A currency never rises on its own — only against something else.
Bid, ask and the spread
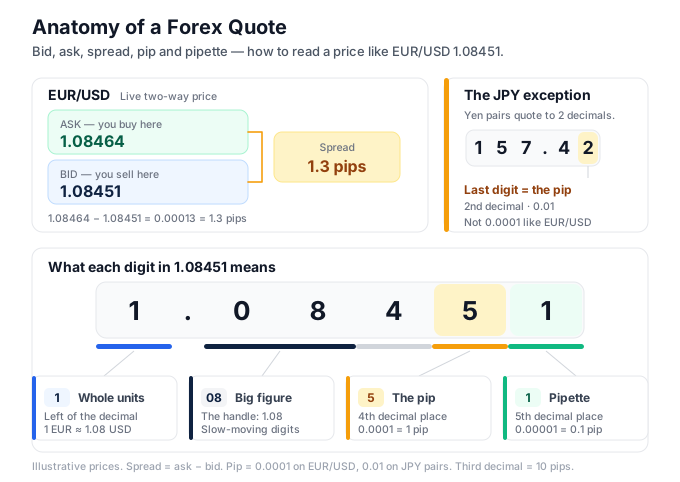
Your platform shows two prices, not one. The bid is what the market will pay you if you sell. The ask is what you must pay if you buy.
The ask is always the higher of the two, and the gap between them is the spread. Buy at the ask and your position immediately shows a small loss equal to the spread, because you could only close it back at the bid. That is normal, not a glitch.
Pips and pipettes
A pip is the standard unit of price movement. On most pairs it is the fourth decimal place — 0.0001. On yen pairs it is the second decimal place — 0.01.
Most platforms quote one digit beyond the pip. In a EUR/USD price of 1.08453, the 5 in the fourth place is the pip and the final 3 is a pipette, one tenth of a pip. USD/JPY at 157.428 works the same way: the 2 is the pip, the 8 is the pipette. Read the wrong digit and you will mistake a 3-pip move for a 30-pip move — so get what a pip actually is straight first.
The lot ladder
Trade size is measured in lots — a fixed number of units of the base currency.
| Lot | Platform size | Units of base currency | One pip is worth |
|---|---|---|---|
| Standard | 1.00 | 100,000 | about $10 |
| Mini | 0.10 | 10,000 | about $1 |
| Micro | 0.01 | 1,000 | about $0.10 |
Read that last column carefully, because it is scoped. On USD-quoted pairs — where the US dollar is the second currency, such as EUR/USD, GBP/USD and AUD/USD — one pip is worth about $10 on a standard lot, $1 on a mini and $0.10 on a micro.
Do not generalise those figures. On USD-base pairs such as USD/CAD, USD/CHF and USD/JPY, the pip value on a standard lot is roughly $10 divided by the current rate: with USD/CAD at 1.3600, one pip is about $10 ÷ 1.3600 = $7.35. On crosses with no dollar in them at all, such as EUR/GBP, the pip value depends on a third rate, and it drifts as that rate moves. Your platform shows the live figure, and the pip value calculator works it out for any pair and size.
One complete worked trade
You buy 0.10 lots of EUR/USD at 1.0850 — a mini lot, 10,000 euros bought with dollars.
The price rises to 1.0870. That is 1.0870 − 1.0850 = 0.0020, and since one pip is 0.0001, the move is 20 pips. At $1 per pip on a mini lot: 20 × $1 = $20 profit.
The arithmetic is symmetrical, which is the part beginners skip. Had price fallen to 1.0830 instead — also 20 pips — the same position would be $20 down. Same size, same distance, opposite sign.
Going long and going short
Buying is called going long; selling is going short. Beginners stall on how you can sell a currency you do not own. The answer is that you already own the other side: every forex position is a purchase of one currency funded by a sale of the other. Selling EUR/USD is simply buying dollars with euros instead of the reverse. Nothing is borrowed, which is why shorting is as routine here as buying.
You are almost certainly trading a CFD
Unless you deal on an institutional platform you are not exchanging actual currency. You are trading a contract for difference — an agreement with your broker to settle the price difference in cash — or a similar derivative such as a rolling spot contract.
The price behaviour is identical, but the wrapper matters: it determines which regulator covers you, what happens to your money if the broker fails, and how the profit or loss appears in your records at tax time. Understand what a CFD is before you deposit, and note that CFDs are banned for retail clients in some jurisdictions, including the United States.
The market itself runs continuously from Sunday evening to Friday evening and closes over the weekend. It is 24/5, not 24/7 — which matters more than it sounds, and Step 5 deals with the consequences.
With the vocabulary in place, the next decision is who you trade through.
Step 2: Choose a regulated broker and count the real cost
Your broker is your counterparty, your price feed and the custodian of your deposit. Choose badly and nothing else in this guide matters. Work through five filters in this order, and stop at the first failure — a broker that fails filter one is not rescued by a good platform.
- Regulator. Is it licensed in a jurisdiction with real enforcement?
- Execution model. How does it make money from your order flow?
- Total cost. Spread plus commission plus swap plus slippage, in dollars.
- Funding friction. How easily does money get in — and back out?
- Platform. Does it support the software you intend to use?
Filters 1 to 3 are covered below. You test filter 4 in Step 3, because the fastest way to check it is to move a small amount of real money in and pull it straight back out. Filter 5 comes in Step 4, because which platform you need depends on what you intend to run on it.
Regulators and what a licence actually buys you
The tier-one regulators are the FCA (UK), ASIC (Australia), CySEC (Cyprus/EU), which passports across the EU, and CFTC/NFA (United States). Regulation is not a profit guarantee. It buys you up to four specific protections, and which ones you actually get depends on the regulator.
Client money is normally held in segregated accounts separate from the firm’s own funds — but US retail forex is the exception, where you rank as an ordinary unsecured creditor if the broker fails. Negative balance protection is mandated in the UK, Cyprus and Australia, so you cannot owe more than you deposited; the US does not require it. A compensation scheme exists in some regimes and not others: the UK’s FSCS covers eligible claims up to £85,000 and Cyprus’s Investor Compensation Fund up to €20,000, while Australia and the US have no equivalent cover for retail forex or CFD losses on broker failure. A dispute-resolution process that does not depend on the broker’s goodwill is the one protection all four regimes give you.
Check which of these applies to the entity your account contract is actually with. Large brokers run several entities under different licences, and the one you are signed to decides what you get.
Verify the licence yourself. Take the licence number from the broker’s website footer, then look it up on the regulator’s own public register — the FCA Register, ASIC Connect, the CySEC list, NFA BASIC. Never accept a screenshot or a certificate hosted on the broker’s own site. Check that the registered entity name matches the entity your account contract is actually with, because many groups operate an offshore subsidiary alongside the regulated one. It is common to be onboarded by a familiar brand and then find the contract sits with a differently named entity in another jurisdiction, with none of the protections above.
Retail leverage caps are a regulatory fact worth using as a selection filter. Roughly 30:1 on major pairs under UK and EU rules, around 50:1 in the US (which also imposes FIFO order closing and bans hedging), the same 30:1 cap on majors in Australia under ASIC’s product intervention order, and effectively unrestricted offshore. A broker advertising 1:1000 to a UK resident is telling you which entity you would really be signing with. Verify the cap in your jurisdiction before you assume a number — how leverage actually works is Step 3.
Execution models and the conflict of interest
A dealing desk / market maker takes the other side of your trade internally. Fixed spreads, guaranteed fills on small size — but when you lose, the firm’s book gains, which is a structural conflict. An STP or ECN broker routes your order to liquidity providers and earns from commission or a small mark-up, so it wants your volume rather than your loss. Neither model is automatically honest; the difference is where the incentive points. A fuller breakdown of the plumbing sits in our guide to how forex brokers work.
The cost stack: one trade, one number
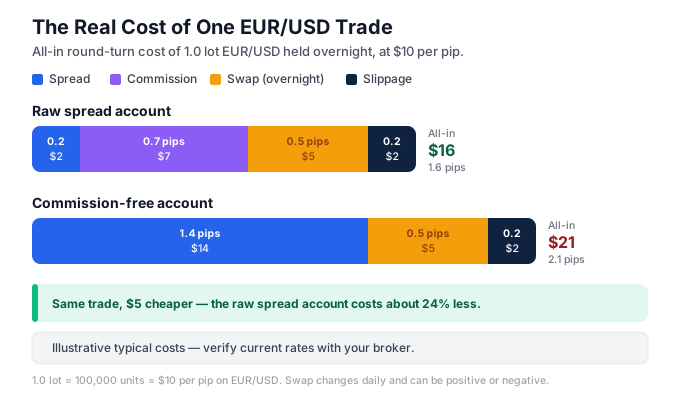
Every trade costs you four things: the spread, commission, slippage, and swap if you hold overnight — swap is covered later, in the section on placing and holding a position. Marketing shows you one of them. Add them all.
Take 1.0 standard lot of EUR/USD, where one pip is worth $10.
| Cost item | Raw-spread account | “Commission-free” account |
|---|---|---|
| Spread | 0.2 pips = $2 | 1.4 pips = $14 |
| Commission (round turn) | $7 = 0.7 pips | $0 |
| Spread + commission, round turn | 0.9 pips = $9 | 1.4 pips = $14 |
That row is the entry-and-exit cost only. Swap and slippage sit on top of it, so treat it as the floor of what a trade costs you rather than the whole bill.
On that basis, the account advertised as commission-free is $5 per lot more expensive, because the commission was buried in the spread.
How much that $5 matters depends entirely on how often you trade. A swing trader taking eight one-lot trades a month pays 8 × $5 = $40 a month, or $480 a year, more on the worse account — annoying, not decisive. A scalper taking four one-lot trades a day, twenty days a month, trades 80 lots a month and pays 80 × $5 = $400 a month, or $4,800 a year, purely in the cost difference. The more often you trade, the more your broker choice is really a cost choice.
Then add slippage and requotes — the cost of speed. Slippage is the gap between the price you clicked and the price you got; a requote is the broker asking you to accept a new price instead. Beginners meet both in the same three places: high-impact news releases, the Sunday-night open, and thin holiday sessions where a gap can jump straight past your stop. Note that slippage runs both ways — a fast market can also fill you better than you asked — but it is asymmetric in practice, because the moments it is worst are the moments you most want out.
Fraud screening
Walk away from: an unregistered offshore entity with no verifiable licence; anyone offering to be your “account manager” and trade for you; any guaranteed return; deposit bonuses whose terms lock your own money until you trade a volume target; and — the loudest signal of all — a withdrawal request that is delayed, questioned or “pending compliance” for weeks. Test withdrawals early with a small amount.
Two softer signals are worth adding to the list. A broker whose website will not tell you which legal entity you are contracting with, and one whose terms are only available after you have deposited, are both hiding the thing you most need to read. Neither is proof of fraud on its own, but both change what a failure would cost you.
Finally, look for the broker’s retail loss-rate disclosure — a line on the homepage stating what percentage of its retail clients lose money. UK- and EU-regulated CFD brokers must publish it. Brokers under other regulators, such as ASIC in Australia, are not required to, so its absence tells you nothing either way — judge those brokers on their licence and regulator instead. Our checklist on how to choose a forex broker turns all of this into a scoring sheet.
Once you have chosen, the money has to get in — and the arithmetic that governs it has to be understood before you use any of it.
Step 3: Fund the account, then understand leverage and margin before you use them
Funding is the easy part. The arithmetic that follows it is what decides how much of that money you can lose in an afternoon.
Getting money in
Deposit methods differ in speed and in how easily the money can come back out.
| Method | Typical speed in | Reversibility | Notes |
|---|---|---|---|
| Bank transfer | 1-3 business days | Low | Slowest in, usually the most reliable out |
| Debit/credit card | Minutes to hours | High (chargeback possible) | Withdrawals are refunded to the same card, often capped at the deposit amount |
| E-wallet (Skrill, Neteller, etc.) | Minutes | Medium | Fastest round trip; not offered in every country |
Before or shortly after your first deposit you will be asked to complete KYC (“know your customer”) verification: photo ID plus a proof of address such as a utility bill or bank statement dated within the last three months. It exists because brokers are legally required to prevent money laundering. In practice it rarely blocks your first deposit — it blocks your first withdrawal, so upload the documents on day one rather than the day you want your money. The full account-opening sequence is covered in how to fund a forex account.
Getting money out — and testing filter 4
Nearly every regulated broker returns funds to the original source, in the amount you deposited, before paying any profit elsewhere. Deposit $500 by card, and the first $500 out goes back to that card. Profit above that is usually paid by bank transfer, which is why the bank details on your account must match the name on the account — third-party payments are refused almost everywhere.
Test this early. Deposit, trade a little, then withdraw a small amount from your broker before you commit real capital. A broker that pays $50 within its stated timeframe without excuses is behaving like a real business. Delays, surprise “verification” steps and bonus clauses that lock your balance are the clearest early warning you will get — and that round trip is the funding-friction filter from Step 2, tested with real money rather than marketing copy.
Leverage is arithmetic, not a feature
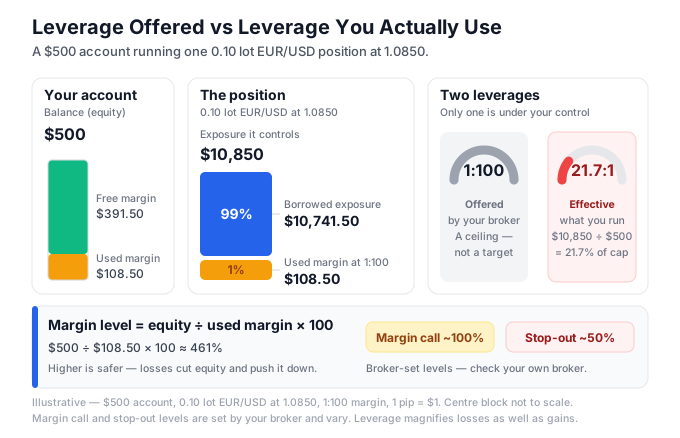
Leverage lets you control a position larger than your balance. The margin is the slice of your own money the broker freezes to hold it:
Margin required = position value / leverage
Work it through. 0.10 lots of EUR/USD is 10,000 units. At a price of 1.0850 that is 10,000 x 1.0850 = $10,850 of exposure. At 1:100 leverage the margin required is 10,850 / 100 = $108.50. The other $10,741.50 is borrowed exposure. Your profit and loss is calculated on the full $10,850, not on the $108.50.
Three terms follow from that:
- Used margin — locked by open positions ($108.50 above).
- Free margin — equity minus used margin; what is left to open new trades and absorb losses.
- Margin level = equity / used margin x 100. With $500 equity and $108.50 used, that is 500 / 108.50 x 100 = 461%.
As losses mount, equity falls and margin level falls with it. At a broker-set threshold (commonly around 100%) you get a margin call — a warning, no new trades. At a lower threshold (commonly around 50%) the platform hits stop out and closes your positions automatically, largest loser first, whether you are at the screen or asleep. Check your own broker’s two numbers; they vary.
Put figures on it. With $500 equity and that single 0.10-lot position, margin level reaches 100% when equity falls to $108.50 — a loss of $391.50, which at $1 per pip is 391.5 pips against you. Stop out at 50% comes when equity hits $54.25, a loss of $445.75, or roughly 446 pips. Those distances sound comfortable, and that is the trap: a trader running five such positions at once reaches the same thresholds five times faster.
Effective leverage is the number that matters
Here is the part most beginners miss. That $500 account holding $10,850 of exposure is running 10,850 / 500 = 21.7:1 effective leverage — and that figure is identical whether the broker offered you 1:30 or 1:500.
Account leverage is only a ceiling. Effective leverage is the risk you are actually carrying, and you set it yourself with your lot size. Choosing a lower account leverage does not make you safer; it only makes the broker stop you out sooner. Choosing a smaller lot does.
How much capital you actually need
Derive it rather than guess it. Risking 1% of a $500 account is $5 per trade. A 50-pip stop on 0.01 lots of EUR/USD, where one pip is worth $0.10, loses exactly 50 x $0.10 = $5. So $500 is the realistic floor at which one micro lot with a normal stop still fits inside 1% risk.
$500-$1,000 is the sensible starting range. You can start with $100, but 1% of $100 is $1 — a 50-pip stop would need a pip value of $0.02, below the 0.01-lot minimum, so you are forced to over-risk.
Fund it only with money you can lose entirely. Never rent, bills, borrowed money or emergency savings.
Money in, arithmetic understood. Now install the software you will spend your hours in.
Step 4: Set up MT4 or MT5 and practise on a demo account
MetaTrader is where you will actually spend your time. Almost every retail forex broker offers MetaTrader 4, MetaTrader 5, or both, and the two are separate programs rather than versions of the same one. This is filter 5 from Step 2, and it is the last one because the answer depends on what you intend to run.
MT4 or MT5 — which to install
| MT4 | MT5 | |
|---|---|---|
| Released | 2005 | 2010 |
| Focus | Forex and CFDs | Multi-asset (forex, stocks, futures) |
| Chart timeframes | 9 | 21 |
| Programming language | MQL4 | MQL5 |
| Third-party tools | Largest ecosystem | Smaller, growing |
MT4 is the long-standing forex standard and has the biggest library of free indicators and expert advisors written for it. MT5 is newer, handles more asset classes, and gives you 21 timeframes instead of 9.
The one thing to understand is that code does not cross over. An indicator written in MQL4 will not run on MT5, and an MQL5 expert advisor will not run on MT4. Pick the platform your broker supports best and match every tool you download to it.
Installing and logging in
Download the installer from your own broker’s website, not from a third-party download site — repackaged MetaTrader installers are a known malware route. Install it, then log in with the three things your broker emails you: the server name, the login number, and the password.
Once open, you will see four areas. Market Watch (Ctrl+M) lists the instruments and their live bid and ask. Navigator (Ctrl+N) holds your accounts, indicators, expert advisors and scripts. The chart windows sit in the middle. The Terminal in MT4 or Toolbox in MT5 (Ctrl+T) runs along the bottom with Trade, History and Journal tabs — Trade shows open positions, History shows closed ones, and Journal logs what the platform did and any errors.
Two habits worth forming on day one. First, right-click Market Watch and hide every symbol you are not trading, so you cannot fat-finger the wrong instrument. Second, save your chart layout as a template (right-click the chart → Template → Save Template) so a crash or a reinstall does not cost you an hour of setup.
To add a custom tool, go to File → Open Data Folder, drop the .mq4 or .ex4 file into MQL4/Indicators (or MQL5/Indicators), and restart the platform. Expert advisors go in the Experts folder and need the AutoTrading button switched on to run. Treat an EA as a piece of software you are installing here — whether automation suits you at all is a separate question covered in our comparison of automated trading versus manual trading. Our free indicator downloads are filed by platform — see the MT5 indicators library — so you get the right file type for the platform you installed.
Set the demo balance to what you will really deposit
Open the demo through your broker’s platform. When it asks for a starting balance, enter the amount you actually intend to fund — $500 if that is your plan — not the $50,000 default.
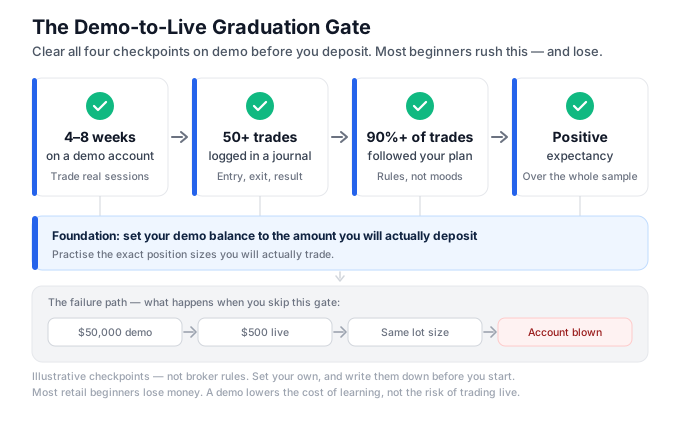
This matters more than anything else in this step. A $50,000 demo is 100 times a $500 live account, so a trader who is comfortable at a given lot size on demo is risking 100 times as much of their real balance at that same size. That is the classic route to a blown first account.
Ask for the same account type you intend to open too. Practising on a raw-spread demo and then funding a wider-spread standard account changes the cost of every trade you have been modelling, and a strategy that clears 0.9 pips of cost may not clear 1.4.
Demo also cannot teach you everything. Fills are idealised, slippage and requotes are absent or only simulated, and nothing is at stake emotionally — see demo versus live accounts for the full gap.
Graduation gates
Move to live only when all four are true:
- Four to eight weeks on demo, minimum.
- 50+ trades logged.
- Your written plan followed on 90%+ of them.
- Positive expectancy across that sample.
Then go live deliberately small. The first live trades exist to test your behaviour, not your strategy.
With a platform open, the next question is what to put on the chart.
Step 5: Decide what to trade and when to trade it
There are thousands of tradeable symbols on a typical broker platform. You need one. Choosing it, and choosing the hours you will sit in front of it, is the decision that everything in your trading plan hangs off.
Majors, crosses and exotics
Seven pairs are called the majors: EUR/USD, USD/JPY, GBP/USD, USD/CHF, AUD/USD, USD/CAD and NZD/USD. Every one contains the US dollar, and between them they account for the bulk of daily turnover.
Crosses are pairs without the dollar — EUR/GBP, EUR/JPY, GBP/JPY, AUD/NZD. They are still liquid, but spreads are wider and moves can be choppier because price is effectively derived from two dollar pairs.
Exotics pair a major currency with a smaller economy: USD/TRY, USD/ZAR, USD/MXN. Spreads are far wider than EUR/USD, liquidity can vanish without warning, and swap charges are often punishing. Beginners should not touch them.
| Pair | Typical spread | Character |
|---|---|---|
| EUR/USD | 0.1–1.5 pips | Tightest spread, orderly, best beginner default |
| USD/JPY | 0.2–1.5 pips | Trends well, sensitive to bond yields |
| GBP/USD | 0.5–2.5 pips | Faster, larger daily range than EUR/USD |
| AUD/USD | 0.5–2 pips | Commodity-linked, quieter in the European morning |
| USD/CAD | 0.8–3 pips | Tied to oil, thin outside US hours |
| GBP/JPY | 2–6 pips | Very volatile — not a beginner pair |
Illustrative typical values only. Spreads vary by broker, account type and hour, and widen sharply around news and at the daily rollover.
Trade one liquid major — most often EUR/USD — until your process is repeatable. One pair means you learn its rhythm, its usual daily range and how it behaves at each session open, instead of collecting shallow impressions of nine.
The four sessions
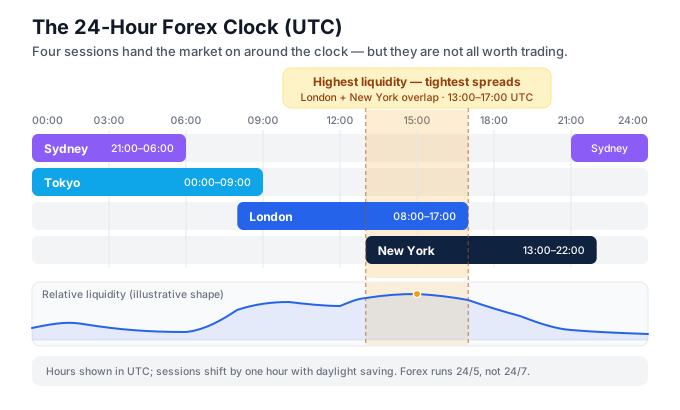
The market runs in four overlapping regional sessions. Hours below are UTC, and each shifts by an hour when daylight saving changes.
| Session | UTC hours |
|---|---|
| Sydney | 21:00–06:00 |
| Tokyo | 00:00–09:00 |
| London | 08:00–17:00 |
| New York | 13:00–22:00 |
The single most useful scheduling fact for a beginner: London and New York are both open from 13:00 to 17:00 UTC. That four-hour overlap is the highest-liquidity window of the day, with the tightest spreads and the cleanest movement in EUR/USD and GBP/USD. If you can only trade for two hours a day, take them from that window. There is more detail on each session’s behaviour in the guide to forex trading sessions.
The mirror image is worth knowing too. The hour or so around the daily rollover, at the end of the New York session, is the thinnest of the 24 — spreads on some pairs widen to several times their daytime level, and a stop placed just beyond a level can be swept by a move that nobody would call real. Avoid opening new positions there.
Now the consequence of 24/5 flagged in Step 1: trading stops at the Friday New York close and reopens Sunday evening. Price can reopen away from where it closed — a weekend gap — and a stop-loss sitting inside that gap is filled at the next available price, not your level. If EUR/USD closes at 1.0850 with your stop at 1.0820 and it reopens at 1.0790, you are out at roughly 1.0790, not 1.0820: a 60-pip loss where you planned 30. Consider closing positions before the weekend until you understand that risk.
Match your style to your hours
| Style | Timeframe | Hold time | Screen time |
|---|---|---|---|
| Scalping | M1–M5 | Seconds to minutes | 2–4 focused hours daily |
| Day trading | M15–H1 | Hours, flat by the close | 2–3 hours daily |
| Swing trading | H4–D1 | Days to weeks | 20–30 minutes daily |
| Position trading | D1–W1 | Weeks to months | A few hours weekly |
If you have a full-time job, you are a swing trader. Pretending otherwise is how people end up scalping badly on a phone during meetings.
Gold (XAU/USD): the beginner trap
Gold attracts beginners because it moves. That is exactly why it hurts them.
House convention: 1 XAU/USD pip = $0.01 = $1 per 100-ounce standard lot. It is never $10. A typical daily range of $20–$50 is therefore 2,000–5,000 pips, against a spread that commonly sits at 15–35 pips.
So a trader who sizes gold the way they size EUR/USD is carrying many times the intended risk: a routine $30 adverse move is 3,000 pips, worth $3,000 on a standard lot. Gold demands its own position-size calculation every time — the worked example is in Step 7.
Why forex rather than shares or crypto
Forex offers long hours, high leverage and deep liquidity in a handful of instruments driven mainly by interest rates and economic data. Shares trade in a fixed daily window with far lower leverage and are driven by company earnings — compare the two properly in forex versus stocks. Crypto runs 24/7 with far larger percentage swings and thinner regulatory protection, covered in forex versus crypto. Pick one market and learn it before adding another.
One pair, chosen hours. Now define exactly what makes you click.
Step 6: Build a trading plan with a real entry signal
Most beginners never define what makes them click buy. They look at a chart, feel something, and enter. That is not a method — it is a mood. This step replaces the mood with a written specification.
Read a candlestick first
Every candle shows four prices for a fixed slice of time: the open, high, low and close. The thick part — the body — spans open to close. The thin lines above and below — the wicks — reach to the high and the low.
A long wick is the most useful thing on the chart. It means price went there and was pushed back before the candle closed. A candle with a long lower wick and a small body near the top says sellers drove price down and buyers rejected it. That rejection is evidence, not proof.
One practical warning: on most platforms the candle you are watching is unfinished. A rejection wick that looks perfect ten minutes into an H4 candle can be a solid down-close by the time the candle actually completes. Read signals from closed candles only, or you are trading a shape that has not happened yet.
Pick two timeframes, not seven
Each candle covers one unit of time. On H4, one candle is four hours. On D1, one candle is one day.
| Timeframe | One candle covers | Typical use |
|---|---|---|
| M1 / M5 | 1 / 5 minutes | Scalping; very noisy |
| M15 / M30 | 15 / 30 minutes | Entry timing |
| H1 | 1 hour | Structure or entries |
| H4 | 4 hours | Structure for swing trades |
| D1 | 1 day | Overall trend |
The beginner default is one higher timeframe for structure (H1 or H4) and one lower timeframe for entry timing (M15 or M30). Two charts. Adding more does not add clarity, it adds excuses.
Define trend mechanically
An uptrend is a sequence of higher highs and higher lows. A downtrend is lower highs and lower lows. Anything else is sideways, and sideways is where beginners lose the most money because every signal fires and none of them follow through.
Mark the swing points on your chart and read the sequence. If you cannot label two higher highs and two higher lows, you do not have an uptrend — you have a hope.
Levels are zones, not lines
A level is a price where the market previously turned. Draw it from prior swing highs and swing lows: find the pivot, extend a horizontal line right. Price rarely honours the exact tick, so treat each level as a band of maybe 10 to 20 pips rather than a single line — that is why we teach support and resistance as zones.
A zone that keeps widening is a zone you are arguing with. If a level needs 40 pips of latitude to look respected, the market is telling you there is no level there, and the honest response is to drop it rather than to keep stretching it until it fits.
Fundamentals and technicals do different jobs
They are not rivals. Fundamentals set direction over weeks and months; technicals set your entry over hours.
Put concretely: a widening rate differential is a reason a pair might trend for six weeks, but it will never tell you whether to buy at 1.0820 or 1.0870. A support zone tells you where to buy, but it will never tell you that the central bank meets on Thursday. You need technicals to trade and fundamentals to avoid being blindsided — the fuller comparison is in fundamental versus technical analysis.
What a signal actually is
A signal is a pre-written set of conditions that must all be true before you click. Not two of three. All of them. If you cannot write the conditions down before the trade, you do not have a signal.
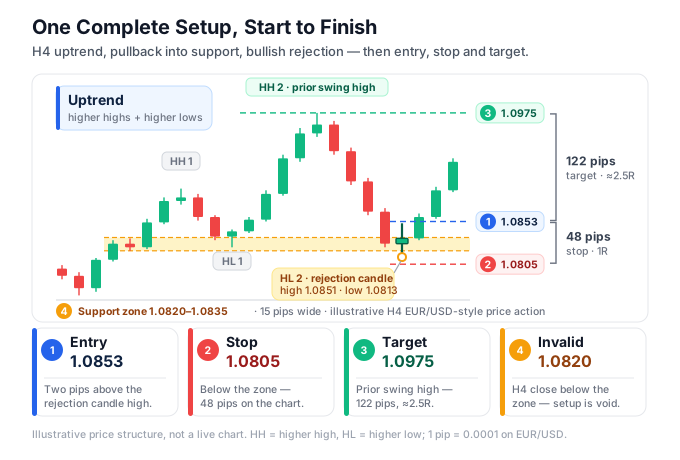
Here is one complete setup, end to end, on EUR/USD H4:
- Context: H4 shows a clear uptrend — two higher highs, two higher lows.
- Location: price pulls back into a prior support zone at 1.0820–1.0835.
- Trigger: a bullish rejection candle closes inside the zone with a long lower wick. Say its high is 1.0851.
- Entry: 1.0853, just above that candle’s high.
- Stop: 1.0805, below the zone.
- Target: the prior swing high at 1.0975.
Do the arithmetic. Risk is 1.0853 − 1.0805 = 0.0048 = 48 pips. Reward is 1.0975 − 1.0853 = 0.0122 = 122 pips. That is roughly 2.5:1.
Two details that change the numbers slightly and are worth building into the habit. You buy at the ask, so a 1-pip spread makes your true entry about 1.0854 and your true risk 49 pips rather than 48. And your stop closes at the bid, so on a sell trade the spread works against you at the exit instead. Round your risk up, never down — so the chart distance is 48 pips, and the number you size on is 49.
What invalidates it: an H4 candle closing below 1.0820. At that point the zone has failed, the higher-low sequence is broken, and the idea is dead whether or not the stop has been hit.
Where to place your stop — and why size follows the stop, never the reverse
Two lines define the trade: your entry and your stop. You place the stop where your trade idea is proven wrong — beyond the swing level or the structure you traded — not at the distance your wallet finds comfortable. The gap between those two lines is your risk in pips, and it is the input everything else depends on.
Size comes after, never before. Once the stop is fixed, the lot size is whatever keeps the loss inside 1% of your account: position size = (account x risk%) / (stop in pips x pip value). On a $10,000 account risking 1% ($100), sizing on the spread-adjusted 49 pips, that is $100 / (49 x $10) = 0.204 lots.
Always round the lot size down, never up. 0.204 rounds to 0.20 lots, which risks 0.20 x 49 x $10 = $98, just inside your $100 limit. Round up to 0.21 instead and you risk $102.90 — over the 1% rule you just set. The rounding is small; the habit of breaking your own limit is not.
Do it the other way round and one of two things breaks. Decide “I’ll trade 1 lot” first and keep the honest 48-pip stop, and you are risking 48 x $10 = $480, or 4.8% of the account — nearly five times the rule. Keep the 1% figure instead and you are forced to squeeze the stop to 10 pips ($100 / (1.0 x $10)) to make the big lot fit, which parks it inside normal intraday noise where it gets hit on moves that mean nothing. Step 7 turns the 48-pip distance into the lot size for you.
The plan as a fillable spec
A plan is not an inspirational list. It is nine fields you fill in and obey:
- Pairs traded (one to start)
- Sessions traded
- Structure timeframe and entry timeframe
- Entry trigger (written as conditions)
- Stop rule
- Target rule
- Max risk per trade
- Max daily loss, after which you stop
- News policy — whether you trade around scheduled releases
Fill these in using our trading plan template. A plan that is not written down is not a plan; it is a memory you will edit after every loss.
That last field, the news policy, needs one piece of background before you can write it honestly.
What actually moves currency prices: rates, central banks and the calendar
Charts show you what price did. Interest rates explain why. A currency is, at heart, a claim on a country’s short-term interest rate, so the single biggest driver of a pair’s direction over weeks and months is the gap between the two policy rates behind it.
The chain is short and worth memorising. A central bank raises its policy rate, the yield differential against the other currency widens, capital flows toward the higher-yielding currency because holding it now pays more, and the pair trends in that direction. That same differential then shows up inside your own account as swap — the small credit or debit applied when you hold a position overnight.
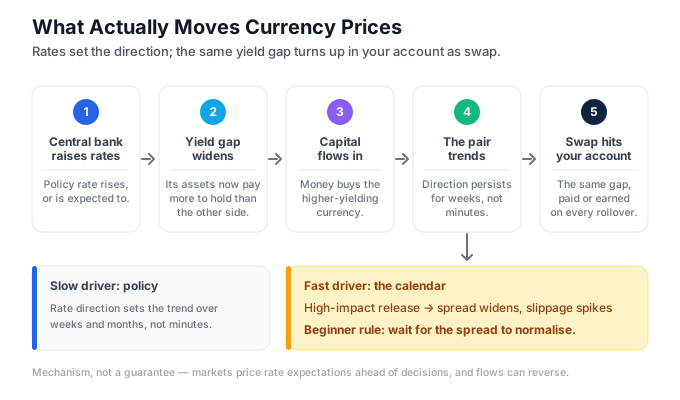
That is the whole causal loop: interest rates drive currency values at the market level and at the account level simultaneously.
Note that markets price the expected path, not the current level. A rate rise that everyone expected is usually already in the price by the time it is announced, which is why a currency can fall on a hike. What moves price is the change in expectations — the wording of the statement, the vote split, the press conference.
The four central banks you will actually meet
| Central bank | Currency | Pairs it moves most | Scheduled policy meetings per year |
|---|---|---|---|
| Federal Reserve (Fed) | USD | EUR/USD, USD/JPY, GBP/USD, XAU/USD | 8 |
| European Central Bank (ECB) | EUR | EUR/USD, EUR/GBP, EUR/JPY | 8 |
| Bank of England (BoE) | GBP | GBP/USD, EUR/GBP | 8 |
| Bank of Japan (BoJ) | JPY | USD/JPY, EUR/JPY | 8 |
The Fed matters most because the US dollar is on one side of most of the volume you will trade. If you only follow one calendar, follow that one. The mechanics of how central bank decisions ripple into price are the same everywhere, only the currency changes.
The releases that move price hardest
Four categories do most of the damage: interest rate decisions, inflation (CPI), GDP, and US Non-Farm Payrolls. NFP lands on the first Friday of most months at 08:30 New York time and is violent for a simple reason — it is the labour-market input the Fed watches, it is a single headline number, and the entire market repositions on it at once. Spreads on EUR/USD can widen several times their normal size for a few seconds and fills come through with heavy slippage. Read up on how NFP trades in practice before you go near it.
Reading the calendar
An economic calendar lists the date and time (set it to your own timezone first), the currency affected, an impact rating, and three numbers: previous, forecast and actual. Price does not react to the actual number. It reacts to the surprise — actual versus forecast.
Say forecast NFP is 180,000 and actual prints 275,000. The surprise is +95,000 jobs, and the dollar typically strengthens on it. A 275,000 print against a 300,000 forecast is a 25,000 miss, and the dollar can fall on the same “strong” number. Revisions to the previous month complicate it further: a strong headline paired with a large downward revision to the prior print often produces a sharp move that reverses within minutes.
Learn how to read the economic calendar properly before you need it in a hurry.
The beginner’s news policy
State it as a rule and follow it without exceptions:
- Check the calendar before every session.
- Do not open or hold a position through a high-impact release on a pair that release affects.
- Trade after the release, once the spread has returned to normal.
One more honest point. An unexpected central bank move can gap price straight through your stop-loss, filling you far worse than the level you set. Your stop is not a guarantee — your position size is what actually caps the damage. Which brings us to the section that matters most.
Step 7: Risk management and position sizing
Everything before this section was preparation. This is the part that decides whether you are still trading in a year.
The 1% rule, expressed as survival
Risk no more than 1% of your account balance on any single trade. That is not a slogan — it is arithmetic about how long you can be wrong.
Ten losses in a row is a normal, unremarkable event for a strategy that wins 45% of the time. At 1% risk, ten consecutive losses take a $10,000 account to roughly $9,044 — a 9.6% drawdown you can trade out of. At 10% risk, the same streak leaves $3,487, a 65% loss. The strategy did not change. Only the size did.
The formula
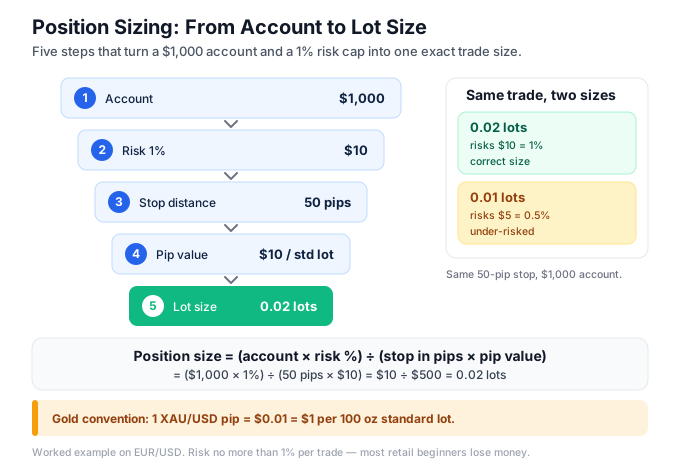
Position size (lots) = (Account × Risk %) ÷ (Stop distance in pips × Pip value per lot)
You need three inputs before you can size anything: your balance, the stop distance your setup requires, and the pip value of the instrument. Step 6 decides where the stop goes. This step only decides what size that stop implies.
Worked example 1 — the one most beginners get wrong
Account: $1,000. Risk: 1% = $10. Setup: EUR/USD with a 50-pip stop. Pip value: $10 per pip per standard lot.
($1,000 × 0.01) ÷ (50 × $10) = $10 ÷ $500 = 0.02 lots
That is two micro lots, worth $0.20 per pip. Check it: 50 pips × $0.20 = exactly $10. Correct.
Note what a single micro lot would do. At $0.10 per pip, 50 pips risks $5 — half a percent. Safe, but not the answer. Rounding down is always the conservative error; rounding up to 0.05 lots would risk $25, which is 2.5% of the account.
Worked example 2 — tighter stop, bigger position
Same $1,000 account, same $10 of risk, but a 20-pip stop.
($1,000 × 0.01) ÷ (20 × $10) = $10 ÷ $200 = 0.05 lots
The position is 2.5× larger, yet the money at risk is identical. A tighter stop does not mean less risk — it means more size for the same risk, and less room before you are stopped out.
Worked example 3 — the Step 6 setup, sized
Take the EUR/USD trade specified in Step 6. The chart distance from entry to stop is 48 pips; the 1-pip spread rounds that up to 49 pips of true risk, and you always size on the rounded-up figure. On a $1,000 account at 1% risk:
($1,000 × 0.01) ÷ (49 × $10) = $10 ÷ $490 = 0.0204 lots, rounded down to 0.02 lots
At $0.20 per pip, 49 pips risks $9.80 and the 122-pip target returns $24.40. Always round the lot size down. Rounding up breaks the rule by design.
Worked example 4 — gold, where the convention trips people up
The house convention from Step 5 applies to the arithmetic here: 1 XAU/USD pip = $0.01 = $1 per pip per 100-ounce standard lot, never $10.
Account: $5,000. Risk: 1% = $50. Stop: 2,000 pips (a $20 move).
$50 ÷ (2,000 × $1) = 0.025 lots
Check it: 0.025 lots is $0.025 per pip; 2,000 × $0.025 = $50. Correct.
Now apply the rounding rule, because gold is where it bites. Only a broker offering a 0.001 lot step lets you trade 0.025 exactly. On the far more common 0.01 step you round down to 0.02 lots, risking 2,000 × $0.02 = $40, or 0.8% of the account. And if the minimum gold size is 0.10 lots, one pip is $0.10 and your 2,000-pip stop risks $200 — four times your limit. You cannot take that trade at this account size, and the correct response is to skip it, never to widen the risk or shrink the stop to make it fit.
Pip value ladder (USD-quoted pairs)
A recap of the lot ladder from Step 1, with the column that matters most here:
| Lot | Units | Pip value | 50-pip loss |
|---|---|---|---|
| Standard (1.00) | 100,000 | $10.00 | $500 |
| Mini (0.10) | 10,000 | $1.00 | $50 |
| Micro (0.01) | 1,000 | $0.10 | $5 |
Run the numbers yourself in the lot size calculator rather than sizing by feel.
Risk-to-reward and expectancy
Sizing keeps you alive; the reward side is what makes you money. At a 1:2 ratio you can be wrong more often than right and still profit.
Expectancy = (Win rate × Average win) − (Loss rate × Average loss).
Risking $10 to make $20 with a 40% win rate: (0.40 × $20) − (0.60 × $10) = $8 − $6 = +$2 per trade. Six losses out of ten, still profitable. At 1:1 the same 40% win rate gives (0.40 × $10) − (0.60 × $10) = −$2 per trade. Same trades, opposite outcome, purely from where the target sat.
The catch is that ratio and win rate are linked. Pushing the target further out raises the reward but lowers the share of trades that ever reach it, so you cannot improve expectancy simply by moving the target. Only the journal tells you where your own balance sits.
Drawdown and the recovery asymmetry
Losses and gains are not symmetrical. Down 20%, you need +25% to get back to breakeven. Down 50%, you need +100%. The 10%-risk streak above left $3,487 of a $10,000 account, and getting back to $10,000 from there requires a +187% gain — nearly a triple, on a method that had just lost ten in a row. Avoiding the deep hole is worth far more than digging out of it well, which is why handling a losing run properly matters more than any entry technique.
Portfolio-level limits
One trade at 1% is not the whole picture. Correlated positions are one position wearing three costumes: long EUR/USD, long GBP/USD and short USD/CHF are all a short-dollar bet.
Set three ceilings and write them into your plan:
- Maximum total open risk: 3% across all positions, counting correlated pairs as one.
- Maximum daily loss: 3%. Hit it and you stop for the day.
- Maximum weekly loss: 6%. Hit it and you stop until Monday.
Over-sizing and stacking correlated trades are the two most expensive mistakes beginners make, and both are prevented by numbers you decide before the market opens.
Correct sizing does not turn a losing method into a winning one. It buys you enough time to find out which one you have.
Placing, managing and closing your first trade
You have a setup, a stop level and a lot size. This section turns that into a live position and back into cash again.
The order ticket, field by field
In MT4 or MT5, press F9 or double-click the symbol in Market Watch to open the ticket.
- Symbol — the instrument, e.g. EURUSD. Check it. Buying the wrong symbol is a common first-week error.
- Volume — this is your lot size, the number you calculated in Step 7. Type
0.02, not2. On most brokers the minimum step is 0.01. - Stop Loss and Take Profit — these take prices, not pip distances. If EUR/USD is 1.0850 and your stop is 25 pips below, you type 1.0825.
- Comment — a free-text field. Put your setup name here so your statement is self-labelling later.
- Type — Market Execution or Instant Execution, plus a Deviation field.
- Sell by Market (red) and Buy by Market (blue) — the confirm buttons.
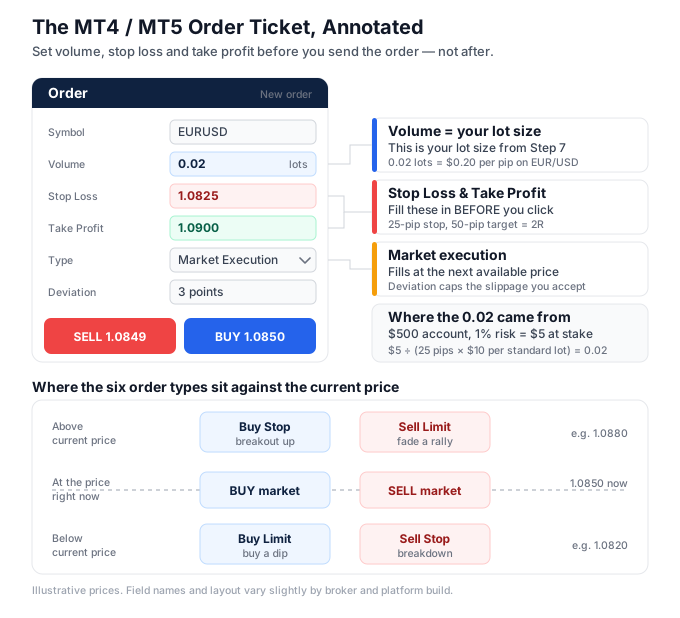
Worked example. You buy 0.02 lots of EUR/USD at 1.0850, stop 1.0825, target 1.0900. One pip on 0.02 lots is $0.20. Risk is 25 × $0.20 = $5. Reward is 50 × $0.20 = $10. A 1:2 trade, and you know both numbers before you click.
Instant vs market execution
Instant execution asks for a specific price; if the market has moved past it, the broker rejects or requotes. The Deviation (or “maximum deviation”) field sets how many points of movement you will accept before that happens — set it to something like 3–10 points on majors so ordinary movement does not block your fill. Market execution fills you at whatever the next available price is, with no requote — so the deviation field is inactive.
The practical difference shows up at the worst moment. In a fast market, instant execution protects your price and may leave you without the fill you wanted; market execution guarantees the fill and lets the price move against you. Neither is safer in the abstract. If your method depends on getting out at a specific level, requotes are the enemy; if it depends on always being in when the signal fires, slippage is the cheaper cost.
The six order types
| Order | Where it sits | Beginner use |
|---|---|---|
| Market | At current price | Enter now, setup is already valid |
| Buy limit | Below current price | Buy a pullback into support |
| Sell limit | Above current price | Sell a rally into resistance |
| Buy stop | Above current price | Buy a breakout upward |
| Sell stop | Below current price | Sell a breakdown |
| Trailing stop | Follows price | Lock in gains on a runner |
Limit orders buy cheaper or sell dearer than now; stop orders buy higher or sell lower, confirming momentum first. Full definitions live in our guide to forex order types. Note that MT4’s trailing stop is client-side — it only works while your terminal is running. And attaching both a stop and a target is effectively an OCO pair: whichever fills first cancels the other.
If you leave a pending order out overnight, set an expiry on it. A buy limit resting under support for three days will eventually be filled by a market that has stopped agreeing with your original reason for placing it.
Fill the stop in before you confirm
Type the stop loss and take profit into the ticket before you press Buy or Sell. A stop you intend to add in a minute does not exist, and the minute you need it is the minute you will be frozen watching the chart.
Your stop can still fill worse than its price on a weekend gap or a news spike, because a stop becomes a market order once touched and fills at the next available price. That is slippage doing its job — getting you out — not the broker cheating you.
Holding overnight
Positions still open at the broker’s daily rollover (typically 5pm New York time) are charged or credited the interest differential between the two currencies. Most brokers triple it on one weekday — usually Wednesday — to cover the weekend’s value dates. That is the answer to “why did money disappear overnight”; see swap in forex. On a short swing trade the amount is trivial; on a position held for weeks in an exotic pair it can quietly exceed the profit you were waiting for, so check the swap figures in the symbol specification before you plan to hold.
Managing and closing
You may move a stop to reduce risk — to breakeven once the trade is well in profit, or partially closing half the position at the first target. You may never widen a stop to give a losing trade more room. That single habit destroys more small accounts than bad entries do.
Partial closes are worth a moment of arithmetic. On the 0.02-lot trade above, closing 0.01 lots at +25 pips banks 25 × $0.10 = $2.50 and leaves 0.01 lots running with the stop moved to entry. Your worst case is now +$2.50 rather than −$5, but your best case falls too, from $10 to $7.50 if the remainder reaches target. It is a trade of expectancy for comfort, which is sometimes the right trade and never a free one.
A trade ends three ways: the target fills, the stop fills, or you close it manually because the reason you entered has expired. All three are correct outcomes.
Keep your first several live trades deliberately tiny — 0.01 lots even if your maths allows more. The goal is a clean, repeatable process, not a profit.
After the trade: review, discipline, and the shortcuts people take instead
The trade is closed. What you do in the next ten minutes is what turns an event into data.
Journal every trade from the first one
Open a spreadsheet before your first demo trade and fill one row per position. Record: date, pair, session, setup name, entry price, stop price, target price, lot size, risk in dollars and as a percentage of the balance, exit price, the R-multiple of the result, and one line on whether you followed the plan.
That last column matters most. A losing trade that followed the plan is a cost of doing business. A winning trade that broke the plan is a warning.
R-multiple is simply the result divided by the amount you risked. Risk $50 and lose the full stop: that is −1R. Risk $50 and close at +$125: that is +2.5R. Working in R makes trades from different account sizes comparable — a +2R trade on a $500 account and a +2R trade on a $5,000 account are the same piece of evidence about your method, even though one paid ten times more.
Add a screenshot of the chart at entry to each row if you can. Six weeks later, your written reason for a trade and the chart you were actually looking at will often disagree, and that gap is the most useful thing in the file.
The four numbers that reveal an edge
Review the journal weekly and pull out four figures: win rate, average R won, average R lost, and expectancy. Apply the expectancy formula from Step 7 to your own rows rather than to a hypothetical.
Say 50 journalled trades give a 40% win rate, an average win of 2.1R and an average loss of 0.9R. Expectancy = (0.40 × 2.1) − (0.60 × 0.9) = 0.84 − 0.54 = +0.30R per trade. Across those 50 trades that is 15R — and at 1% risk per trade, 15% of the account. A negative expectancy over a decent sample means the method, not the market, is the problem.
Note the average loss of 0.9R rather than 1.0R. That is what good execution looks like: some trades were closed early when the setup expired, so the full stop was not always paid. An average loss above 1.0R is the opposite signal — it means stops are being widened or ignored.
Fewer than about 30 trades tells you almost nothing. Do not judge a method on five.
Discipline is where most accounts die
The gap between demo and live is emotional, not technical. The same setup on the same chart feels different when real money moves. Four behaviours cause most of the damage: revenge trading straight after a loss, doubling size after a win, moving a stop further away to avoid being wrong, and trading past your daily loss limit. Every one of them is a decision made outside the plan. Building the habits that keep you inside your rules is a separate skill from analysis, and it is learned by repetition.
In a losing streak, do the boring thing: cut position size, keep the plan unchanged until the review sample is complete, and stop for the day when you hit your loss limit. Changing method mid-drawdown destroys the sample you need to judge it.
The shortcuts, assessed honestly
| Shortcut | The failure mode to check |
|---|---|
| Signal services | No independently verified track record; results shown as screenshots rather than audited statements |
| Copy trading | You copy the leader’s leverage as well as their entries — their small drawdown can be a large one on your account |
| Expert advisors | Sold on curve-fitted backtests optimised over the same data they are shown to beat |
| Prop firm challenges | The daily and maximum drawdown rules, not the profit target, are what fail most candidates |
None of these removes the arithmetic in Step 7. If you cannot size a position correctly, a signal is just someone else’s guess at an unknown risk. Treat any performance figure you cannot independently verify as marketing, and read the rules carefully before attempting a funded-account evaluation.
Tax and records
Trading has tax consequences that vary by country and by instrument — CFD, spot and futures are often treated differently. Keep statements and your journal from the first trade, and speak to a qualified tax professional in your jurisdiction. This is not tax advice.
Your first 90 days
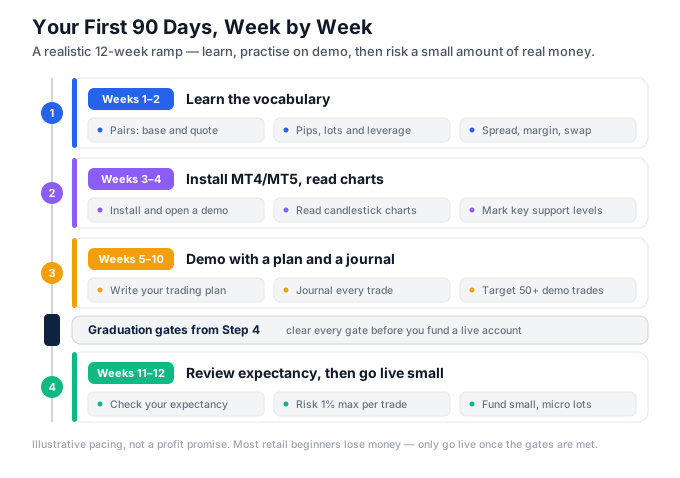
Weeks 1–2: vocabulary. Weeks 3–4: platform and charts. Weeks 5–10: demo with a written plan and a journal. Weeks 11–12: review expectancy and decide whether to fund a small live account.
Bottom line: learn the instrument, pick a regulated broker, understand leverage, practise on demo, choose one pair, write a plan, size every trade at no more than 1% risk, then review what the journal tells you. In that order.
Frequently asked questions
How do I start forex trading?
Learn how pairs, pips and lots work, open an account with a broker regulated in your jurisdiction, install MT4 or MT5, and practise on a demo for four to eight weeks. Then fund a small live account and trade a written plan that risks no more than 1% of your balance per trade.
What are the steps to start forex trading?
Seven, in order: learn the market mechanics; choose a regulated broker; fund the account and understand margin; set up the platform and demo trade; decide what and when you will trade; build a plan with a defined entry signal; then manage risk with the 1% rule and a calculated position size on every trade.
How much money do I need to start forex trading?
A practical floor is around $500. At 1% risk that gives you $5 per trade, which covers a 50-pip stop on one micro lot at $0.10 per pip. Below that, a normal stop forces you to over-risk. Most brokers accept $100 deposits, but $500 to $1,000 is more workable.
Can I start forex trading with $100?
Yes, most brokers accept a $100 deposit and micro lots let you trade 1,000 units at roughly $0.10 per pip. But 1% of $100 is $1, which only supports a 10-pip stop — too tight for most setups. Treat a $100 account as paid practice, not as capital.
Is forex trading good for beginners?
It is accessible, but the majority of retail traders lose money and UK- and EU-regulated CFD brokers must publish their own client loss rates. Forex suits you if you will commit months to learning, keep risk at 1% per trade and journal everything. It suits you badly if you expect quick income.
How long does it take to learn forex trading?
Expect a few weeks for the vocabulary, four to eight weeks of demo trading to build a repeatable process, and several months to a year before your results are consistent. The learning is not the hard part; doing the same disciplined thing 200 times in a row is.
How long should I trade on demo before going live?
At least four to eight weeks, and until you have logged 50 or more trades, followed your written plan on 90% or more of them, and shown positive expectancy across that sample. Set the demo balance to the exact amount you will actually deposit, or the sizing habits will not transfer.
How much leverage should a beginner use?
As little as you can, not as much as your broker allows. What matters is effective leverage, not the ratio offered: a $500 account holding 0.10 lots of EUR/USD carries about $10,850 of exposure, or roughly 21.7:1. Retail caps are near 30:1 on majors in the UK, EU and Australia, and around 50:1 in the US.
How much can a beginner realistically make in forex?
Most beginners lose money in their first year, so the honest planning assumption is a loss. As arithmetic only: 1% a month on a $1,000 account is $10 a month. That illustrates why small capital cannot replace an income. This is not a projection or a promise of returns.
Why do most beginner forex traders lose money?
Five recurring causes: position sizes too large for the account, trading without a stop-loss, no written plan so entries are improvised, revenge trading after a loss, and ignoring costs. Drawdown maths compounds all of them — a 50% loss needs a 100% gain just to break even.
Do I need MT4 or MT5 to start trading forex?
No, but almost every forex broker offers one or both, and MT4 has the largest library of free indicators and expert advisors. MT4 is forex-focused; MT5 is multi-asset with more timeframes. Indicators are not interchangeable between them, so pick the platform your tools are written for.
How do I know if a forex broker is legitimate?
Take the licence number from the broker’s website and check it on the regulator’s own public register — FCA, ASIC, CySEC or CFTC/NFA. Then test a small withdrawal early. Blocked withdrawals, bonus terms that lock your funds, guaranteed returns and ‘account managers’ who trade for you are the clearest warning signs.
Ready to put this into practice?
Open an account with a regulated broker and apply what you have learned. These are the three brokers we recommend:
Trading forex and CFDs carries a significant risk of loss and is not suitable for everyone. Broker links are affiliate links — we may earn a commission at no cost to you.